
Medical Places Changelog
Beginning on June 12, 2023, Motionworks is deprecating visitation scaling procedures for medical offices and hospital place types and solely using direct or unfocused methodologies. Motionworks measures visitation to places according to their visitation behavior and physical characteristics. The methodologies are summarized as:
- Direct: Any standalone place not part of a larger building or complex is measured from direct observation of visitations to the building or location.
- If a place, when measured using the direct methodology, doesn’t have sufficient observed visits, it will exhibit a noisy and scattered pattern. In this case, Motionworks reports visitation for the place looking back over the last several weeks to establish a stable pattern of activity.
- Unfocused: Any place that cannot be isolated because it may be part of a larger building or a complex goes through an unfocused methodology. The unfocused methodology uses similar directly measured places in the area as well as the activity of the parent place to produce the expected visitation and activity patterns for the place.
In earlier releases of medical office and hospital place types, Motionworks refined direct and unfocused visits to ensure consistency with third-party data provided by building owners and medical operators at some places.
For locations where these data existed, the visitations, regardless of the internal methodology (Unfocused vs. Direct - Stable or Noisy), were being scaled up or down using the third-party data provided for specific months to establish visitation trends and expectations for the location. For months where third-party data was provided, Figure 1 demonstrates that the monthly averages completely match these third-party data.
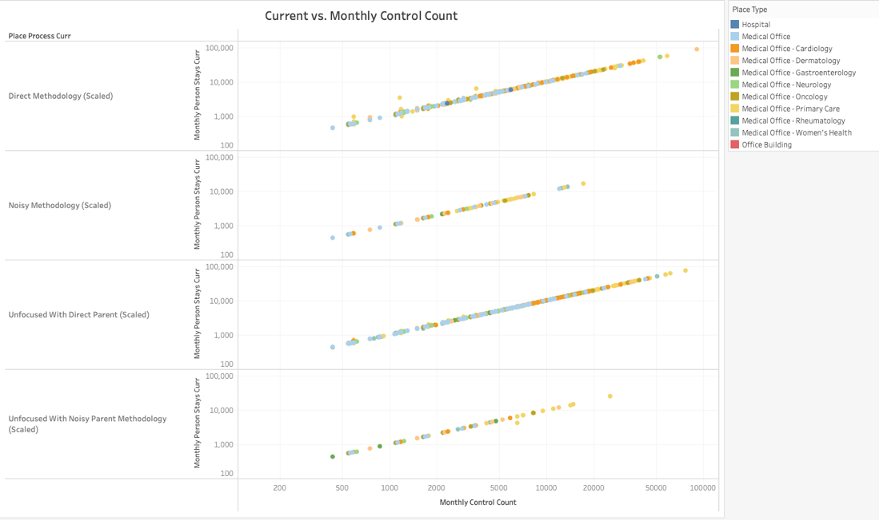
Figure 1: Current Visits vs. Monthly Control Count (For the months that third-party data was provided)
Comparing the unadjusted visits across all places (from 2019 forward), Figure 2 shows that the legacy visits were generally higher than the third-party data.
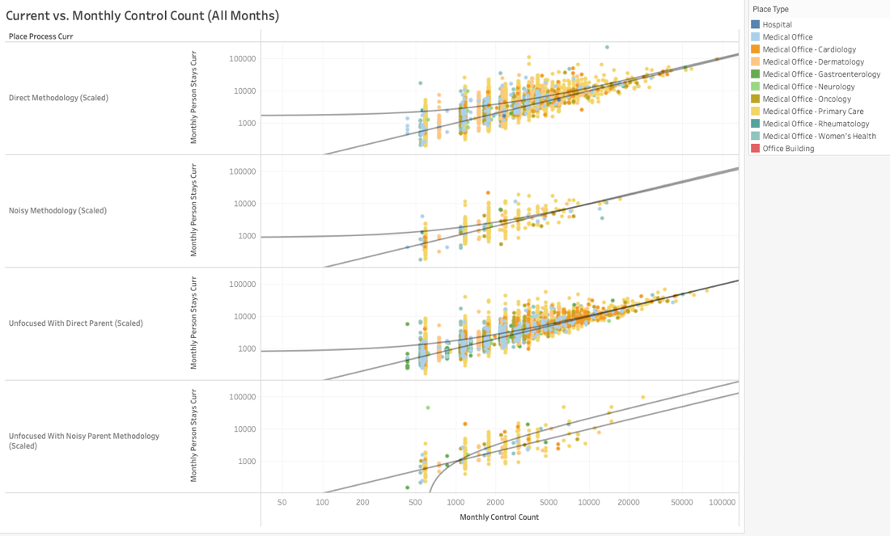
Figure 2: Current Visits vs. Monthly Control Count (For All Months)
Figure 3 shows how new average visit numbers compare for all medical place types across methodologies for the cleared medical office types and hospitals. The figure shows there are places that remain entirely the same since they did not have third-party data. Overall, visits to places across all methodologies increase except unfocused places with a noisy parent (bottom panel). Note that these are general average place type shifts and individual places may observe a decrease in the number of visits as part of this change. Figures 4 and 5 explain these shifts further.
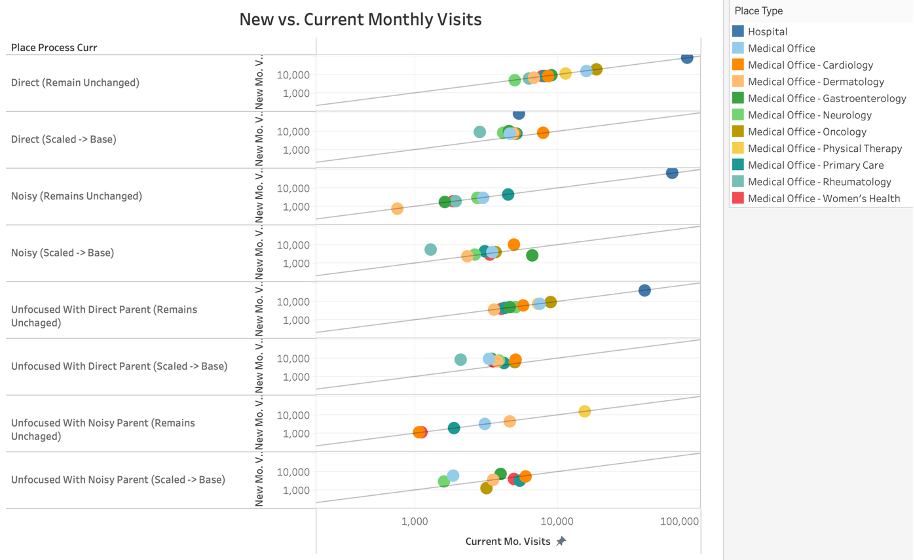
Figure 3: Current vs. New (Unscaled) Monthly Visits
Figure 4 summarizes the number of cleared places by place type and how they will shift if scaling is retired. For instance, close to 84 percent (~1,900 places) of general medical offices remain unchanged. Three percent (~70 places) will see a decrease, and the rest 13 percent (~300 places) will see an increase.
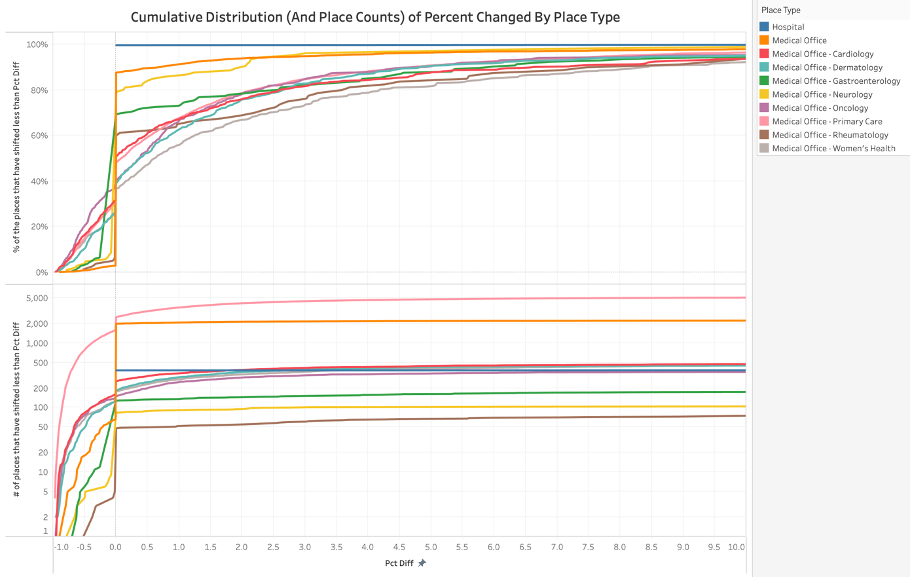
Figure 4: The % and the # of places distribution by percent difference excepted from current to new
The table below is the summary of the above graph which shows, by place type, how many, and what percentage of the cleared places moved in which direction. (Absolute counts by place type are in parentheses.)
| Place Type | Decreased | Unchanged | Increased |
|---|---|---|---|
| Hospital | 0% (0) | >99% (380) | <1% (1) |
| Medical Office | 3% (66) | 85% (1,953) | 12% (283) |
| Medical Office - Cardiology | 32% (162) | 19% (95) | 49% (252) |
| Medical Office - Dentist | 0% (0) | 100% (322) | 0% (0) |
| Medical Office - Dermatology | 26% (123) | 13% (63) | 61% (289) |
| Medical Office - Gastroenterology | 7% (12) | 63% (117) | 31% (57) |
| Medical Office - Neurology | 9% (9) | 70% (74) | 22% (23) |
| Medical Office - Oncology | 38% (144) | 2% (7) | 60% (225) |
| Medical Office - Physical Therapy | 0% (0) | 100% (51) | 0% (0) |
| Medical Office - Primary Care | 30% (1,608) | 18% (947) | 52% (2,757) |
| Medical Office - Rheumatology | 6% (5) | 54% (43) | 40% (32) |
| Medical Office - Women's Health | 26% (129) | 10% (51) | 63% (312) |
* Table may not add to 100 percent due to rounding.
These changes will shift the average and median number of visits per 1,000sqft for focused and cleared places that the size is known (Figure 5) and for all cleared places by place type (Figure 6).
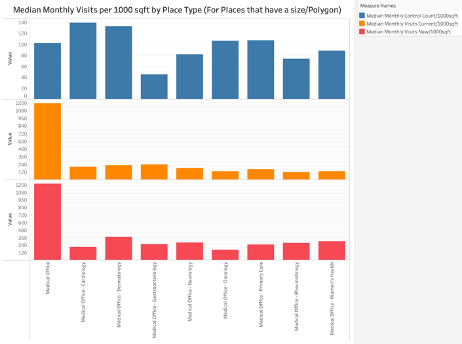
Figure 5: Median visits by place type (per 1000sqft)
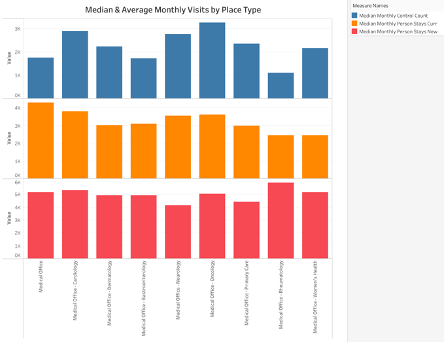
Figure 6: Median visits by place type (Overall for all places)