
Placecast™ by Date - Publication Date 2026-08-16
On August 16, 2026, Motionworks published an incremental update to its Placecast™ by Date product. This release incorporates an additional month of location analytics data for August 2025. Additionally, Motionworks has expanded coverage by incorporating 90,057 newly identified places into the dataset. The table below provides a comprehensive breakdown of place additions and totals by category.
Places Summary by Type
| Place Type | Previous Release Place Count | New Places | Current Release Place Count |
|---|---|---|---|
| Academic Building | 2,651 | 10 | 2,661 |
| Airport Concourse | 275 | 0 | 275 |
| Airport Terminal | 162 | 0 | 162 |
| Amusement Park | 2,659 | 0 | 2,659 |
| Auto Dealership | 27,925 | 75 | 28,000 |
| Bank | 9,371 | 23 | 9,394 |
| Bar | 184,671 | 1,122 | 185,793 |
| Business | 454,548 | 160 | 454,708 |
| Car Wash Facility | 30,120 | 3 | 30,123 |
| Casino | 3,238 | 36 | 3,274 |
| Child Care Facility | 255 | 6 | 261 |
| Cinema | 5,320 | 7 | 5,327 |
| Coffee Shop | 10,376 | 23 | 10,399 |
| Commercial Airport | 345 | 0 | 345 |
| Community Center | 3,598 | 0 | 3,598 |
| Convenience Store | 27,834 | 711 | 28,545 |
| Convention Center | 150 | 0 | 150 |
| Country Club | 5,415 | 3 | 5,418 |
| Drugstore | 13,585 | 186 | 13,771 |
| Event | 63 | 1 | 64 |
| Event Detection | 2 | 0 | 2 |
| Event Facility | 7,381 | 12 | 7,393 |
| Ferry | 26 | 0 | 26 |
| Fire Department | 528 | 1 | 529 |
| Food Court | 449 | 2 | 451 |
| Fraternal Organization | 10,783 | 10 | 10,793 |
| Gas Station | 4,832 | 23 | 4,855 |
| General Aviation Airport | 301 | 4 | 305 |
| Grocery Store | 75,938 | 438 | 76,376 |
| Gym | 134,968 | 123 | 135,091 |
| Hospital | 3,393 | 24 | 3,417 |
| Hotel | 158,117 | 16,539 | 174,656 |
| Indoor Rec | 69,796 | 25,510 | 95,306 |
| Institutional Housing | 5 | 0 | 5 |
| Laundromat | 1,001 | 22,790 | 23,791 |
| Lifestyle Center | 424 | 0 | 424 |
| Liquor Store | 2,720 | 22 | 2,742 |
| Lobby | 3 | 0 | 3 |
| Medical Office | 40,543 | 494 | 41,037 |
| Medical Office - Cardiology | 645 | 201 | 846 |
| Medical Office - Dentist Office | 7,128 | 6 | 7,134 |
| Medical Office - Dermatology | 1,174 | 141 | 1,315 |
| Medical Office - Gastroenterology | 305 | 150 | 455 |
| Medical Office - Neurology | 195 | 66 | 261 |
| Medical Office - Oncology | 535 | 26 | 561 |
| Medical Office - Physical Therapy | 3,858 | 14 | 3,872 |
| Medical Office - Primary Care | 20,094 | 1,414 | 21,508 |
| Medical Office - Rheumatology | 119 | 68 | 187 |
| Medical Office - Women's Health | 610 | 317 | 927 |
| Office Building | 9,357 | 3 | 9,360 |
| Outdoor Rec | 12,662 | 15,587 | 28,249 |
| Outlet Mall | 166 | 2 | 168 |
| Park | 19,298 | 6 | 19,304 |
| Parking Structure | 13,319 | 6 | 13,325 |
| Pedestrian Plaza | 75 | 2 | 77 |
| Quick Serve Restaurant | 218,109 | 68 | 218,177 |
| Residential Facility | 8,092 | 27 | 8,119 |
| Rest Stop | 102 | 0 | 102 |
| Retail | 39,890 | 687 | 40,577 |
| Shopping Center | 7,310 | 6 | 7,316 |
| Shopping Mall | 4,509 | 5 | 4,514 |
| Sitdown Restaurant | 843,420 | 2,653 | 846,073 |
| Spiritual Center | 1,550 | 7 | 1,557 |
| Stadium | 4,111 | 7 | 4,118 |
| Streetscape | 62 | 1 | 63 |
| Student Center | 180 | 1 | 181 |
| Theater | 22,225 | 3 | 22,228 |
| Tourist Attraction | 38,984 | 1 | 38,985 |
| Trail | 138 | 0 | 138 |
| Transit Hub | 91 | 5 | 96 |
| Transit Station | 3,576 | 211 | 3,787 |
| University Campus | 268 | 0 | 268 |
| University Dining | 63 | 2 | 65 |
| University Health Center | 20 | 0 | 20 |
| University Housing | 449 | 1 | 450 |
| University Recreation Center | 245 | 0 | 245 |
| Warehouse and Manufacturing | 652 | 5 | 657 |
Transit Updates
On August 17, 2026, Motionworks published an update to the method by which Placecast™
estimates activity at rail transit stations. Where a transit operator publishes
station-level ridership, those counts now determine the station-level estimate.
Operator-reported ridership enters the product through two distinct mechanisms. The
mechanism applied to a system determines whether that system's total is affected:
- Operator-anchored station shares. The operator's published station distribution
determines how a system's ridership is apportioned across its stations. The system total
continues to be sourced from the Federal Transit Administration's National Transit
Database (NTD) and is unchanged. - Direct operator counts. The operator's reported station counts determine the station
estimate directly. For these systems the agency total is the operator's reported figure
rather than the NTD figure, and the agency total is therefore subject to change.
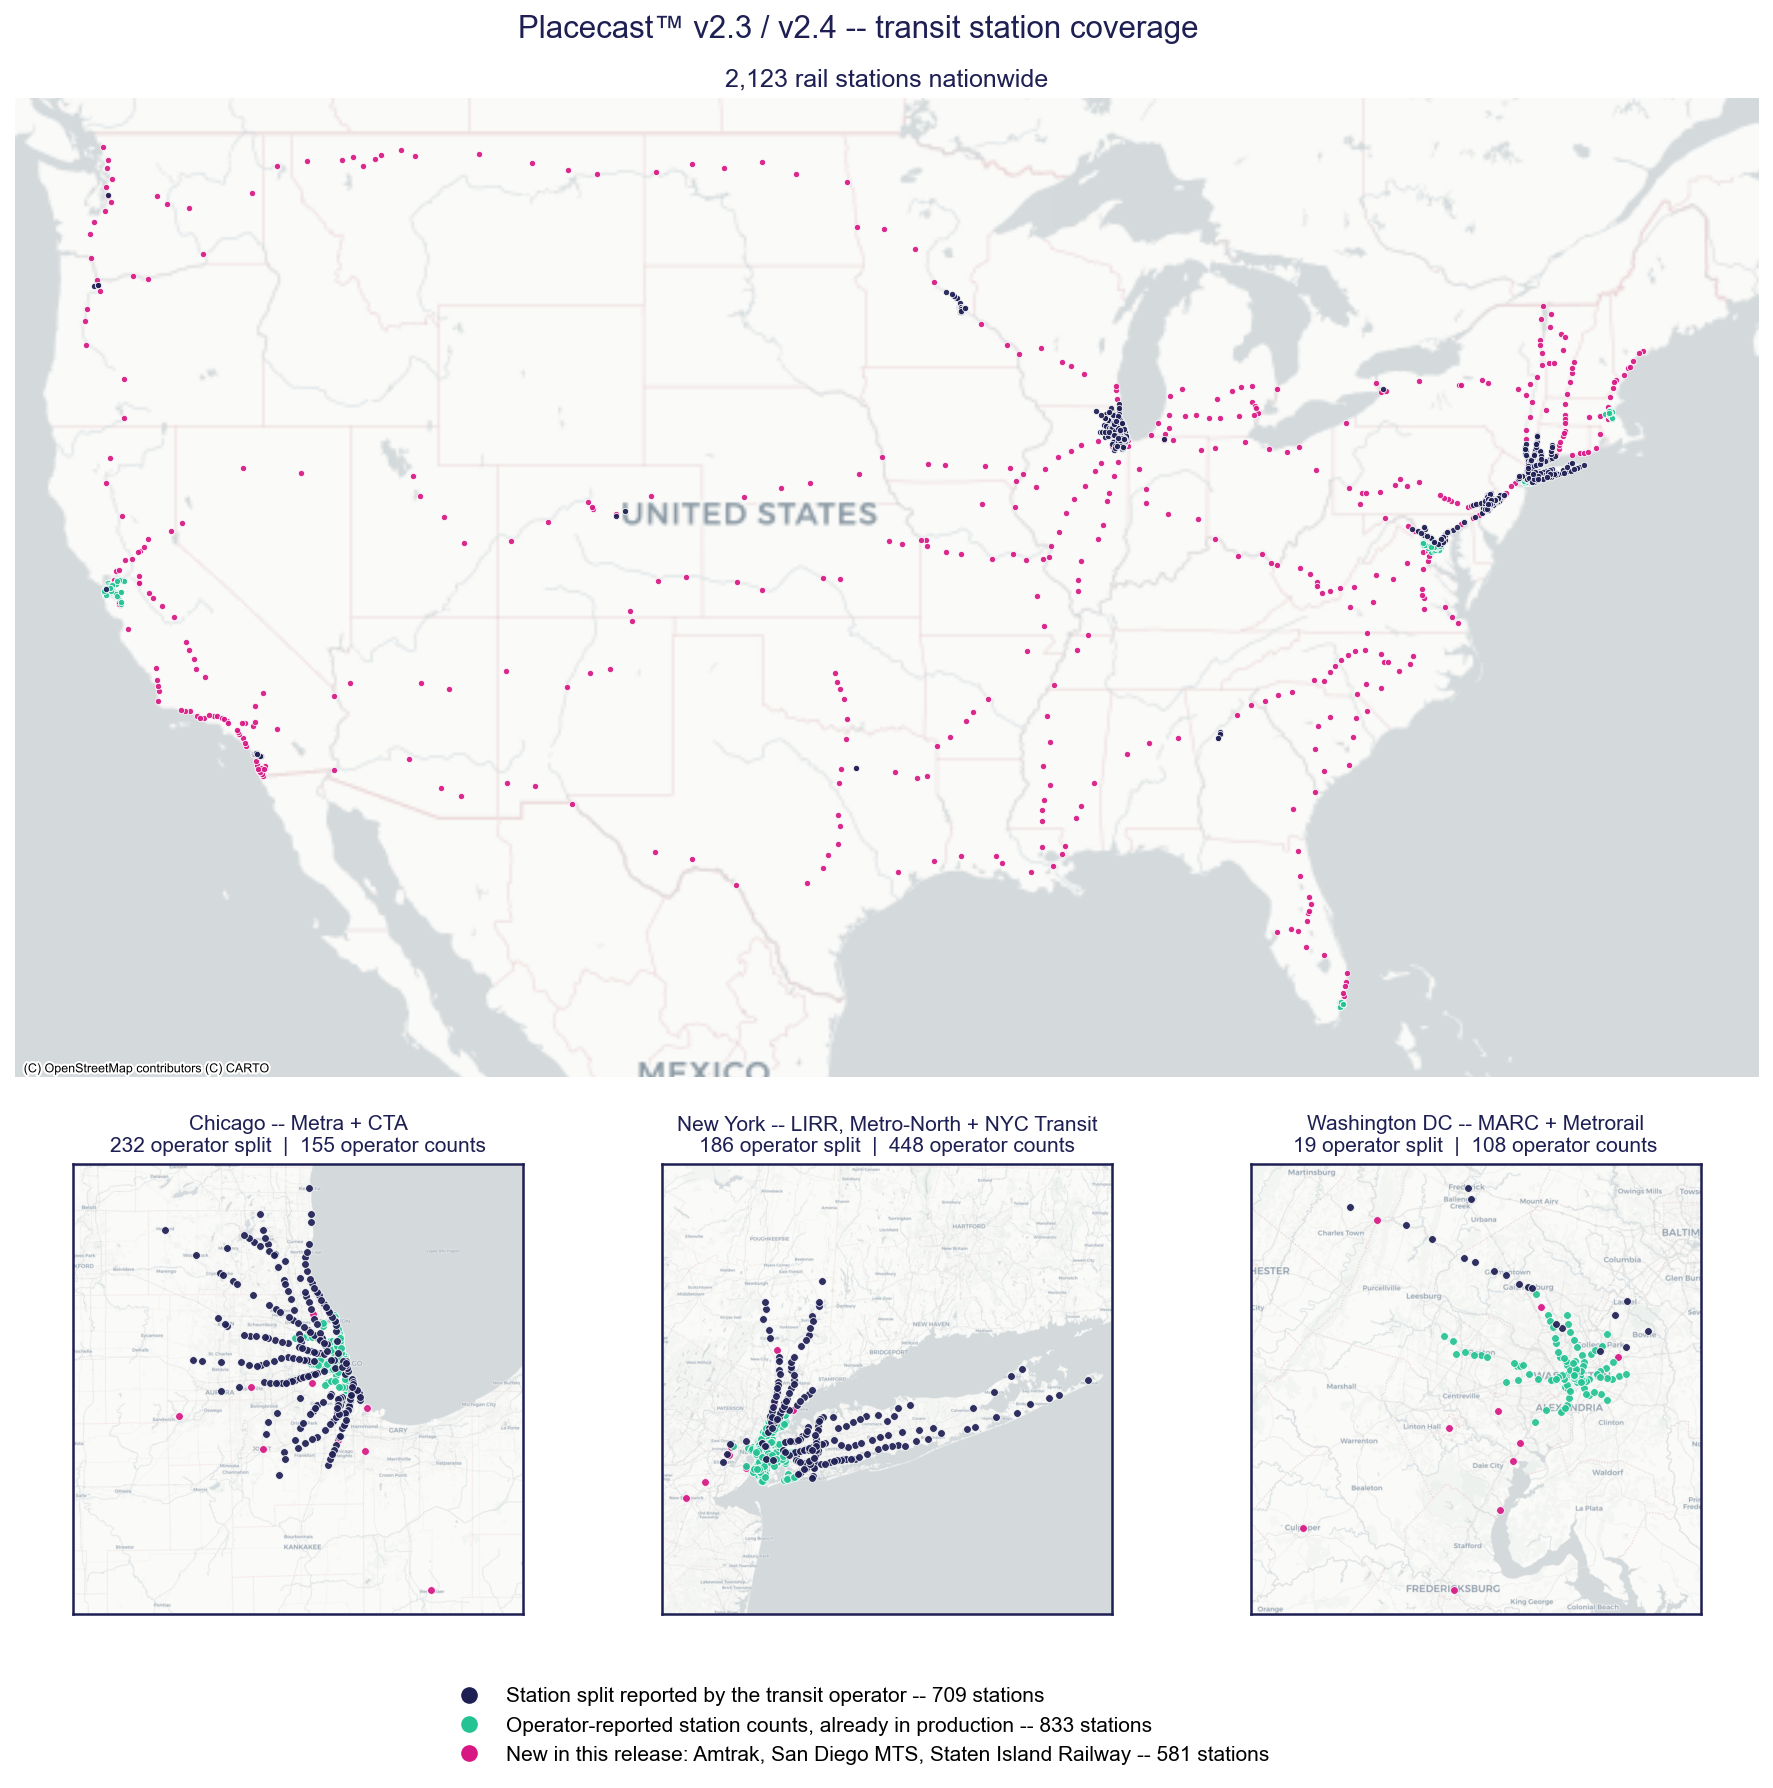
This release covers 757 rail stations across 17 transit agencies on operator-anchored
shares and introduces three new direct operator feeds covering 582 stations.
Station-Level Ridership Coverage
For the systems listed below, the station-level distribution is tracked on a monthly basis
rather than held at a single fixed value. This approach preserves seasonal variation -
including university-term travel, summer resort and event service, and stadium-driven
demand - that a single annual figure would average away.
| Transit System | Stations | Station-Level Resolution | Monthly Tracking Begins |
|---|---|---|---|
| Metra | 239 | Monthly | July 2025 |
| MTA Long Island Rail Road | 125 | Monthly | September 2023 |
| MTA Metro-North Railroad | 112 | Monthly | September 2023 |
| MARC Train (Maryland Transit Administration) | 41 | Monthly | October 2023 |
| NCTD Sprinter | 15 | Monthly | September 2023 |
Prior to the date indicated, these systems carry the operator's most recent published
station distribution rather than a monthly series. Refer to Basis Changes Within a
Series below.
Plotted across the calendar year, the seasonal pattern is consistent from one year to the
next, and the variation between peak and off-peak months is substantial.
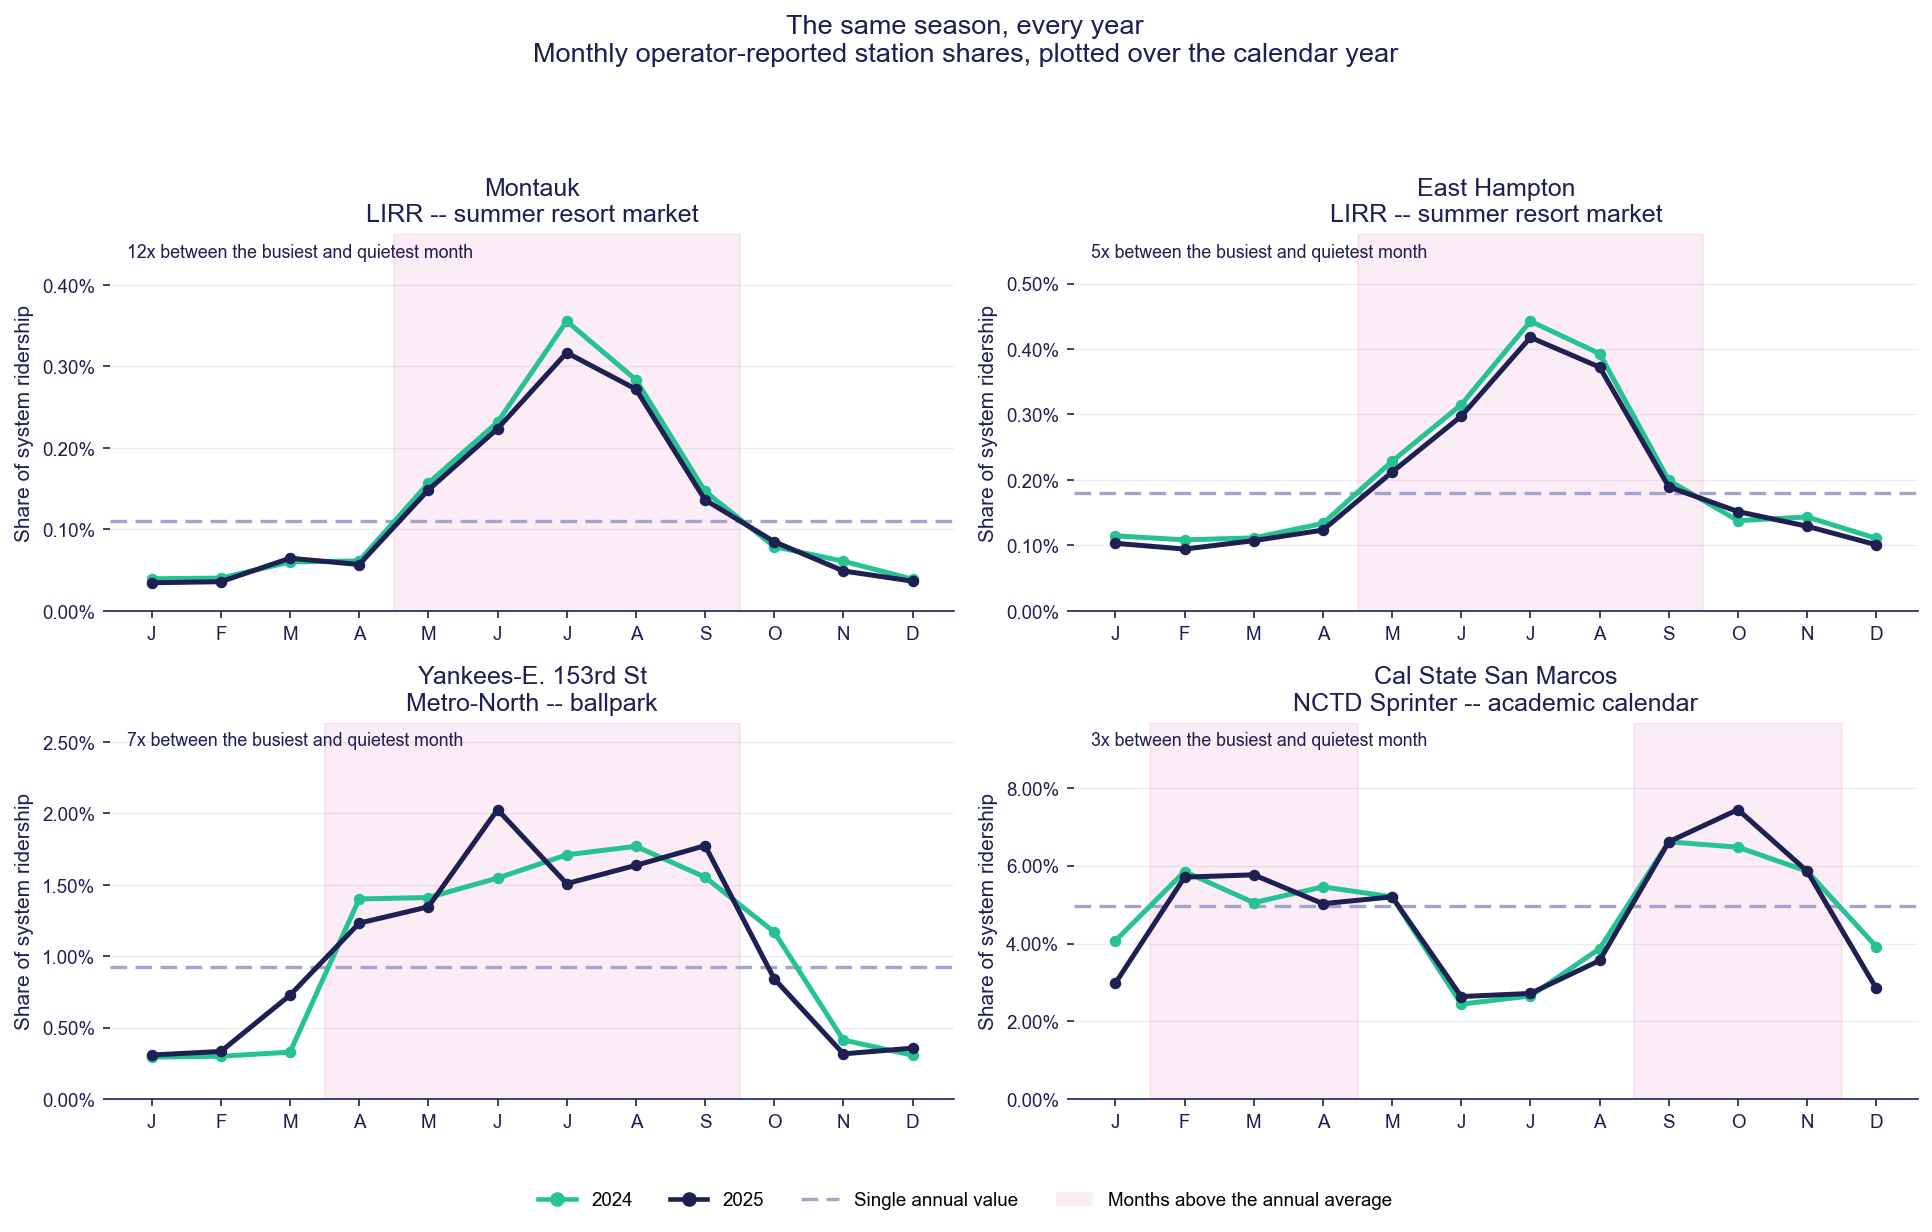
Montauk varies twelve-fold between its busiest and quietest month, and Yankees-E. 153rd
Street sevenfold. A single annual value would assign an equivalent audience to those
stations in February and in July.
A further 12 agencies covering 227 stations are anchored to a published station-level
distribution that is held constant rather than tracked monthly: SEPTA Regional Rail, Metro
Transit (Twin Cities), MARTA, Denver RTD, NJ Transit, TriMet, Sound Transit, Caltrain,
DART, CT Rail, South Shore Line, and NFTA Metro Rail. SEPTA Regional Rail and NJ Transit
transition between operator census vintages - SEPTA in January 2024 and NJ Transit in July
2024 - rather than being held at a single value across the entire series.
New Direct Operator Feeds
Station-level ridership is now ingested directly from three additional operators, in
addition to the direct feeds already in production:
| Operator | Stations | Source Resolution |
|---|---|---|
| Amtrak | 517 | Annual, by federal fiscal year |
| San Diego Metropolitan Transit System | 63 | Daily |
| Staten Island Railway | 2 | Daily |
Amtrak publishes station boardings once per federal fiscal year rather than daily. These
annual figures are apportioned across the months of the fiscal year using Amtrak's
systemwide monthly travel profile. An Amtrak station's month-to-month variation therefore
reflects that systemwide profile rather than a station-specific monthly measurement.
Amtrak does not report to the National Transit Database. Amtrak station estimates are
anchored to Amtrak's published station boardings and are not reconciled to an NTD system
total.
Staten Island Railway was previously reported within MTA New York City Transit. It is now
resolved as a separate system, which also revises the station-level distribution across the
426 MTA New York City Transit subway stations.
Long Island Rail Road Manhattan Terminals
The station values previously carried for the Long Island Rail Road predate the opening of
Grand Central Madison, with the result that all Manhattan-bound ridership was assigned to
Penn Station. The two terminals are now resolved separately.
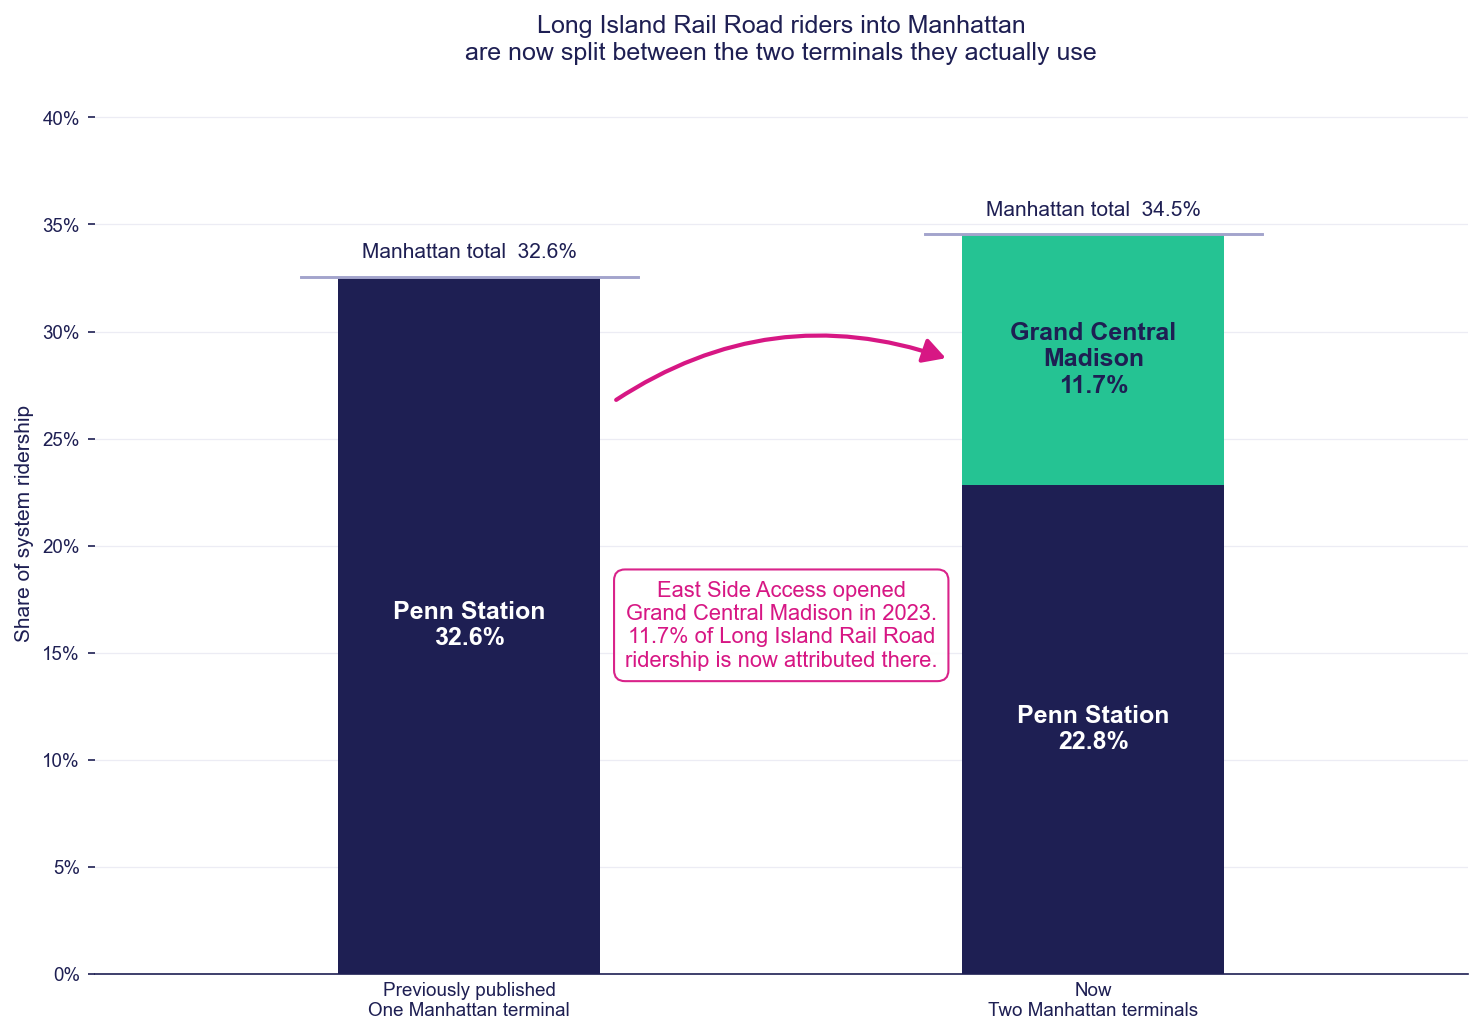
Penn Station now carries 22.8% of Long Island Rail Road system ridership and Grand Central
Madison 11.7%, against 32.6% previously assigned to Penn Station alone. The combined
Manhattan share is 34.5%.
The reduction in the Penn Station figure does not represent a decline in ridership at that
station. The proportion of Long Island Rail Road ridership arriving in Manhattan is
substantially unchanged; the terminal at which riders arrive is now identified, and activity
at Grand Central Madison is attributed to that location.
Ridership Basis
All station-level figures are expressed on a consistent station-activity basis, defined as
the proportion of a system's boardings occurring at a given station.
A limited number of previously published station values were derived on a different basis
and have been restated. The most significant is Grand Central Terminal on Metro-North, which
was previously carried at 75.2% of system ridership on a survey basis that recorded a rider
at every station used during a journey. On a station-activity basis, the corresponding
figure is 36.7% on average. Several additional Metro-North and Long Island Rail Road
stations are revised by comparable proportions for the same reason.
Quality Assurance
Every station-level series in this release is subject to an automated validation suite prior
to publication. The suite evaluates the completeness of each station set, the internal
consistency of each system's station distribution, agreement between newly derived and
previously published figures, and reconciliation of each system's total against the National
Transit Database where the system reports to it. A failing check halts publication rather
than permitting release of a partial update.
Expected Impact
Station-level estimates for the systems identified above are revised in this release.
For systems on operator-anchored shares, system and agency totals are unchanged. The total
continues to be sourced from the National Transit Database; what is revised is the
apportionment of that total across stations, which now corresponds more closely to operator
reporting.
For the three new direct operator feeds, the agency total is itself revised, as the agency
total for these systems is now the operator's reported figure rather than the NTD figure.
Basis Changes Within a Series
Historical months are restated wherever operator data extends to cover them. Where operator
data does not extend that far, the series changes basis at the date on which the operator's
data begins, and a station's value may step at that boundary:
- Metra - months prior to July 2025 use the operator's Fall 2018 station census; July
2025 onward uses the operator's monthly counts. At that boundary the median station is
revised by approximately 16%, with the largest station revisions approaching 40%. - MTA Long Island Rail Road and MTA Metro-North Railroad - months prior to September
2023 use the previously published distribution, which for a limited number of stations was
derived on the earlier survey basis described under Ridership Basis.
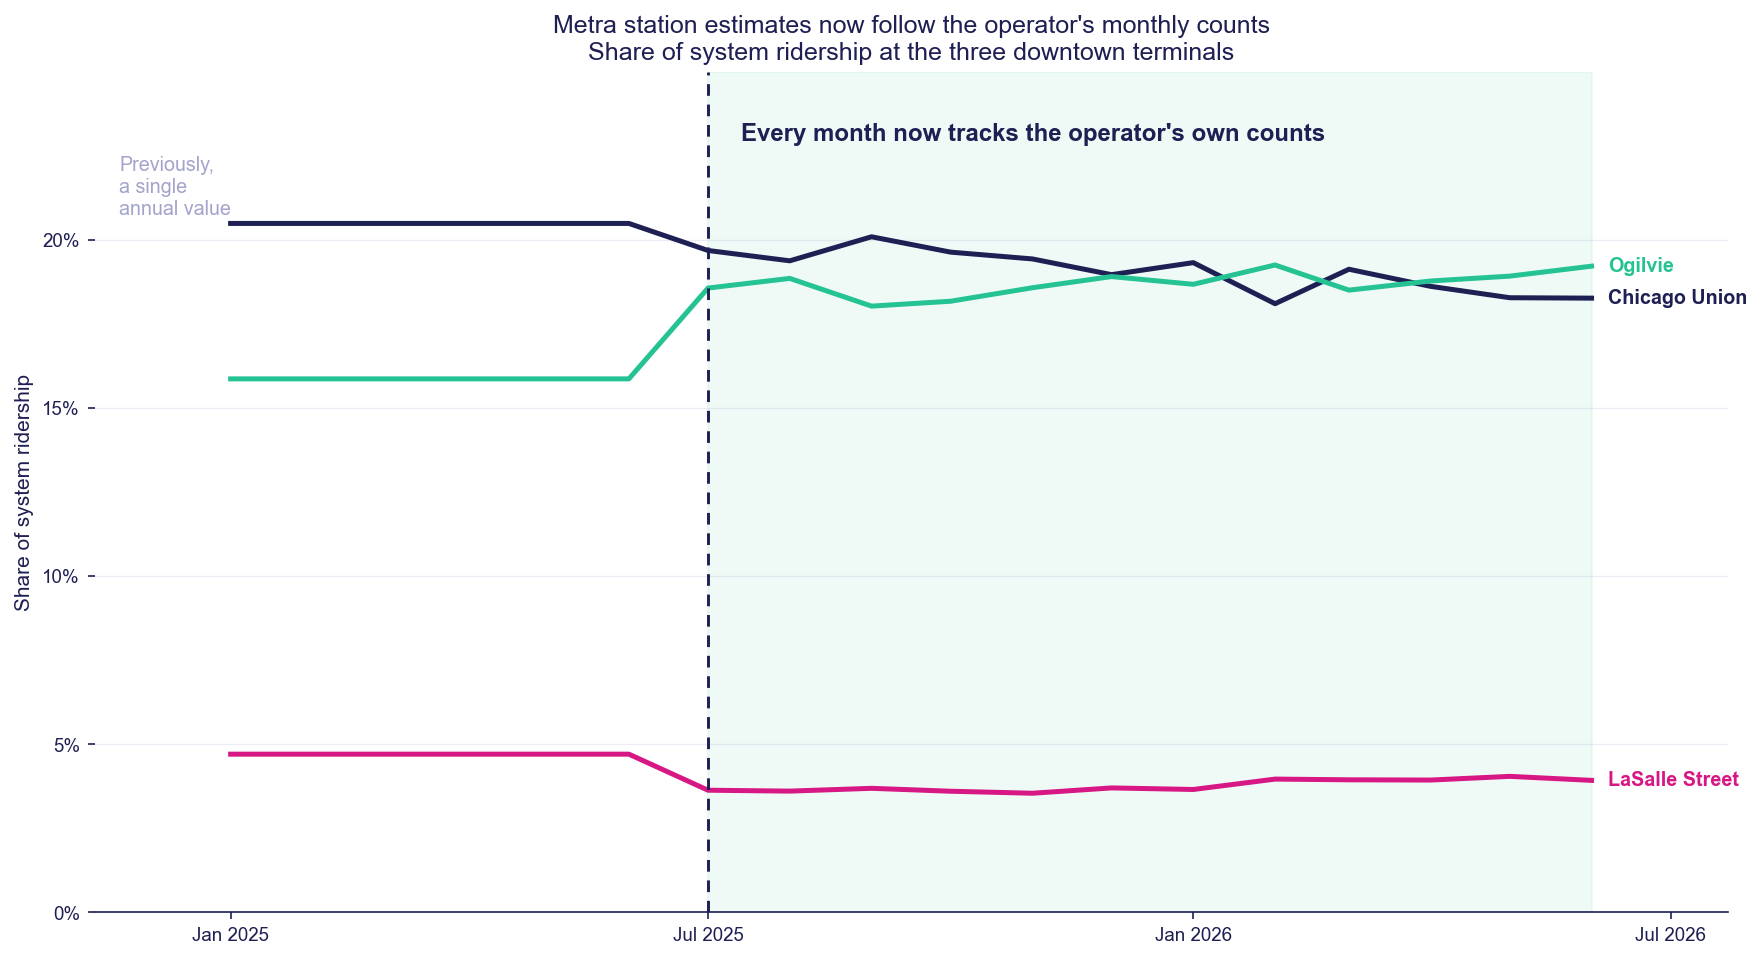
Within the covered period for each system, the series is maintained on a single consistent
basis.
Release Summary
- Release Identifier: 20260807
- Total Place Coverage: 2,667,414 places
- Newly Added Places: 90,057 places
- Data Processing Date: 2026-08-16
This incremental release maintains Motionworks' commitment to providing comprehensive, up-to-date location intelligence while continuously expanding place coverage across diverse venue categories.
This changelog was generated through automated data processing and quality assurance workflows.