
Motionworks Placecast™ Quick Serve Restaurants Report
Motionworks Placecast™ products provides for Places and Regions since 2019.
Quick Serve Restaurants
Motionworks Placecast™ provides visits and occupancy at Motionworks Places and Regions since 2019. These insights are produced with the Motionworks Population Intelligence Platform. Placecast™ is used for investigating visitation trends at locations through time.
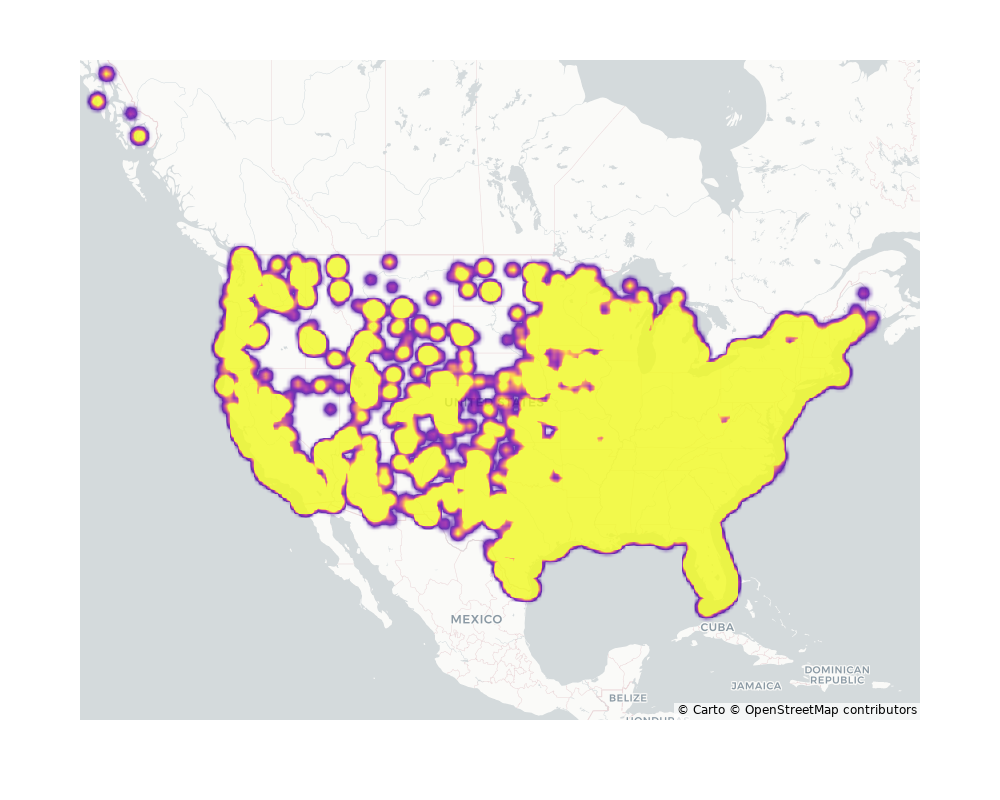
The following document provides an overview of the validation of Motionworks Quick Serve Restaurants. Motionworks measures visitation at 194,503 quick serve restaurants. Places can be standalone or within a larger building or a complex. Out of the total number, 193,394 are standalone locations where they can be directly measured. Figure below indicates the distribution of all Motionworks Quick Serve Restaurants across the United States.
| Median Visits per Week 2019 | Median Visits per Week Current Year | Median Visits per Week Overall | Median Dwell Time 2019 | Median Dwell Time Current Year | Median Dwell Time Overall | |
|---|---|---|---|---|---|---|
| V2.0 | 1,680 | 2,100 | 2,220 | 0 | 0 | 0 |
| V2.1 | 1,700 | 2,160 | 2,280 | 45 | 40 | 43 |
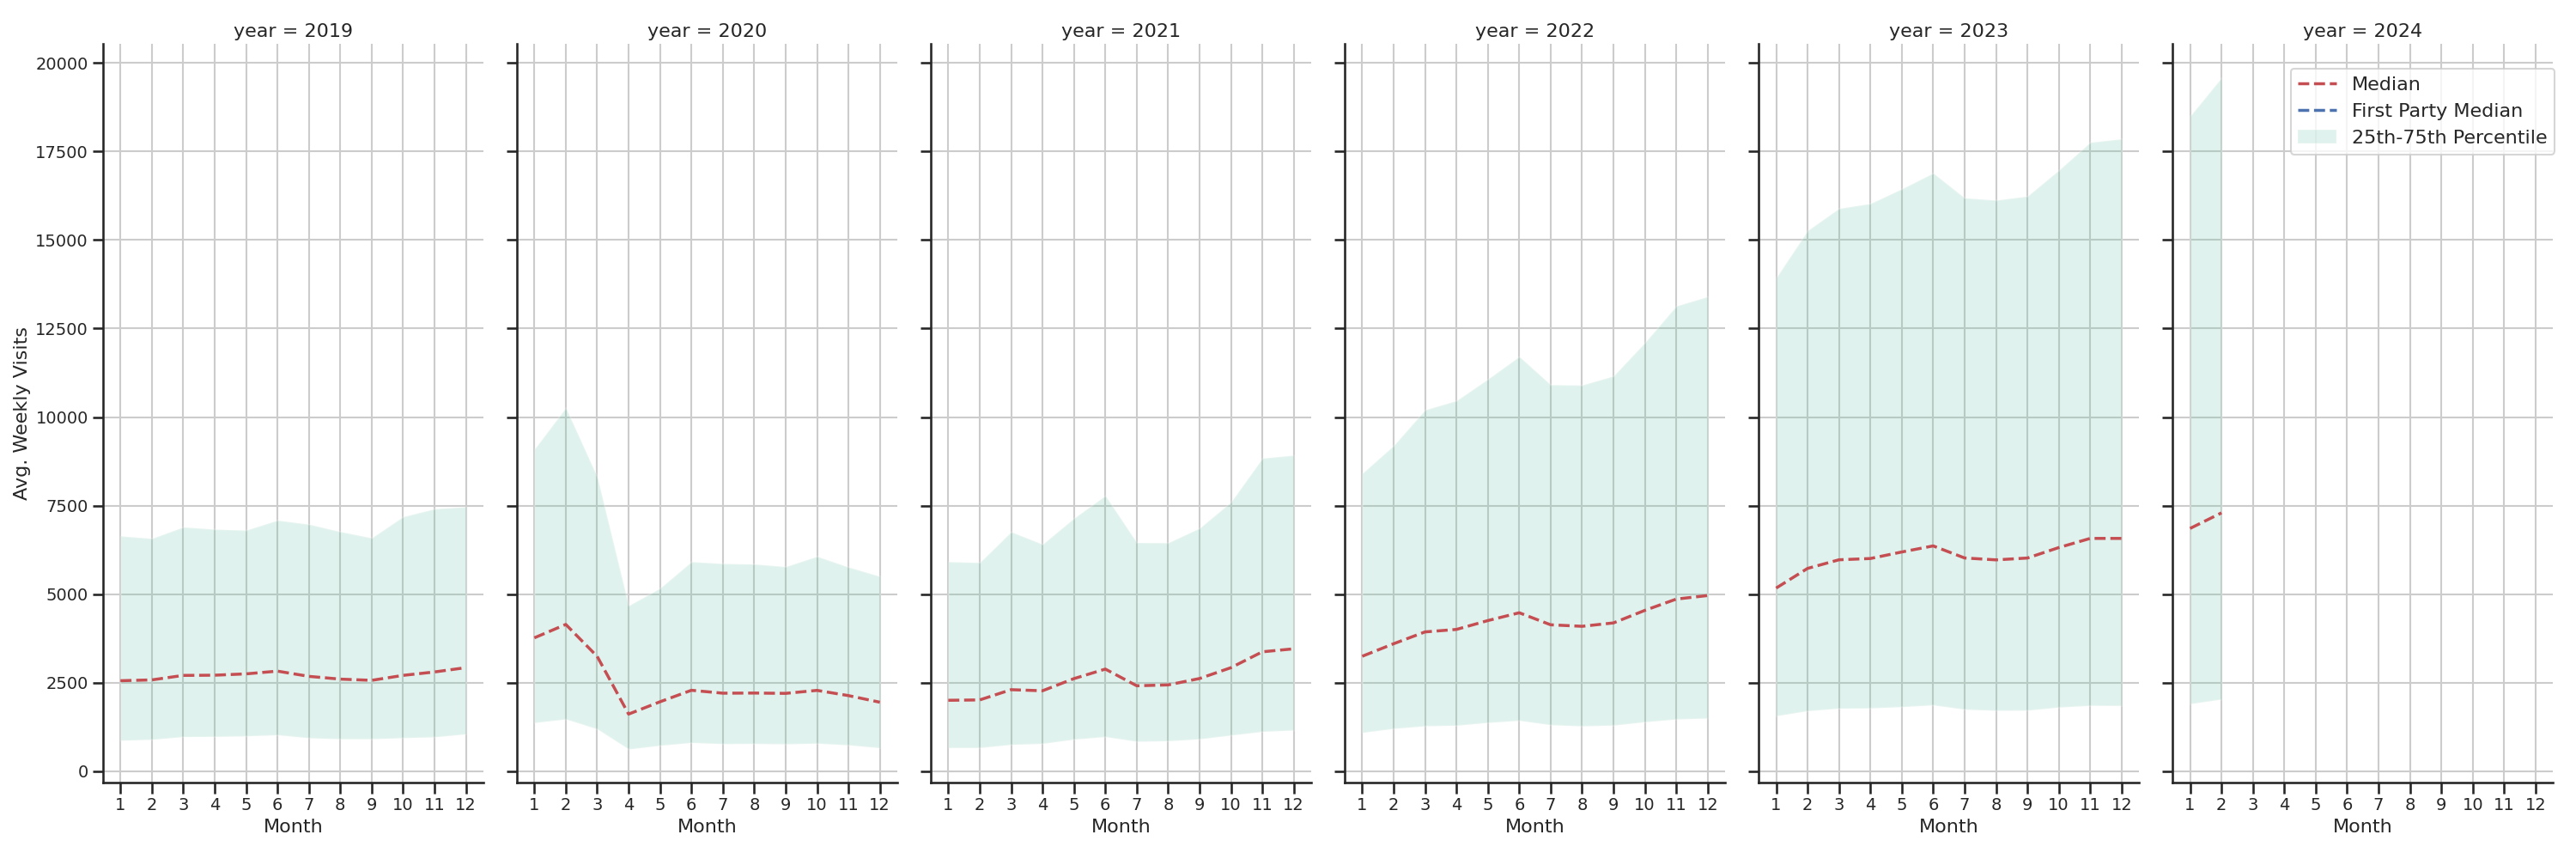
Weekly Visit Trends
Figure below shows the trend of weekly visits - median (red) as well as 25th to 75th percentile band (green) - over time across all quick serve restaurants. This is then compared to the median weekly first-party counts (blue). Note that the median weekly visits are created based on 195,001 of places, whereas the median weekly first-party data are calculated based on the visits of 0 places.
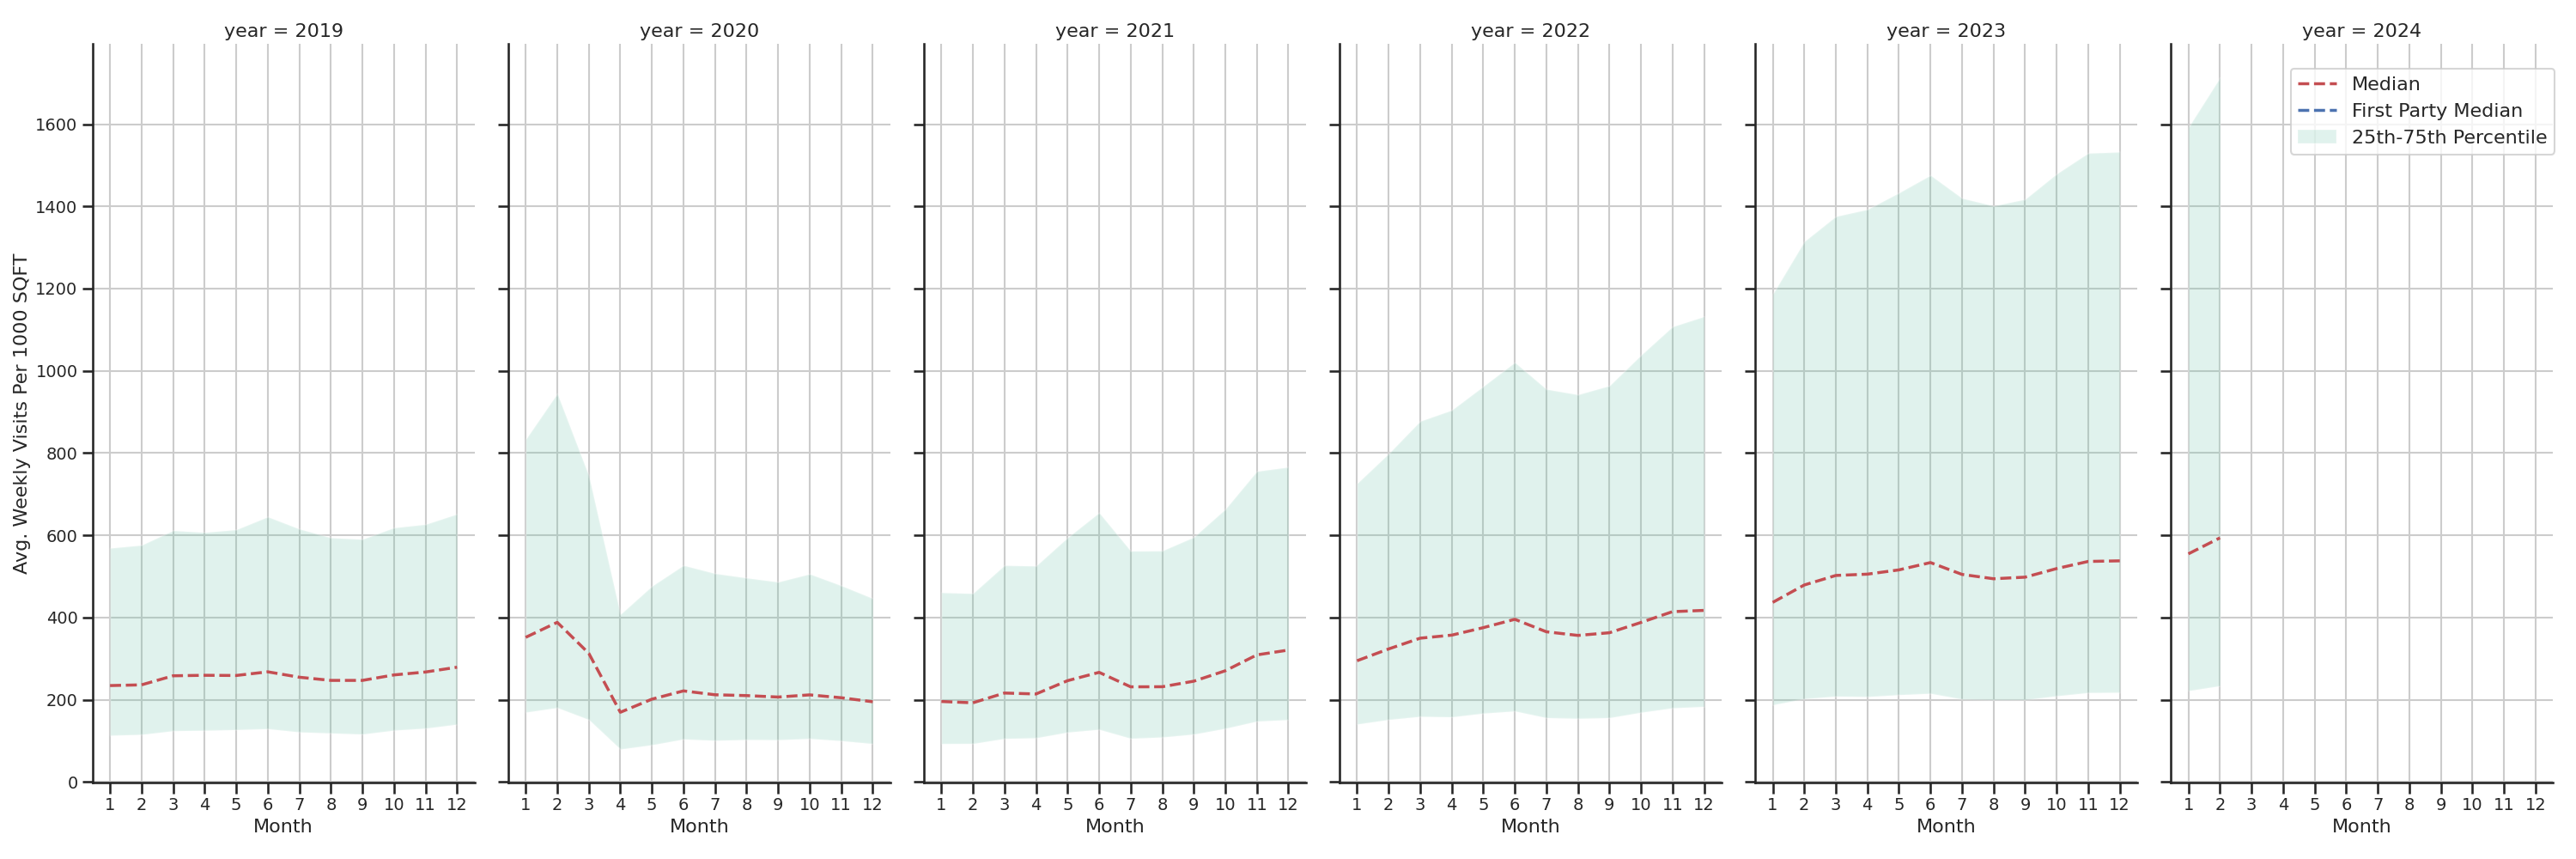
Weekly Visit Per 1K SQFT Trends (Standalone)
Figure below shows the trend of weekly visits per 1000 square feet of space (ksf) - median (red) as well as 25th to 75th percentile band (green) - over time across only standalone quick serve restaurants that can be directly measured or at least they are provided with a polygon/size. This is then compared to the median weekly first-party counts (blue). Note that the median weekly visits are created based on 193,908 of places, whereas the median weekly first-party counts are calculated based on the visits of 0 places.
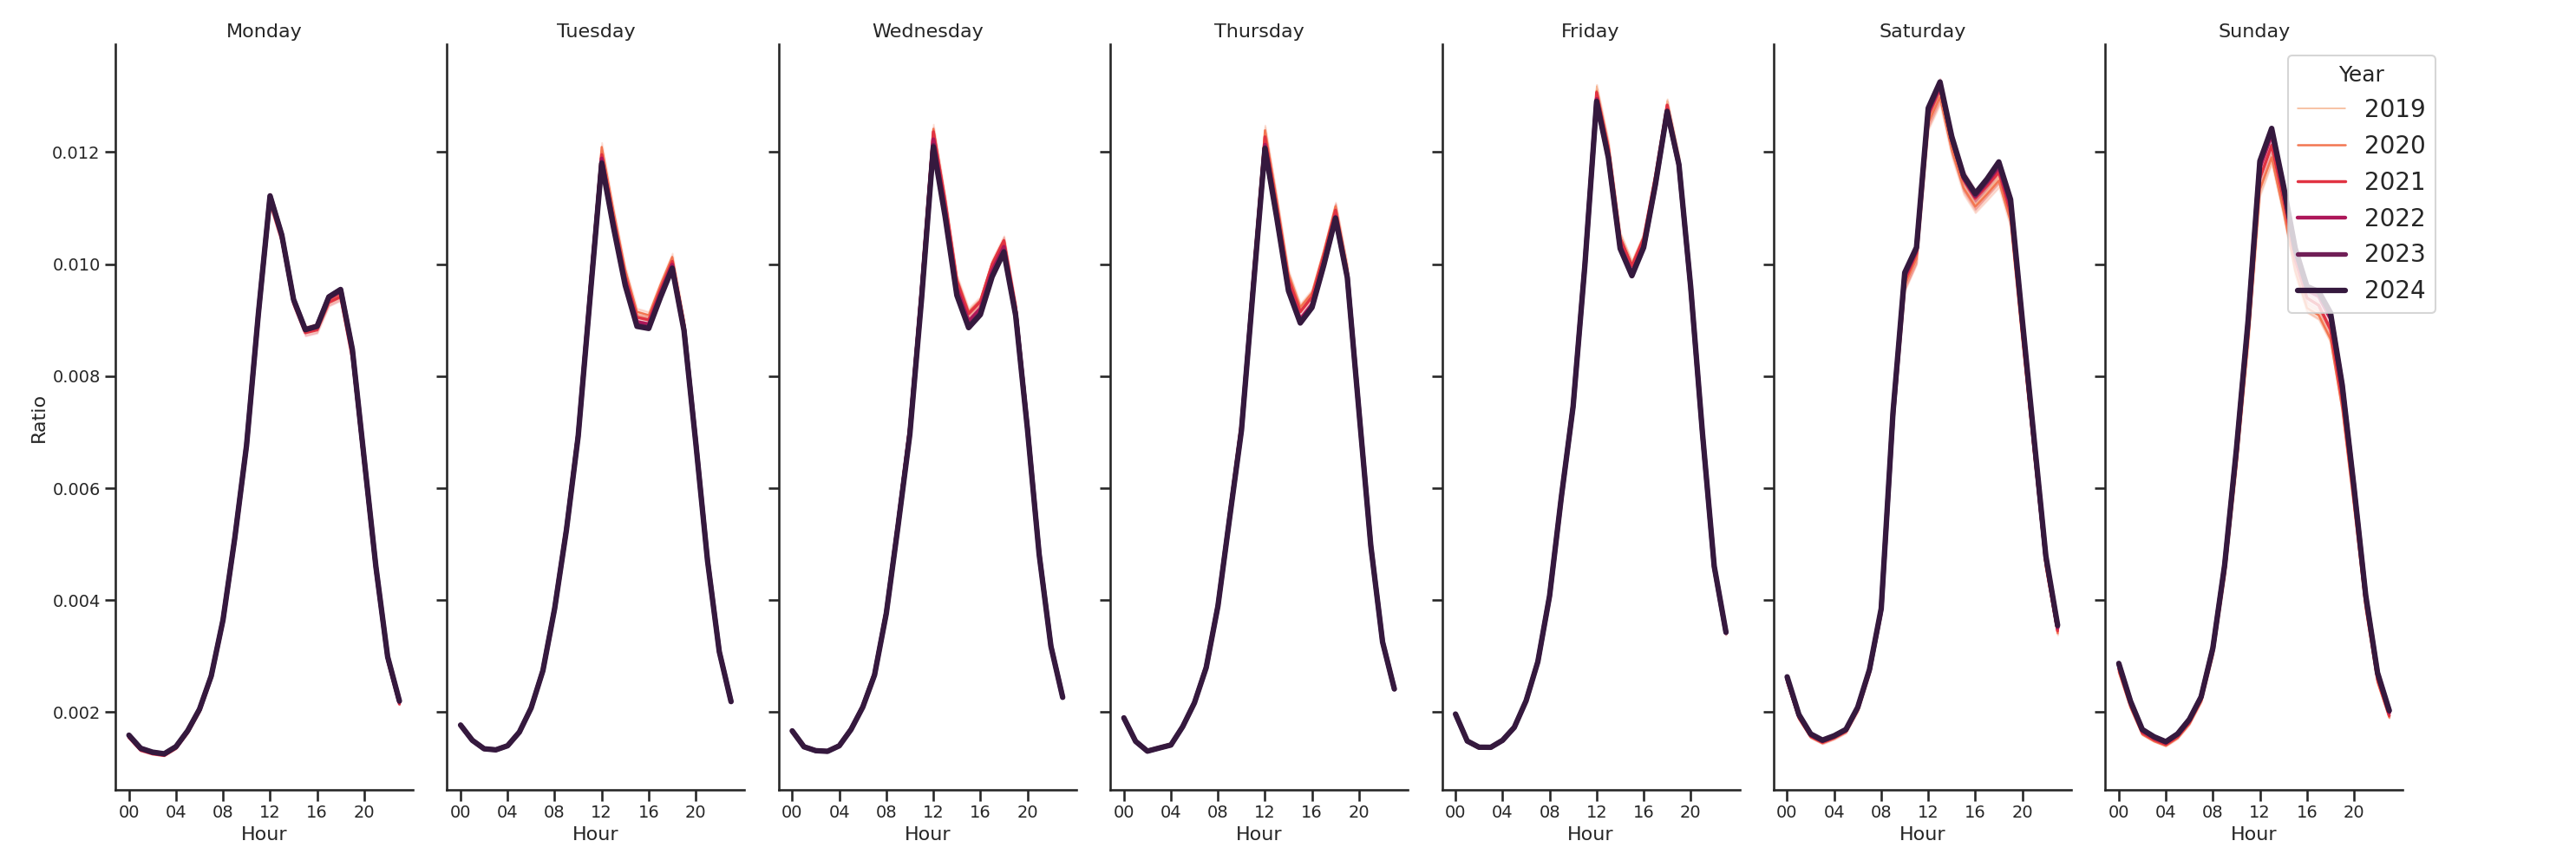
Day of Week and Hour of the Day Profiles
Figure below shows the average proportion of the weekly visits that fall within a specific hour of a specific day of the week. Color represents the year, and each band represents the variation over the months of the year.
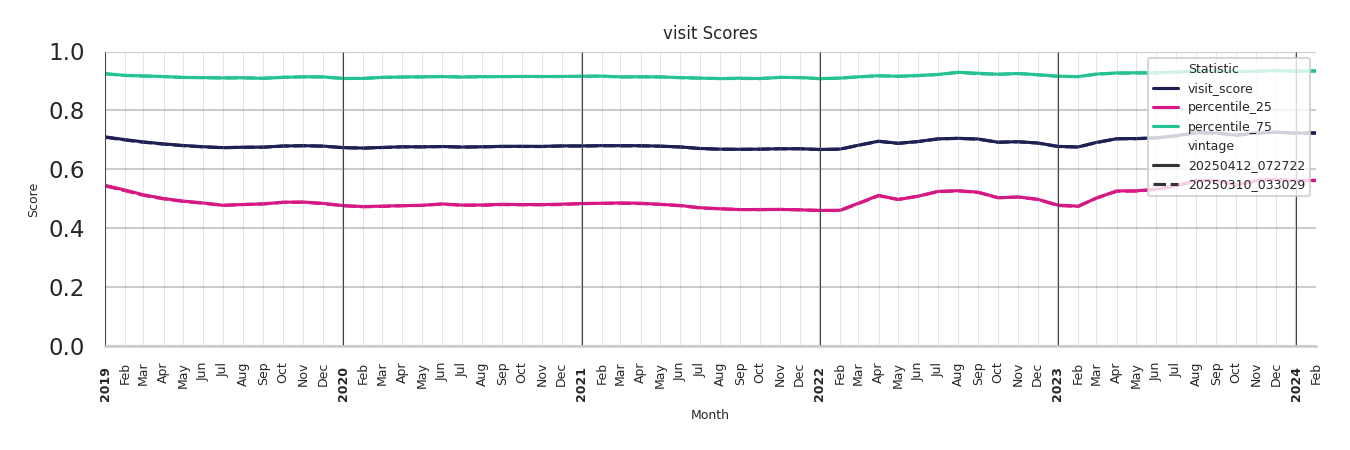
Weekly Visit Scores
Table below presents the historical average scores for Quick Serve Restaurants. Note that 1 is the perfect score. Scores are calculated based on how well they compare with their cohorts of places, and how far off their observed (1) visitation, (2) dwell, (3) hourly profile, and (4) footprint is from our best estimation based on their location, size, urbanicity, and the type of the place. Please refer to the scoring document for more details.
Note that, if a place's direct measurements are scored below a certain threshold. The place is then considered as unfocused and therefore passed through the unfocused methodology and their stats are estimated based on the location, size, and the type of the place using insights from other focused places in the vicinity. Please refer to unfocused methodology document for more details.
| Average Dwell Score | Average Footprint Score | Average Profile Score | Average Visit Score |
|---|---|---|---|
| 0.71 | 0.67 | 0.88 | 0.69 |
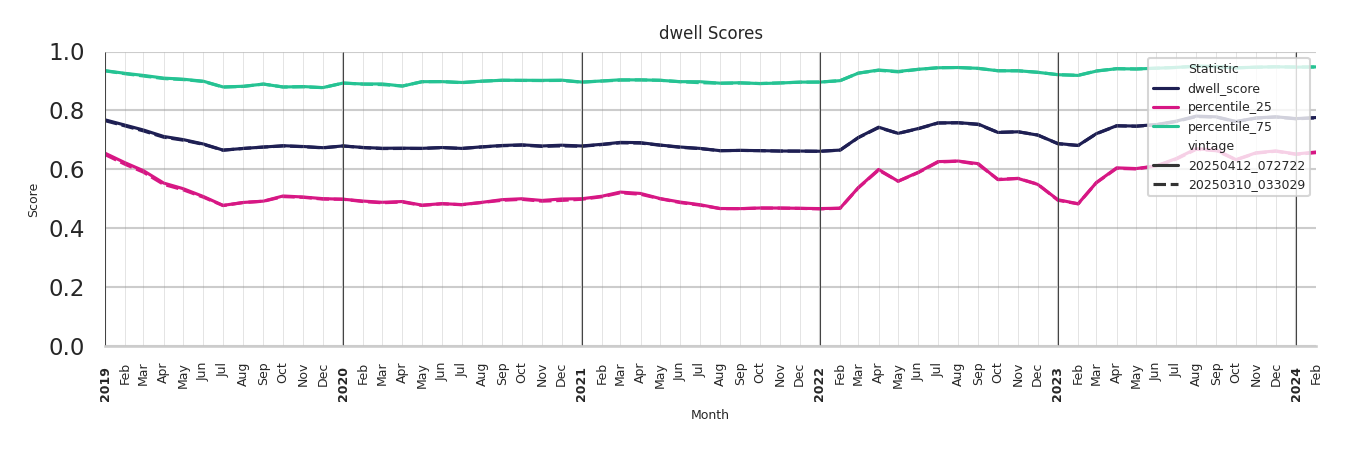
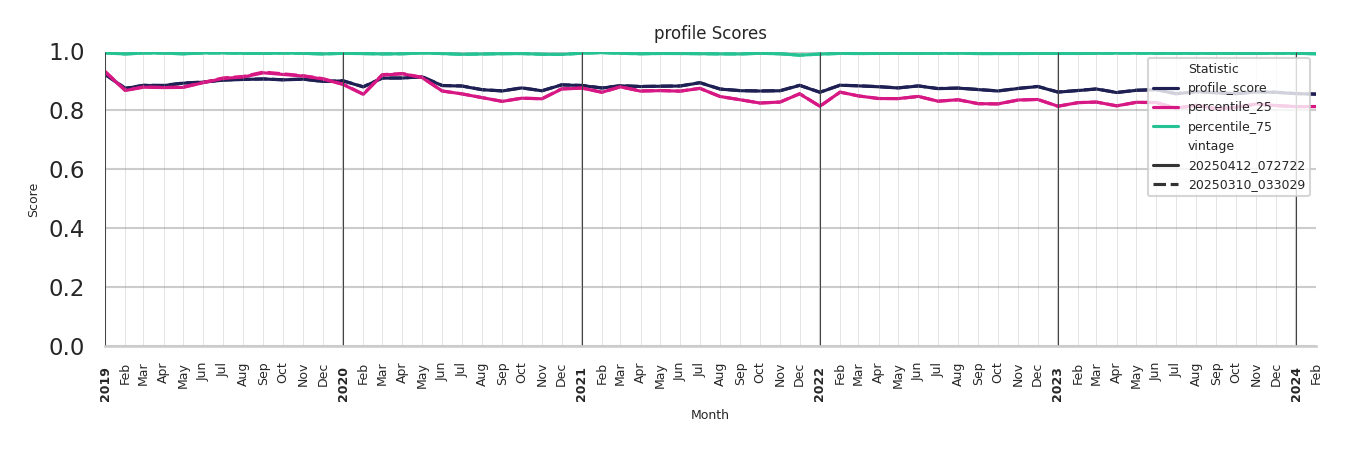
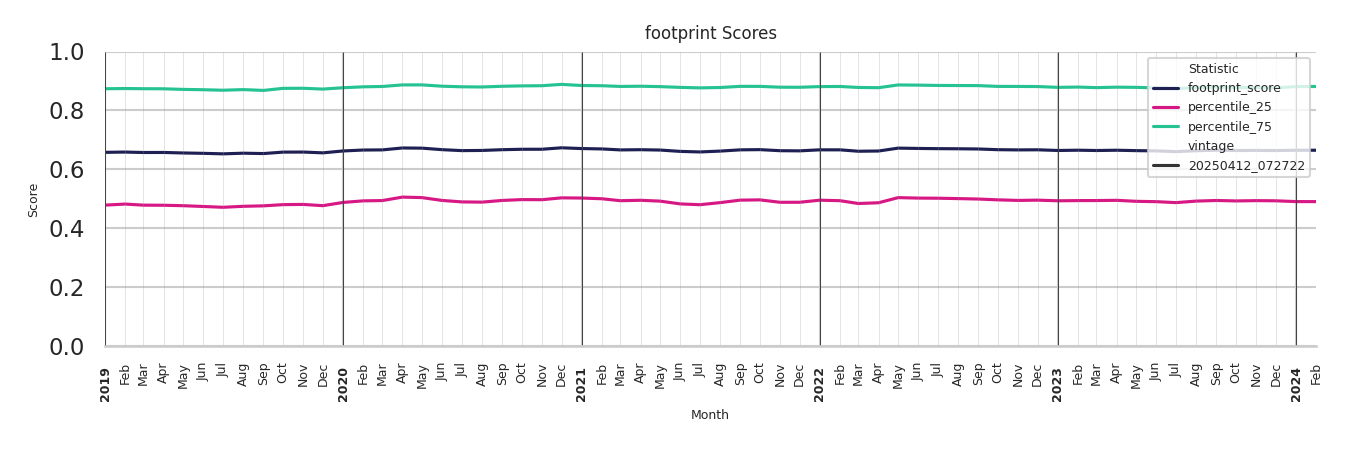
Figures below shows the average and 25th/75th percentiles of the score across all of the Quick Serve Restaurants for every month since January 2019. The dashed line shows the previous delivery statistics, whereas, the solid line is the current delivery.
Visit Score Graph
Dwell Score Graph
Profile Score Graph
Footprint Score Graph
Updated 5 months ago