
Motionworks Placecast™ Transit Hubs Report
Motionworks Placecast™ products provides for Places and Regions since 2019.
Transit Hubs
Motionworks Placecast™ provides visits and occupancy for Motionworks Places and Regions since 2019. These insights are produced with the Motionworks Population Intelligence Platform. Placecast™ is used for investigating visitation trends at locations through time.
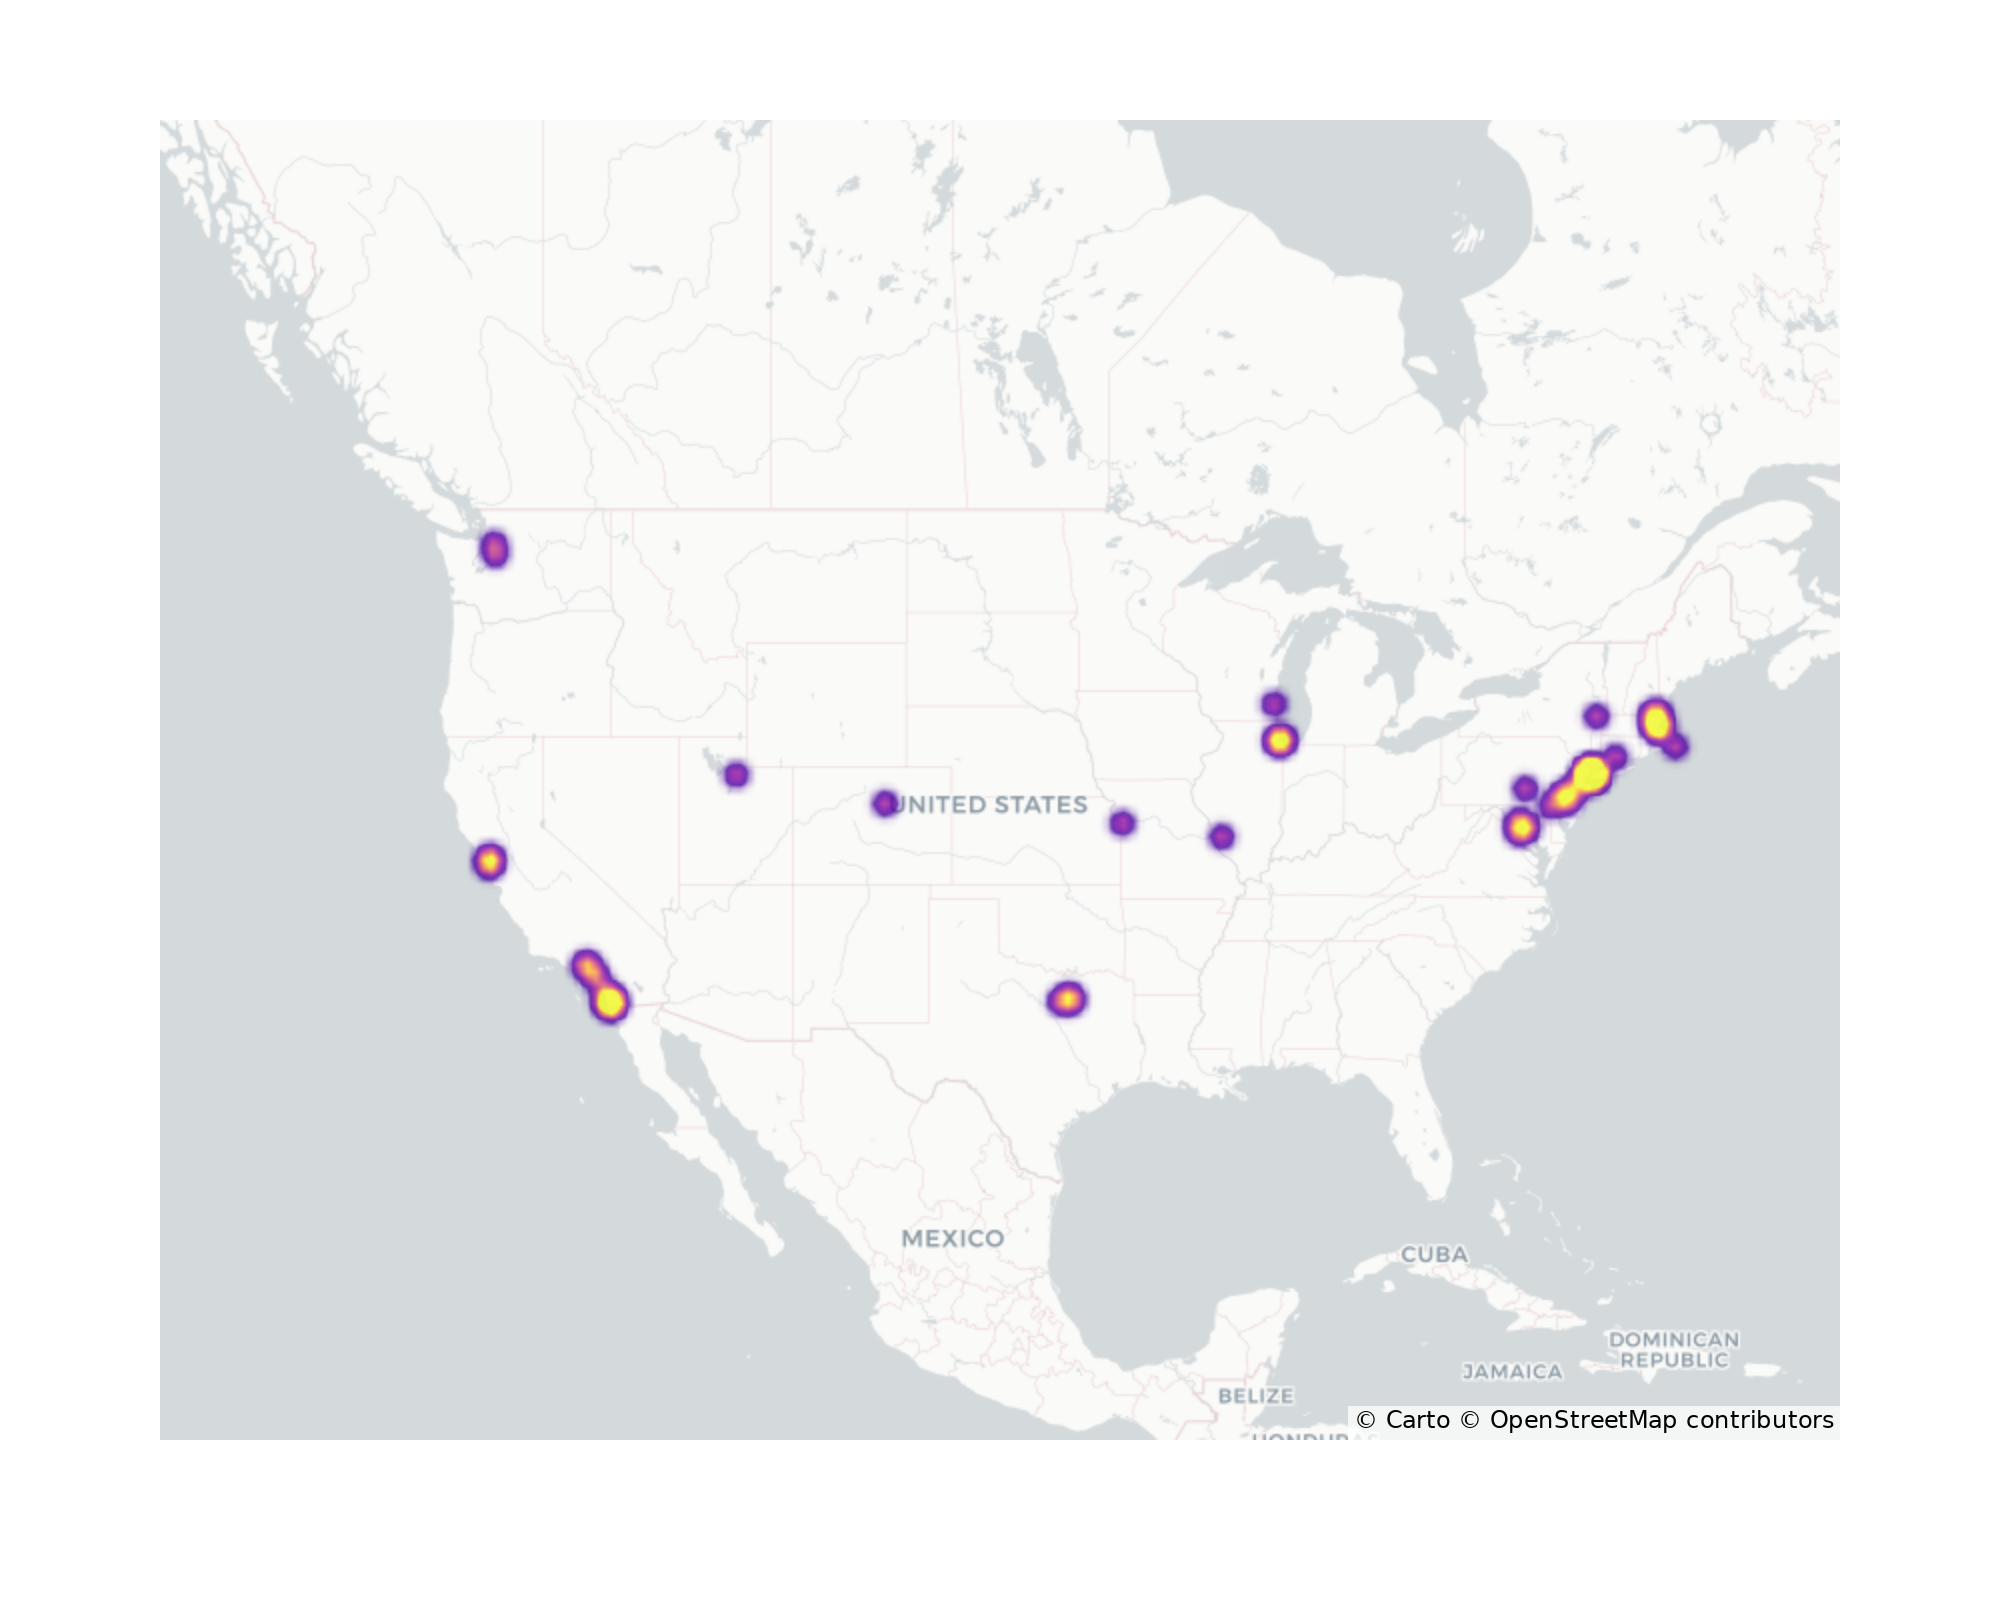
The following document provides an overview of the validation of Motionworks Transit Hubs. Motionworks currently measures visitation at 89 transit hubs. Places can be standalone or within a larger building or a complex. Out of the total number of places measured, 61 are standalone locations where they can be directly measured. The figure below indicates the distribution of all Motionworks Transit Hubs across the United States.
Place Description
A significant transit station where large numbers of riders congregate or the system orients transfers to occur. Transit Hubs are often a major terminus for one more more transit systems (e.g., Penn Station, LA Union Station) or the intersection of several routes traveling in different directions (e.g., Times Square, Embarcadero). Stations featuring a focused change of mode are included in this category. (e.g., Irvine Transportation Center, Salesforce Transportation Center)
Place Stats
| Place Type | Number of Places | Minimum Size* -sq ft- | Median Size -sq ft- | Maximum Size* -sq ft- |
|---|---|---|---|---|
| Transit Hub | 89 | 1,639 | 62,190 | 321,581 |
* Minimum and maximum size represent the 5th and 95th percentile.
| Median Visits per Week 2025 | Median Visits per Week 2024 | Median Visits per Week 2023 | Median Visits per Week 2022 | Median Dwell Time 2025 | Median Dwell Time 2024 | Median Dwell Time 2023 | Median Dwell Time 2022 | |
|---|---|---|---|---|---|---|---|---|
| V2.2 | 49,112 | 42,729 | 39,392 | 37,159 | 34 | 35 | 34 | 34 |
| V2.3 | 49,754 | 52,303 | 72,420 | 68,152 | 41 | 41 | 42 | 39 |
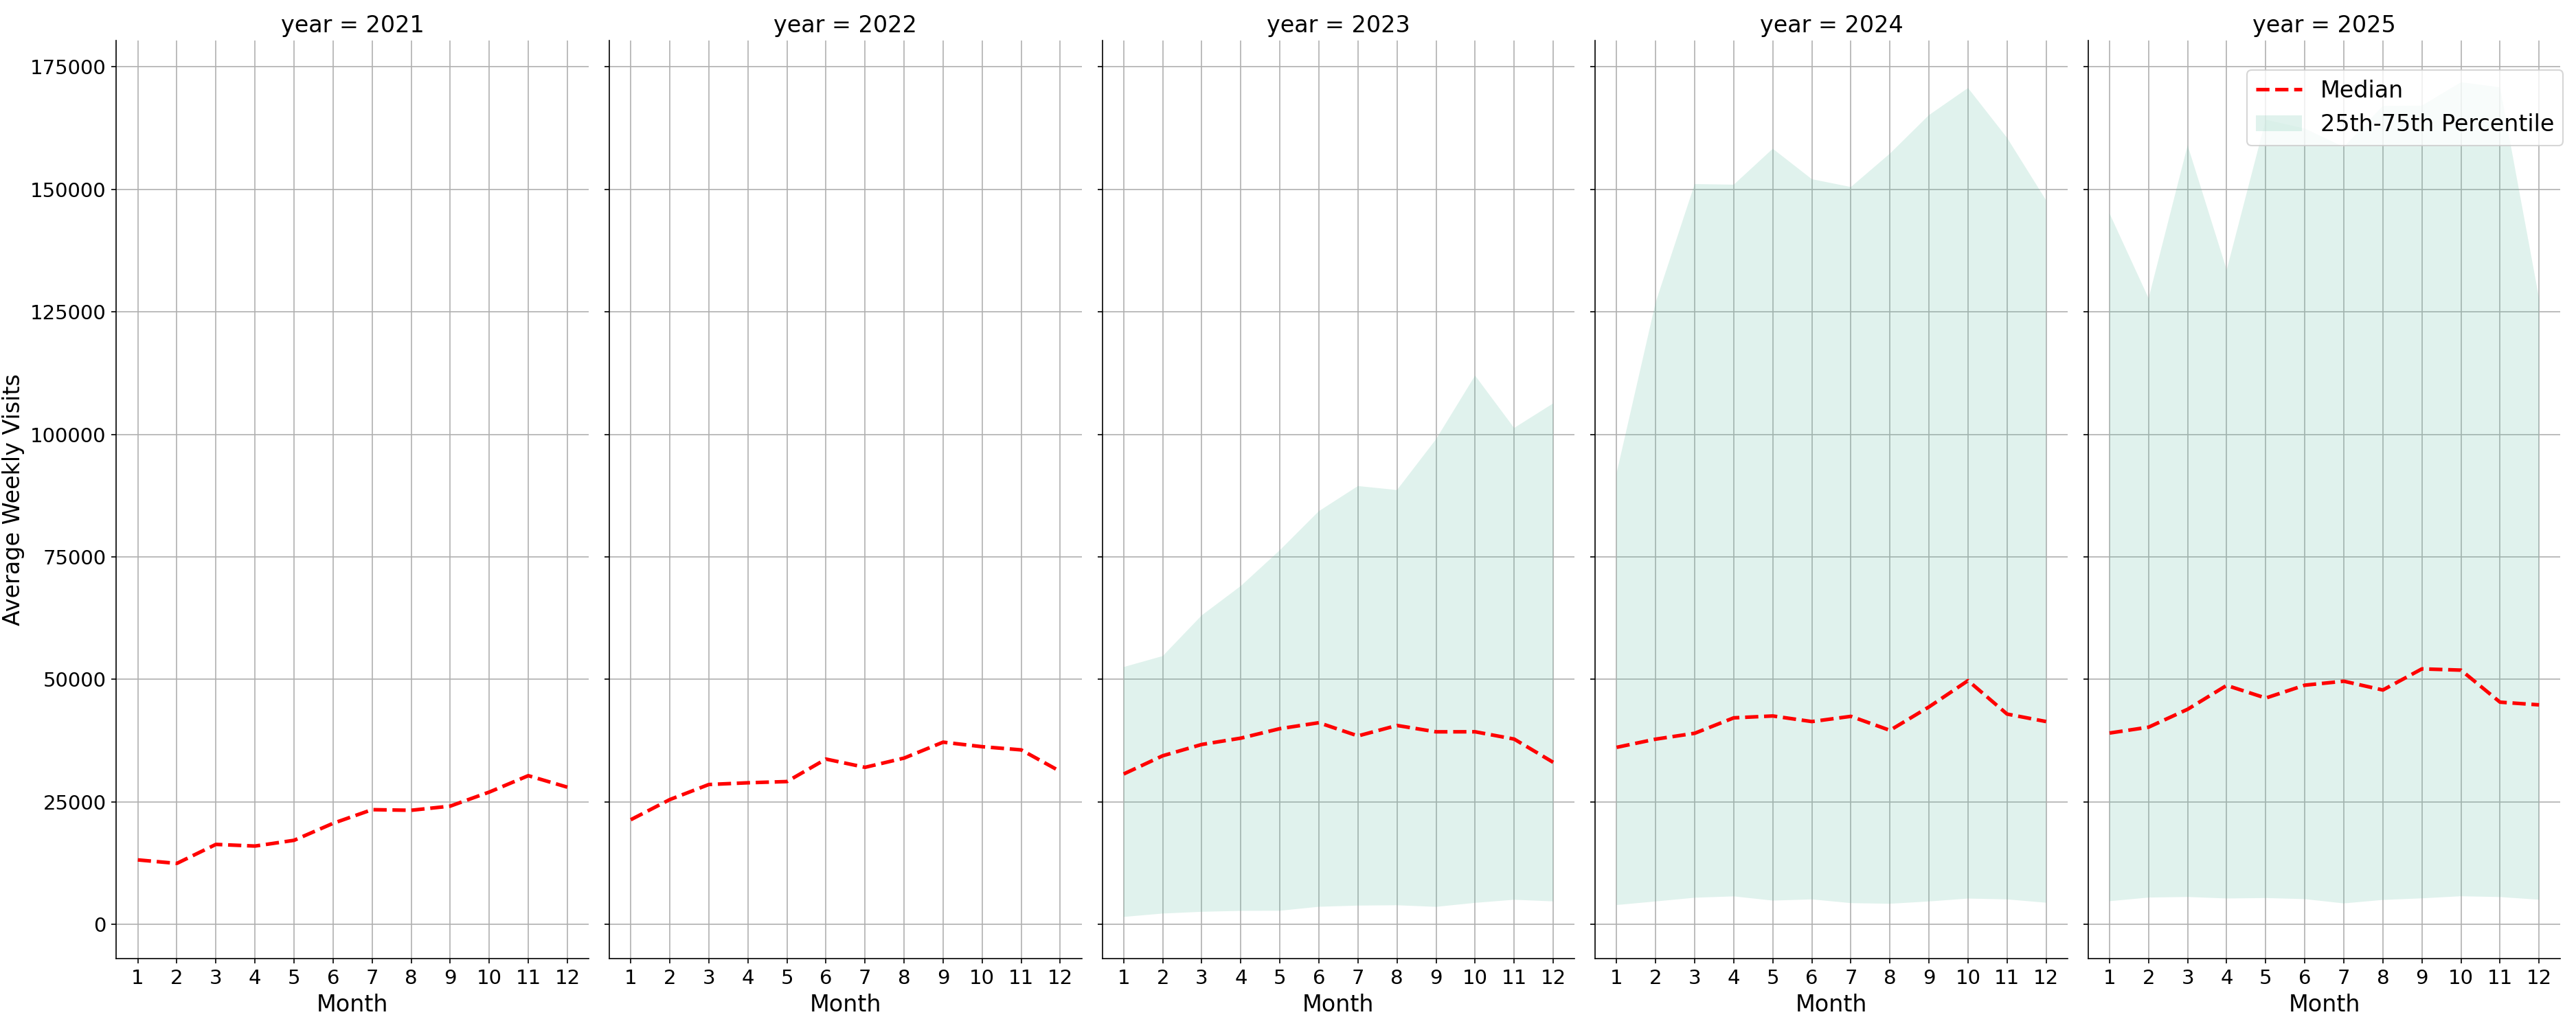
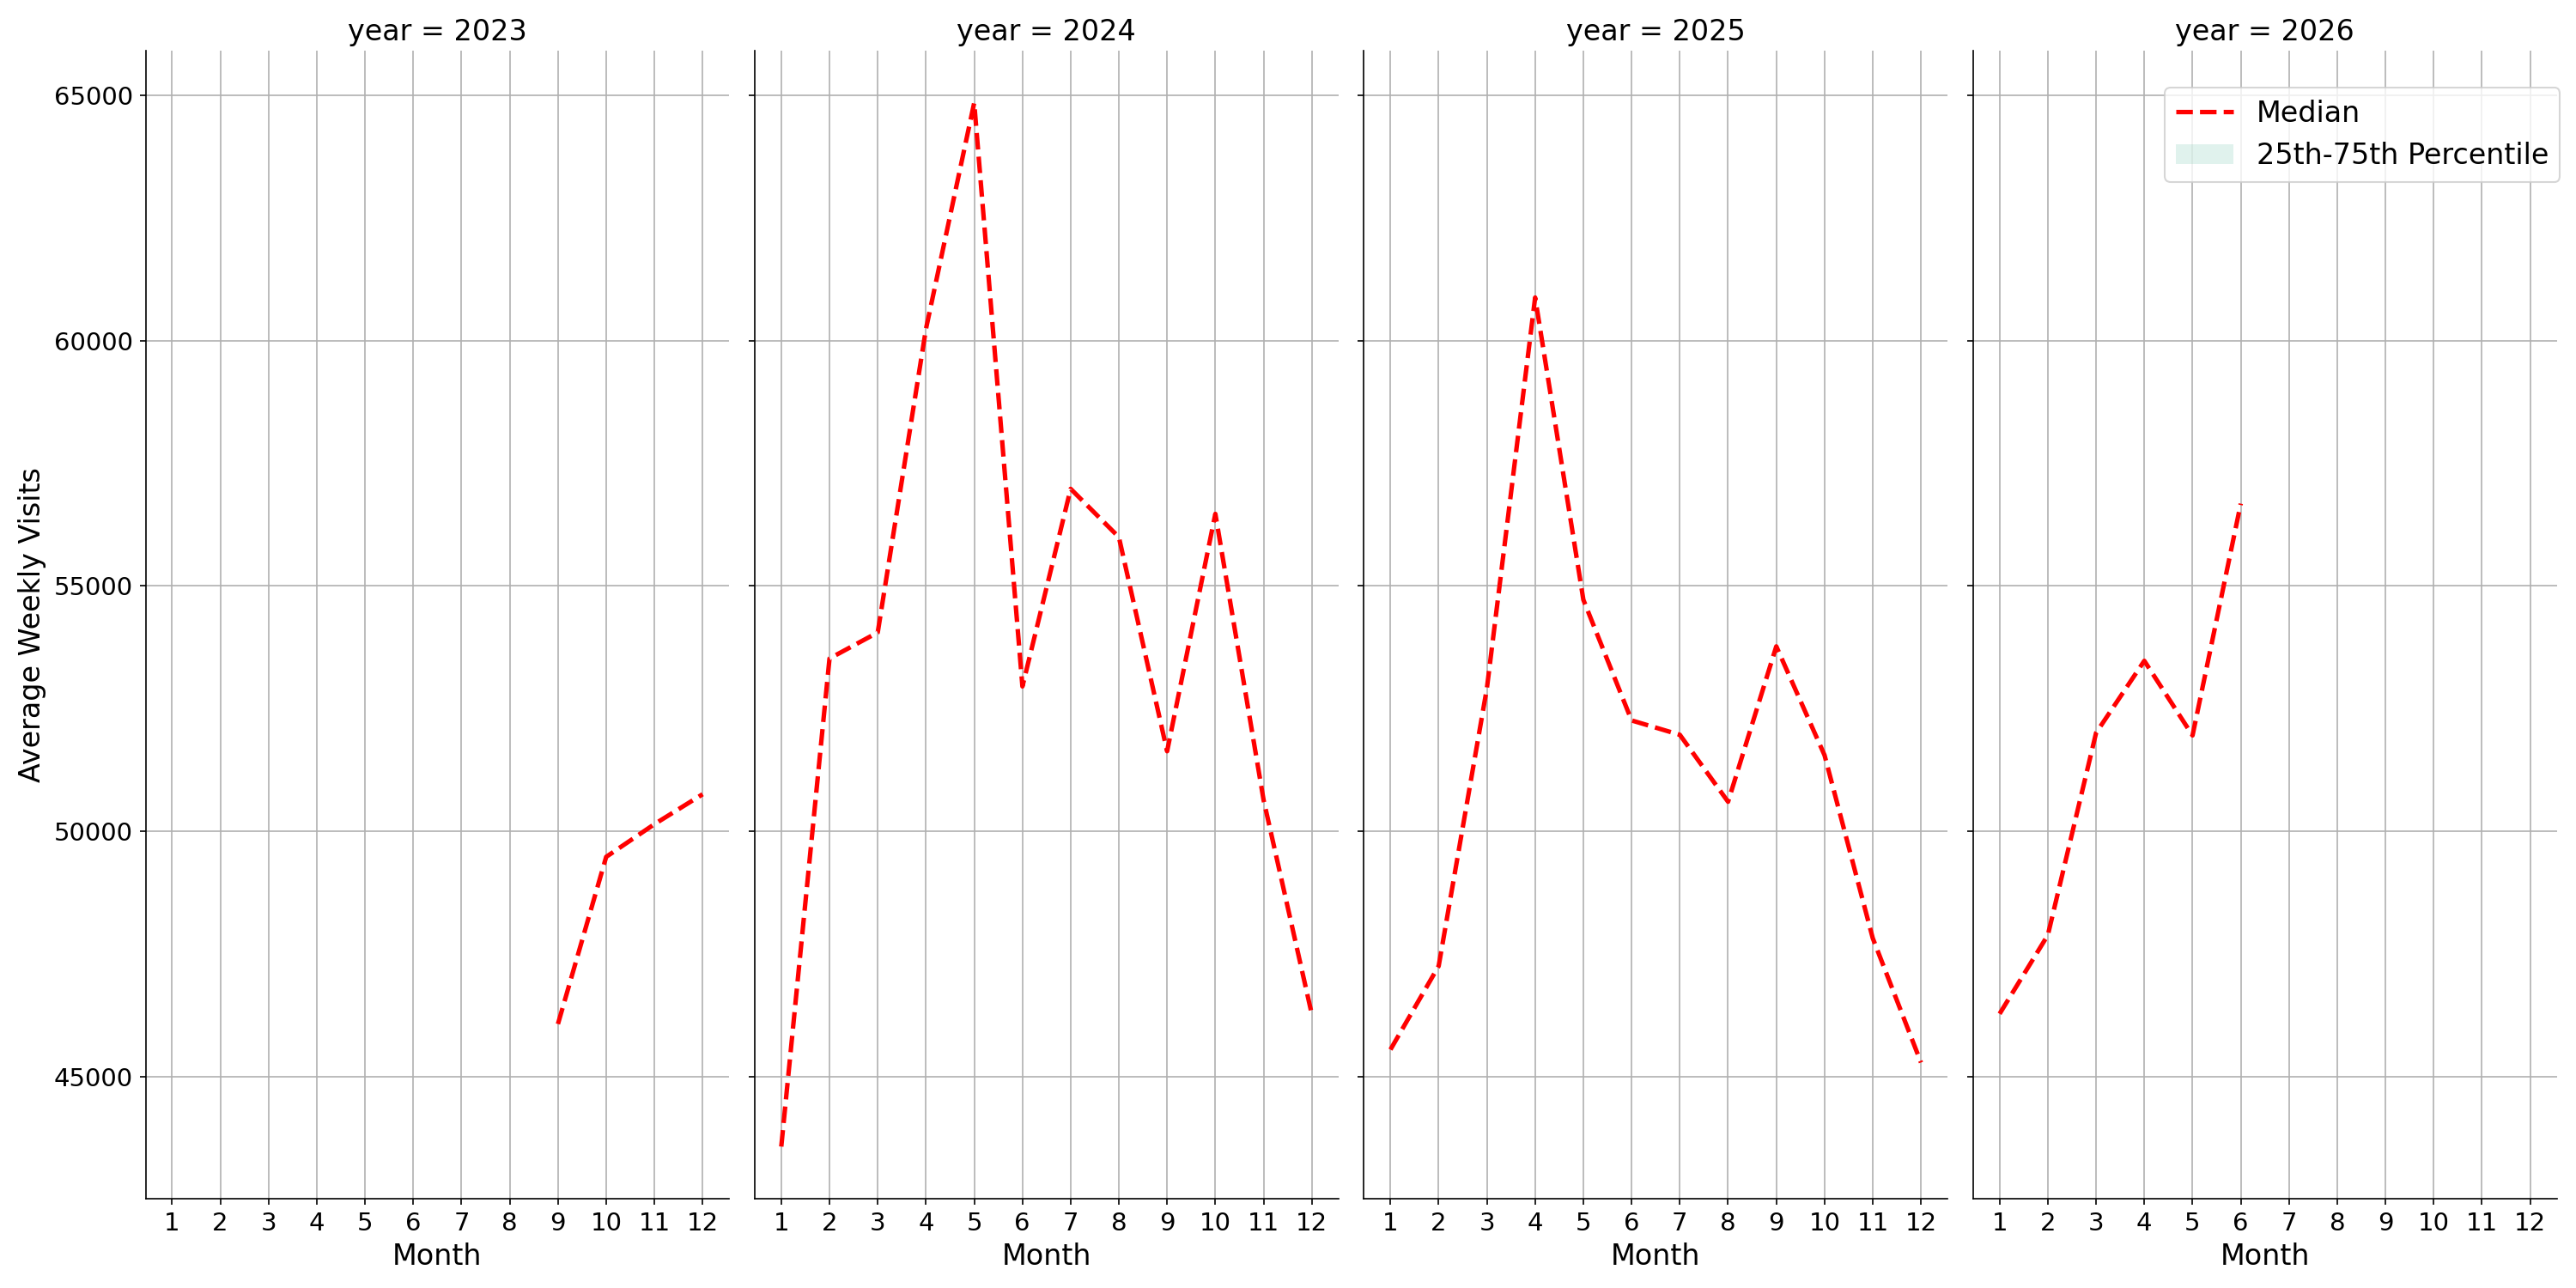
Weekly Visit Trends
The figure below shows the trend of weekly visits - median (red) as well as the 25th to 75th percentile band (green) - over time across all transit hubs.
V2.2
V2.3
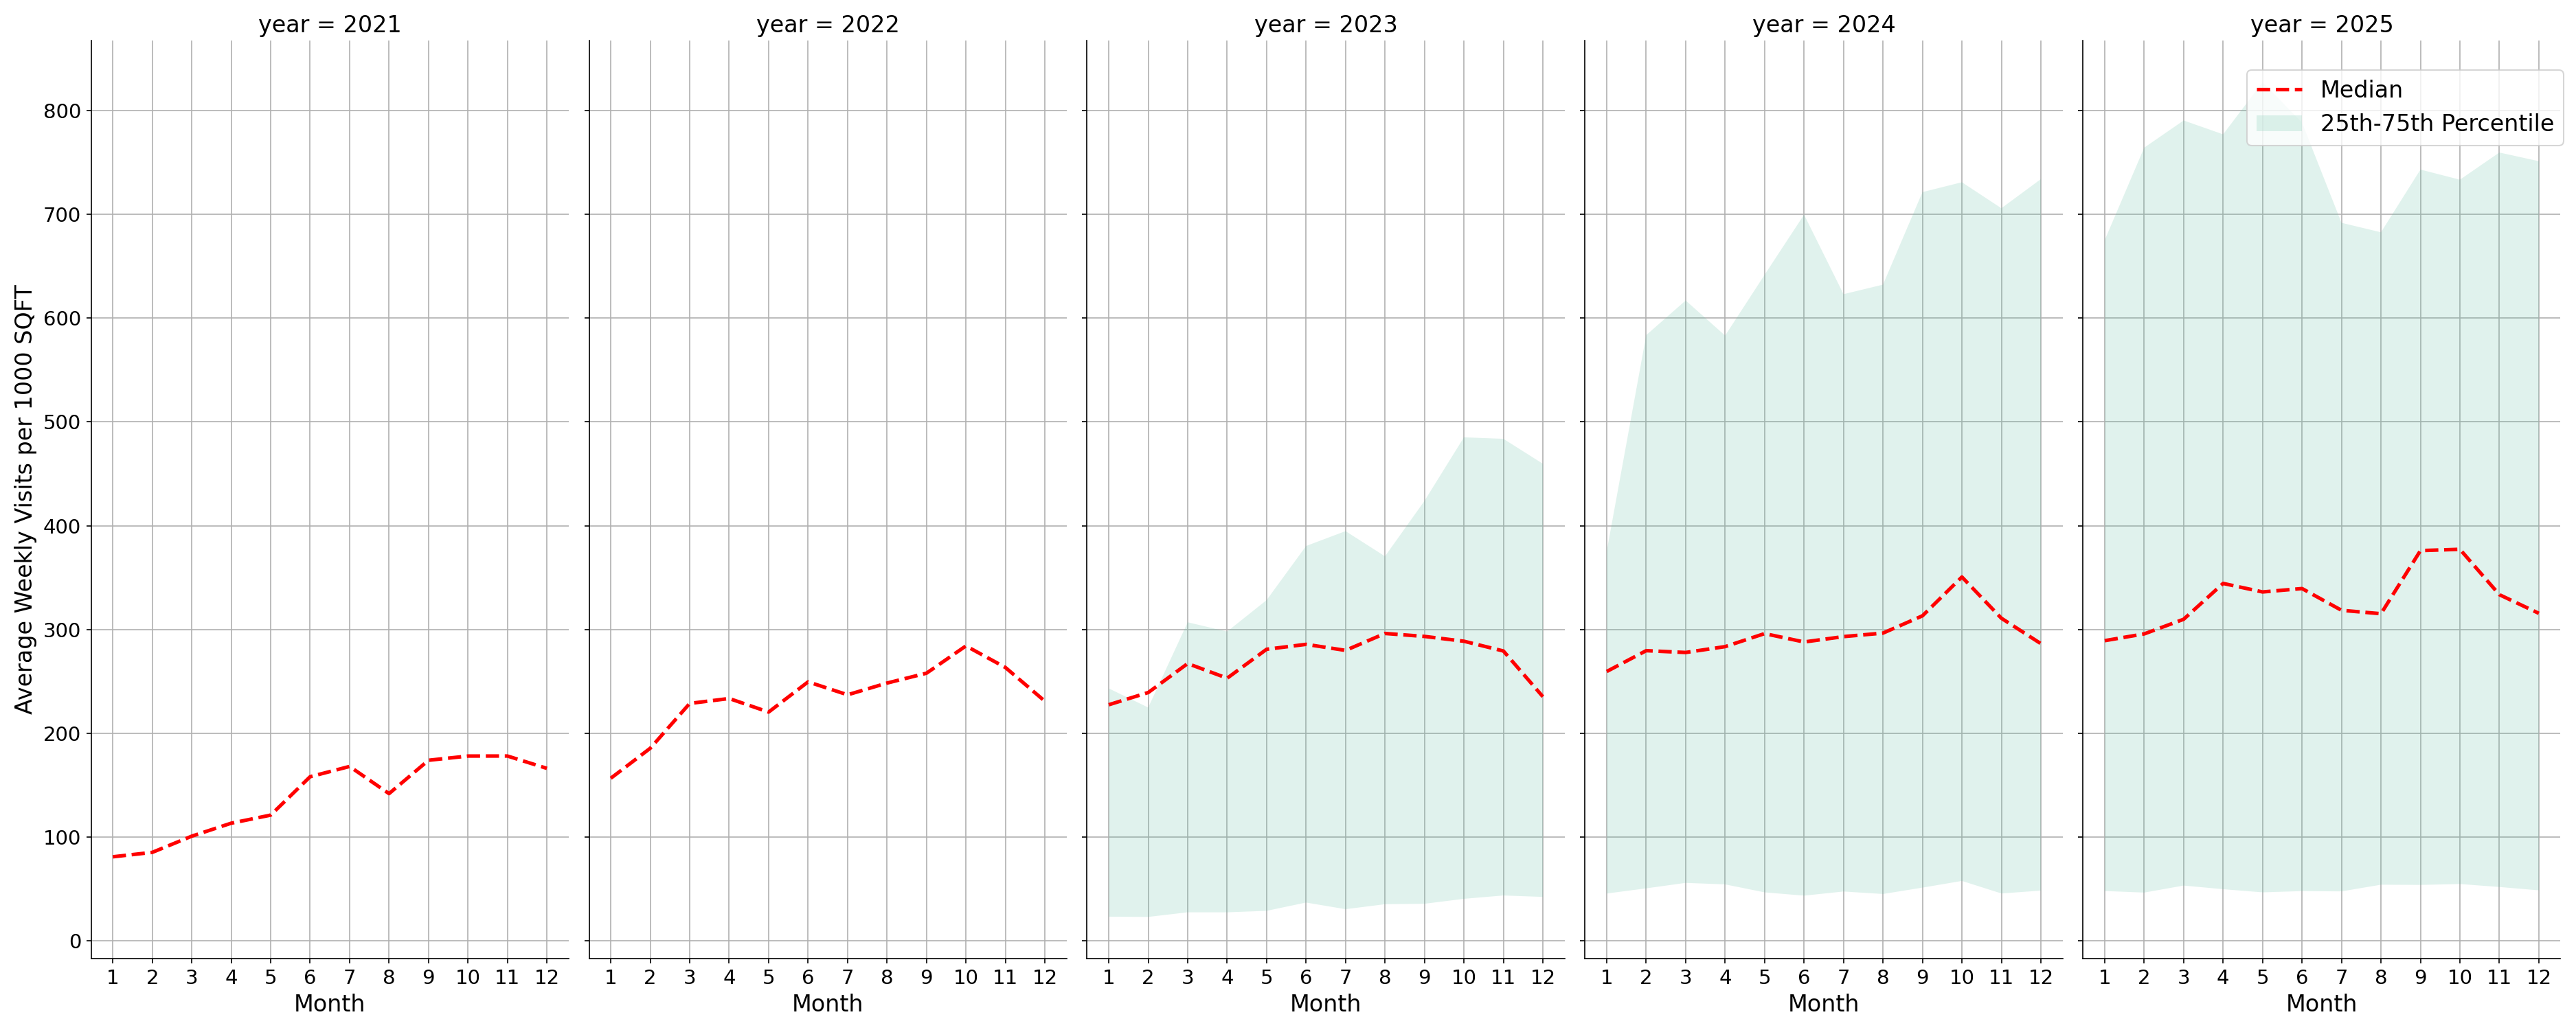
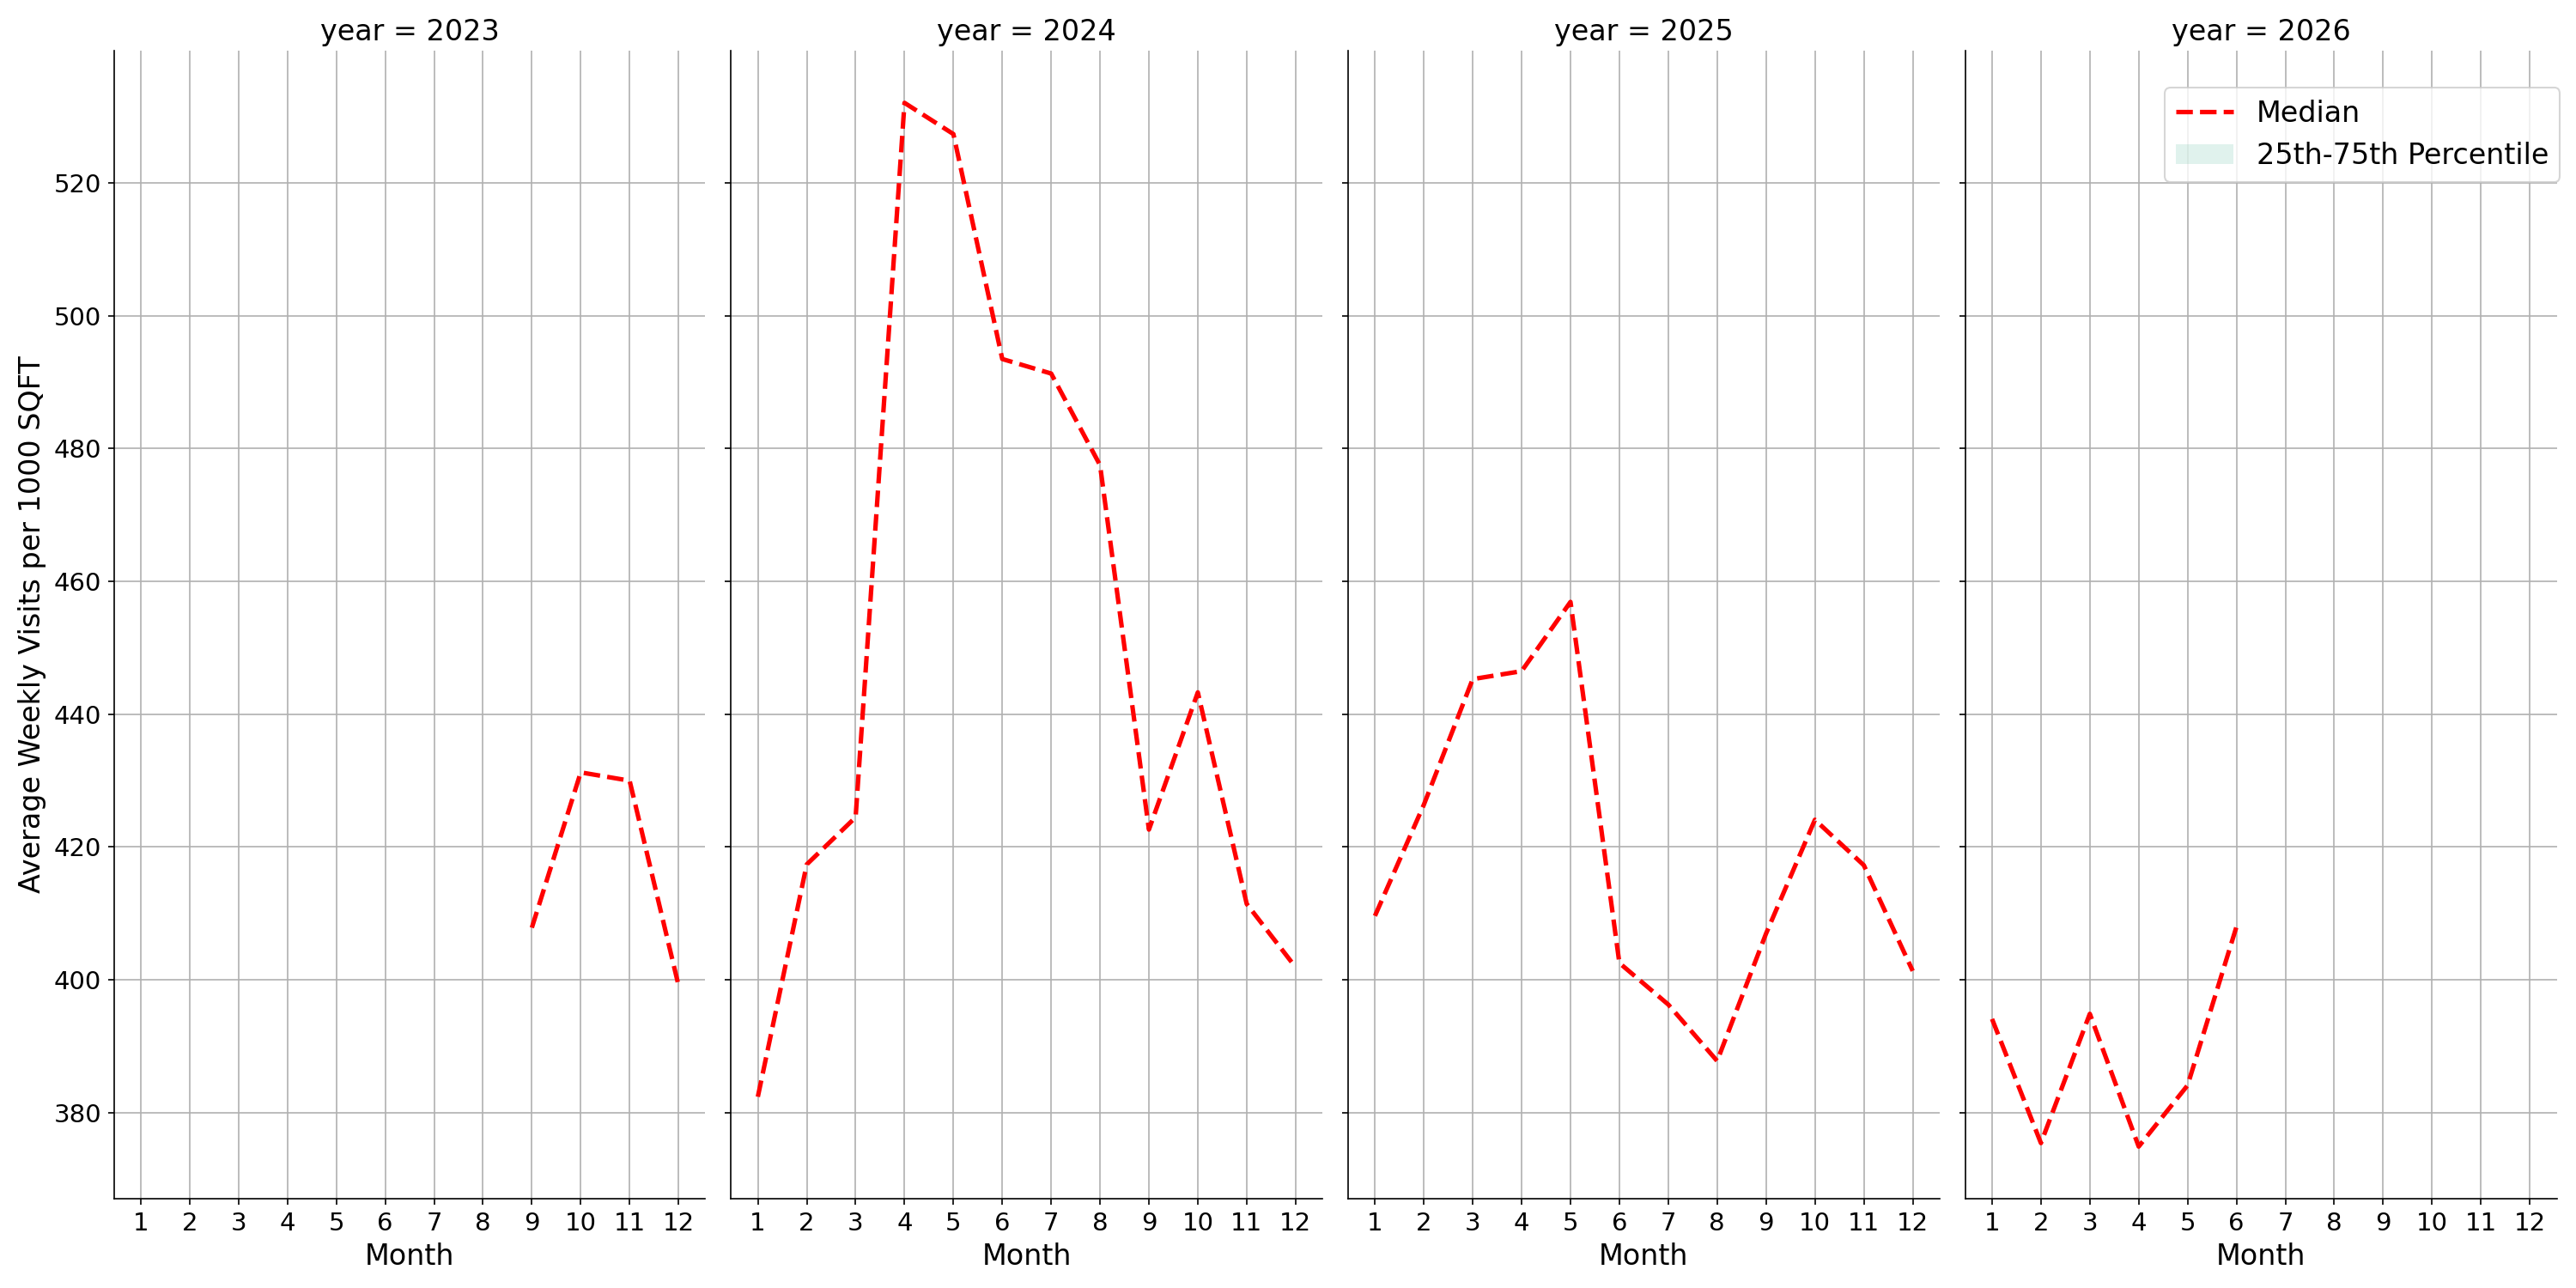
Weekly Visit Per 1K SQFT Trends (Standalone)
The figure below shows the trend of weekly visits per 1000 square feet of space (ksf) - median (red) as well as the 25th to 75th percentile band (green) - over time across only standalone transit hubs that can be directly measured or at least have a polygon/size.
V2.2
V2.3
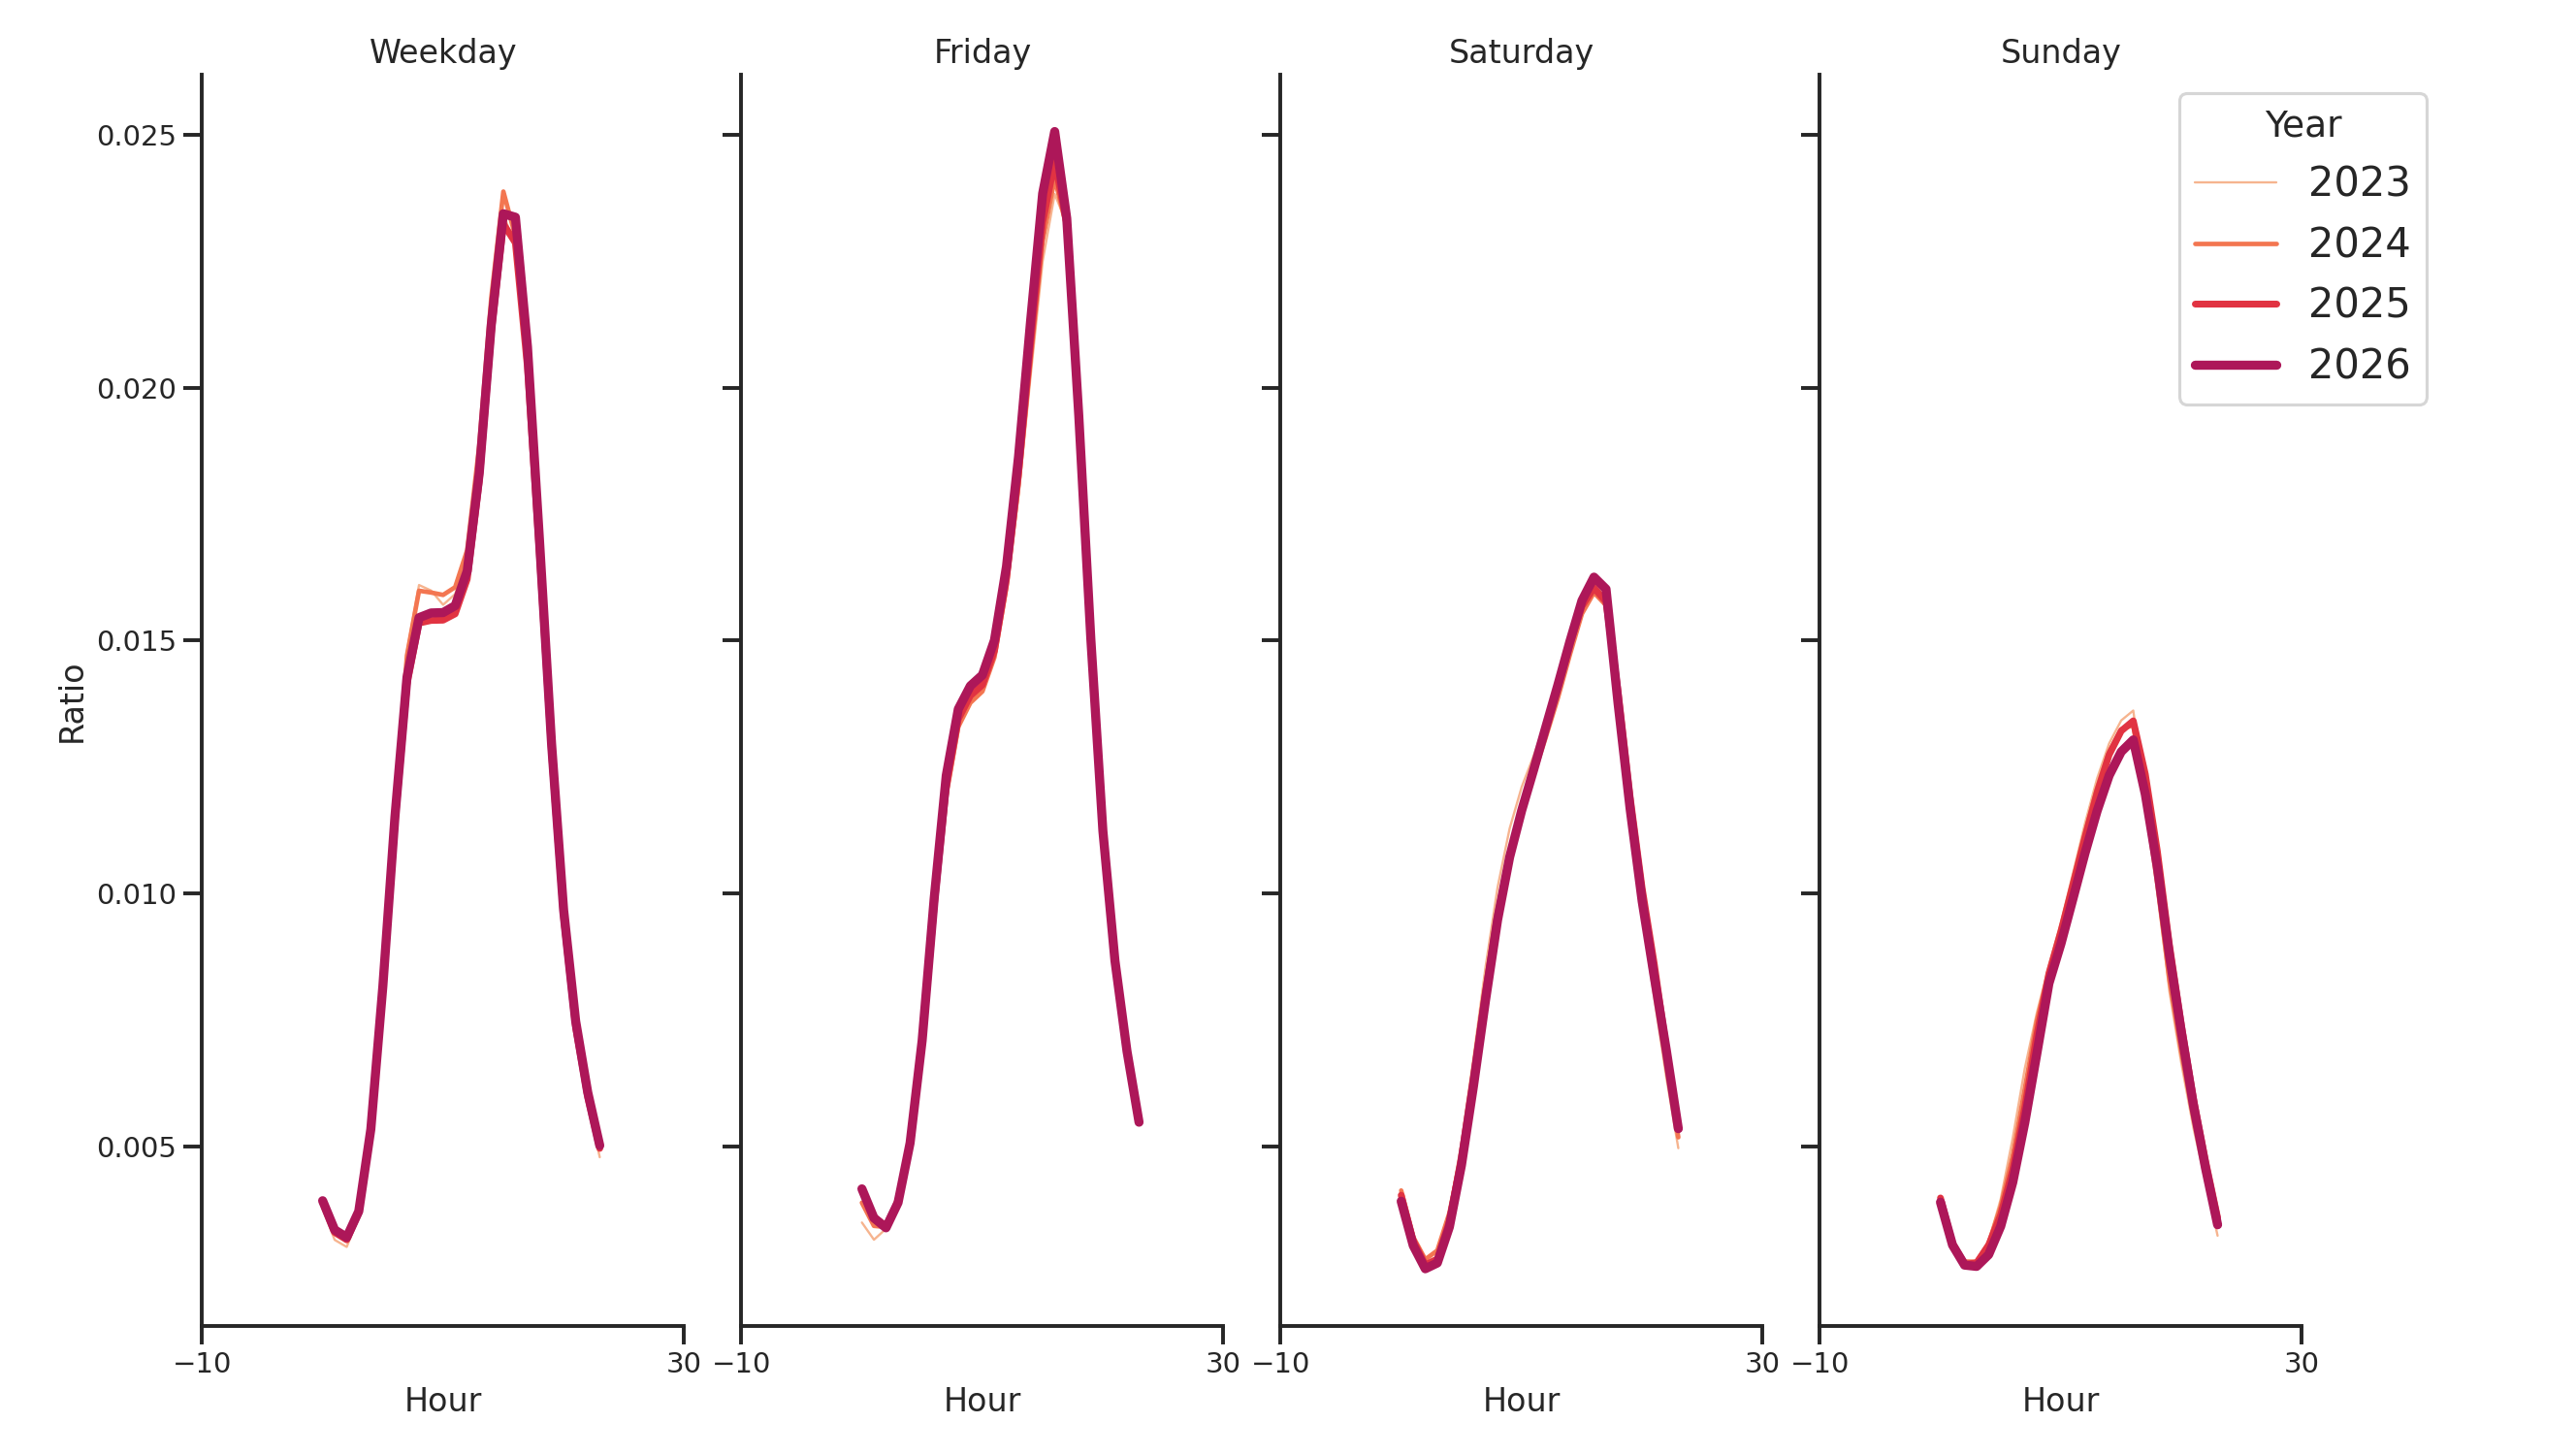
Day of Week and Hour of the Day Profiles
The figure below shows the average ratio of the weekly visits that fall within a specific hour of a specific day of the week. The color represents the year, and each band represents the variation over the months of the year.
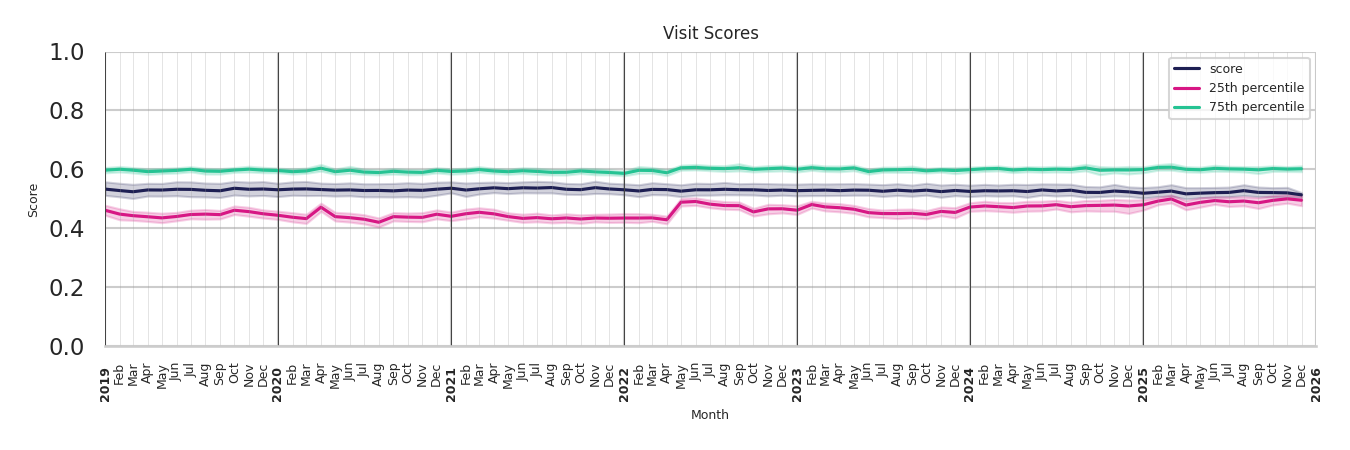
Weekly Visit Scores
Each Motionworks place is assigned scores that measure how closely its observed behavior matches what would be expected for similar places of the same type, in the same general area, and of similar size and urbanicity. These scores are used internally to identify places with unusual behavior — those places have their visit estimates, dwell times, and hourly profiles produced through the unfocused place estimate methodology rather than direct measurement.
| Average Dwell Score | Average Trade Area Distance Footprint Score | Average Profile Score | Average Visit Score | |
|---|---|---|---|---|
| V2.2 | 0.50 | 0.48 | 0.52 | 0.93 |
| V2.3 | 0.50 | 0.53 | 0.51 | 0.94 |
What the Scores Measure
Four dimensions are scored independently each month:
-
Visit Score — compares the place's monthly visits per square foot against similar places. A high score means the place sees significantly more or fewer visitors per unit of space than would be expected for its type and location.
-
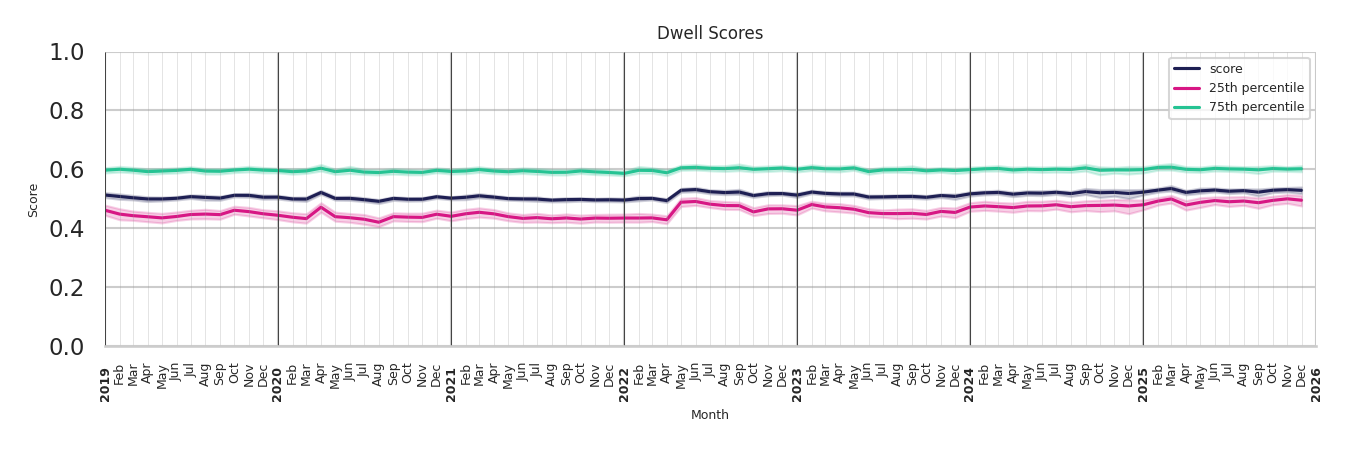
Dwell Score — compares the average time visitors spend at the place against similar places. Both unusually short and unusually long dwell times result in a higher score.
-
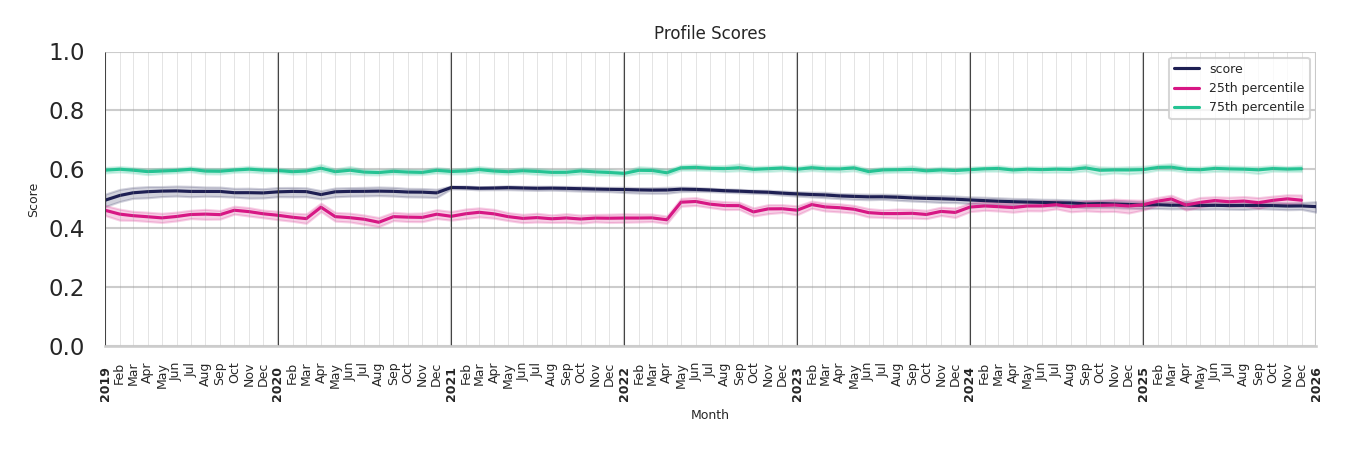
Profile Score — compares the shape of the place's hourly visit pattern across the week against similar places. A bar that is busiest on Tuesday mornings, for example, would score differently than the typical bar crowd pattern.
-
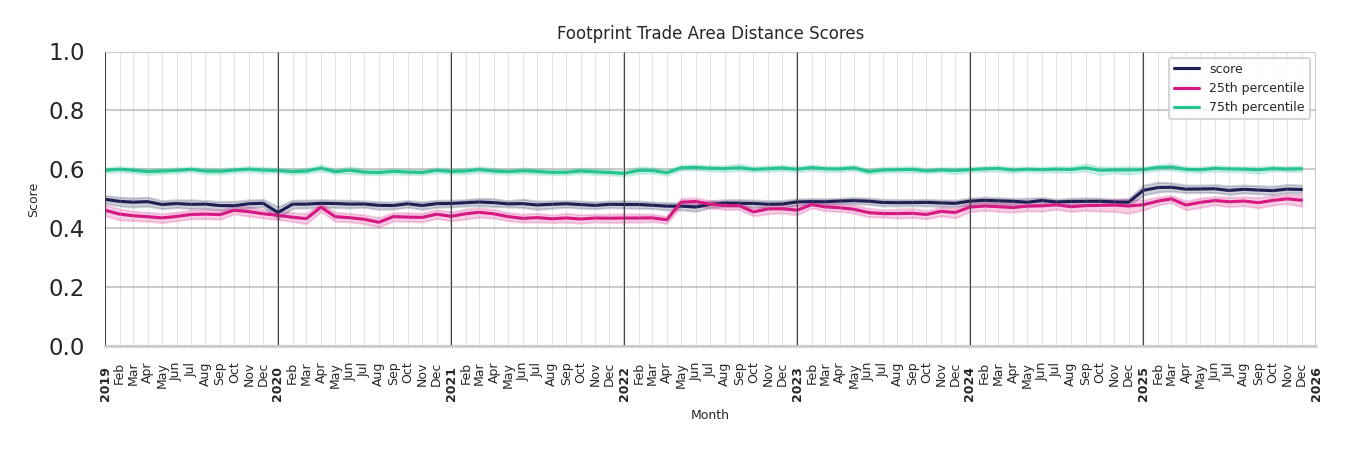
Visitor Distance Score — compares the typical distance visitors travel from home to reach the place against similar places. A neighborhood coffee shop drawing visitors from 50+ miles away, or a major convention center drawing only hyper-local visitors, would both receive elevated scores.
How to Interpret the Score
Scores range from 0 to 1. A score closer to 0 means the place behaves as expected. A score closer to 1 means the place is a significant outlier relative to its peer group.
The table above shows the all-time average score across all Transit Hubs in the Motionworks database. Because scores are centered around the typical place in each peer group, all-time averages tend to settle near 0.5 across most place types — this is expected. The graphs below show how scores have trended month by month since January 2019, including the 25th and 75th percentile band across individual places.
Visit Score Graph
Dwell Score Graph
Profile Score Graph
Footprint Trade Area Distance Score Graph
Tradeareas
A trade area is where customers or visitors live and how far they are likely to travel to an establishment or neighborhood. Motionworks Placecast™ Trade Areas documents the home location of visitors by the number of visits to a Motionworks Place or Region every month since 2019. These insights are produced with the Motionworks Population Intelligence Platform.
Verification
Motionworks verifies Trade Area estimates to ensure confidence and illustrate the quality of our data. Motionworks maintains data on expected trade areas by place type from trusted third parties such as travel surveys and academic research. The following tables provide an overview of verification for each Motionworks place type nationally compared to target values Motionworks has identified for each place type. Due to the detail of Motionworks place types, there is not always a one-to-one relationship between Motionworks place types and those identified in studies and research. As a result, some values from studies and research are shared across multiple Motionworks place types.
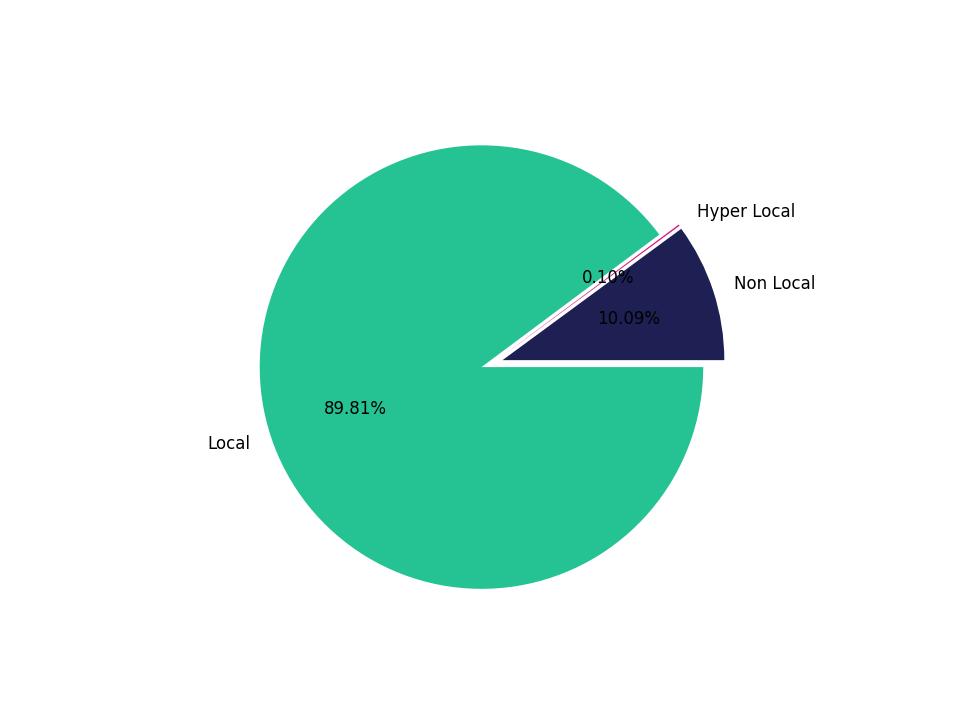
Tradeareas visits distribution
Motionworks segments trade areas by 1) local, 2) hyper local, 3) non-local. Local is defined as the home to place distance is < 50 miles, Hyper local is defined as the home and place have the same Census block group, and Non-local is defined as the home to place distance is > 50 miles. The figure below illustrates the distribution of visits by trade area segment.
Local (< 50 miles from home) Statistics
| Version | All-Time Median Distance | Latest Month (202512) | Month-over-Month | Year-over-Year |
|---|---|---|---|---|
| v2.2 | 10.0 miles | 22.7 miles | 0.9 % | 115.4 % |
| v2.3 | 3.5 miles | 5.2 miles | 3.5 % | 34.5 % |
Hyper Local (same home and place Census block group) Statistics
| Version | All-Time Median Distance | Latest Month (202512) | Month-over-Month | Year-over-Year |
|---|---|---|---|---|
| v2.2 | 1.0 miles | 1.0 miles | 0.0 % | 0.0 % |
| v2.3 | 0.1 miles | 0.1 miles | 0.0 % | 33.3 % |
Non-Local (>50 miles from home) Statistics
| Version | All-Time Median Distance | Latest Month (202512) | Month-over-Month | Year-over-Year |
|---|---|---|---|---|
| v2.2 | 713.4 miles | 501.4 miles | 4.1 % | -22.8 % |
| v2.3 | 442.8 miles | 374.6 miles | 18.6 % | 0.1 % |
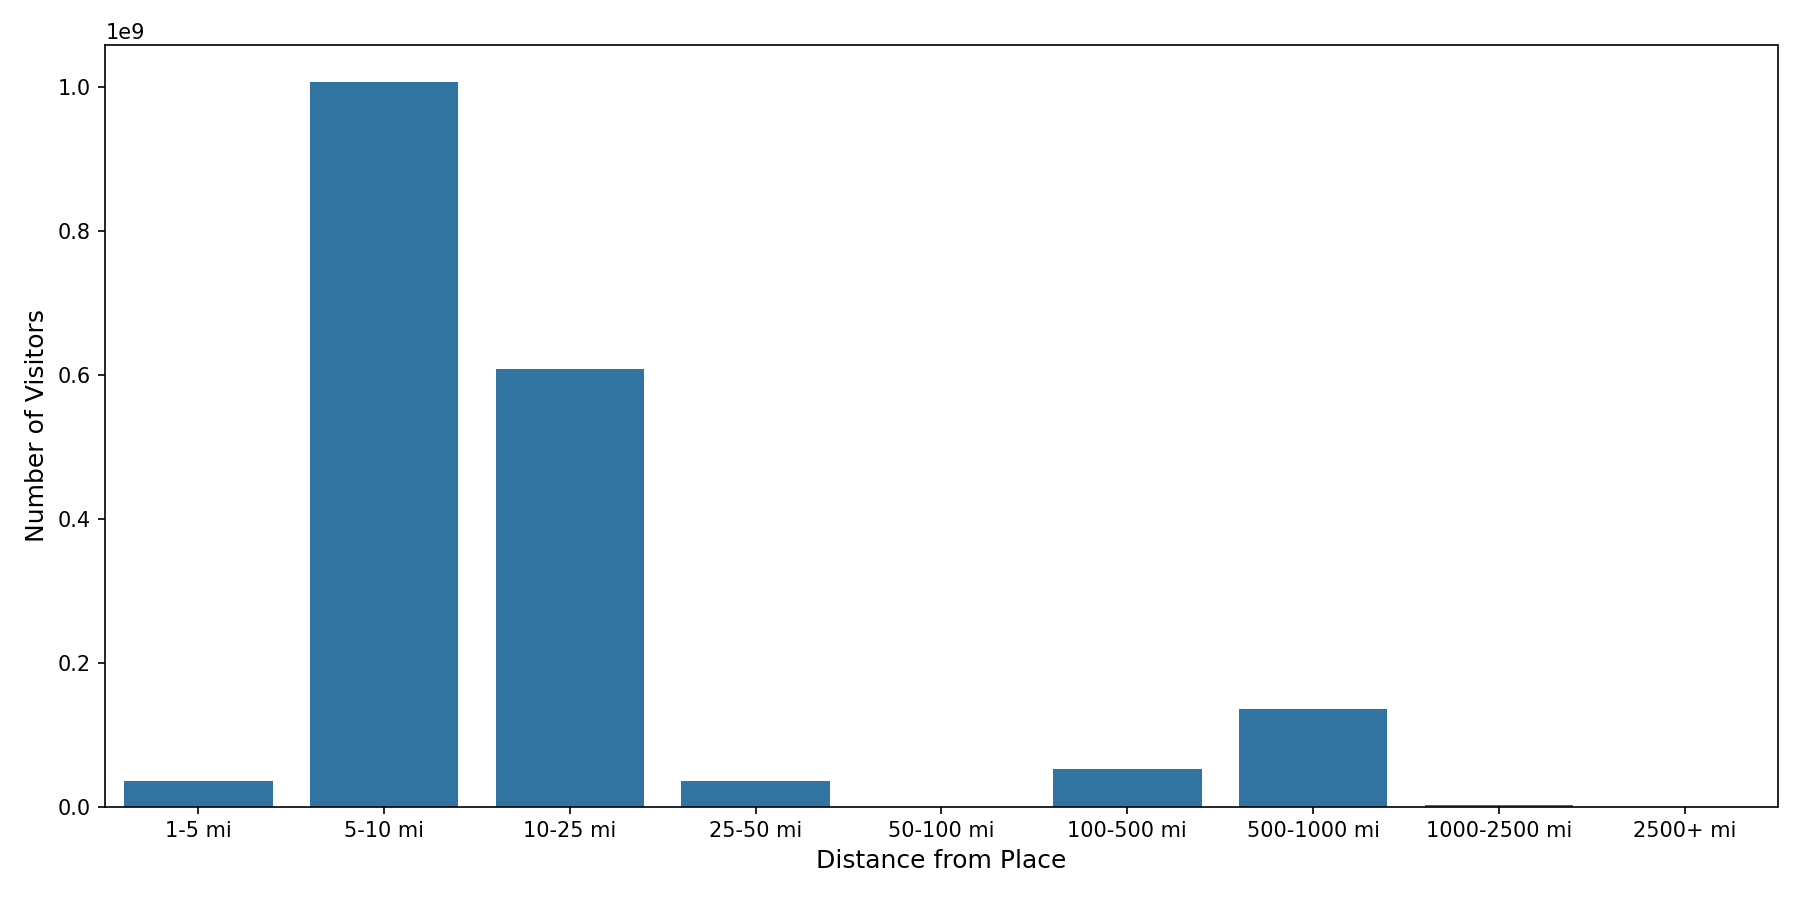
Home to place distance distribution
The figure below illustrates the home to place distance distribution by distance bin.
Updated 10 days ago