
Public Transit Places
Motionworks' Placecast™ supports measuring public transit systems.
Public Transit
Motionworks Placecast™ provides station-level visit estimates for transit systems across the United States, validated against first-party ridership data from transit operators and the Federal Transit Administration's National Transit Database. The methodology below describes how Motionworks measures transit stations, incorporates authoritative ridership data, and produces the final visit estimates that appear in the Placecast product.
For details on how Motionworks identifies base visitation, demographics, and dwell time, see the People Methodology overview.
Data Collection
Public transit systems and governments collect and publish a significant amount of data on public transit ridership. Motionworks collects and processes this data to inform its calculations of transit station activity.
Federal
The Federal Transit Administration maintains the National Transit Database (FTA NTD). Transit operators are required to provide data to the NTD as part of federal funding agreements. The NTD releases total monthly boardings by transit system and mode of transit (e.g., Heavy Rail, Light Rail, Commuter Rail) on a continual basis. Motionworks checks the NTD for updates on a weekly basis and collects new data where available.
Individual Systems
Motionworks collects data released by individual transit systems when the data is published on a regular schedule in an easily machine-readable format. Update intervals vary depending on the system.
Motionworks automatically collects data daily from:
- Chicago Transit Authority (CTA)
- New York City Metropolitan Transportation Authority (MTA)
- Port Authority of New York & New Jersey Trans Hudson (PATH)
Motionworks automatically collects data monthly from:
- Bay Area Rapid Transit (BART)
- Miami-Dade Transit
Motionworks has collected data from most other significant transit systems on an annual ad-hoc basis.
Measuring Transit Stations
Initial Place Measurement
Motionworks begins by measuring the visitation at transit stations depending on their focused or unfocused status. Focused transit stations are directly measured based on how many devices were seen within the data collection area of the station over time. About 85% of the transit stations in our database are focused. Motionworks estimates visitation for unfocused transit stations (e.g., underground stations) based on either:
- The parent place (if any) and the traffic passed down from parent to child. This is the same methodology Motionworks uses for non-transit parent/child places.
- Very few of the unfocused transit stations fall within this category -- around 2%
- The size of the station and the median visits per 1,000 square feet of space calculated based on other focused transit stations in the same market.
- The majority of the unfocused transit stations fall within this category -- around 98%
Once this is complete, base visitation is established for each transit station. See place processing for more information.
Station Mapping
Motionworks has onboarded transit stations as Places in the Motionworks database, and these places are mapped to the stations as they are represented in the first-party ridership data. One place can be associated with multiple stations that are interconnected (e.g., a station complex). This mapping is done by first programmatically intersecting the station coordinates to place polygons and then manually reviewing the results. For example, in New York City, the 14th St / 6th Ave (L) Station is mapped to 4 station counts from NYC MTA data.
As part of this ongoing process, Motionworks has added all known rail stations to our Place database for existing public transit operators. Motionworks continuously monitors transit systems for new stations and adds them on a rolling basis as they open.
Ridership Data Standardization
Once base visitation is established and station mapping is complete, Motionworks calculates a scaling value for any transit station where first-party data is available. Motionworks uses FTA NTD monthly data for systems where ridership data is not available on a monthly basis. For systems where first-party data is available on a monthly or more frequent basis, Motionworks uses that data directly.
When data is not available on a monthly (or more often) basis
In this case, Motionworks relies on the FTA NTD, which provides total monthly boardings by system and mode. Motionworks estimates the total number of entrances and exits (i.e., visits) to the stations of a system using the following formula: SystemVisits = SystemBoardings x 2 x CoverageRatio. CoverageRatio is the percentage of the stations that Motionworks covers in its database. Since Motionworks has onboarded all available stations for systems that are measured, the coverage ratio is 100%.
The multiplication by 2 converts boardings to total visits -- one visit at the origin station and one visit at the destination station. Once system-wide visits by month and mode are understood, Motionworks distributes them to individual stations. Using the relative yearly ridership for each station and the modes serviced at each station, Motionworks distributes the system-wide monthly visits proportionately onto each station. Once complete, this produces a monthly visitation estimate for each station.
When data is available on a monthly (or more often) basis
In this case, Motionworks relies on the first-party data from the individual transit system source. There are fewer steps needed since the first-party data can be directly applied to the matching station. Depending on the system, the formula for these stations is based on boardings (visits = boardings x 2) or ons-and-offs (visits = ons + offs). Motionworks also accounts for places that map to multiple stations. Once complete, this produces a monthly visitation estimate for each station.
Calculating Factors
The goal of understanding the first-party data is to calculate factors that Motionworks uses to adjust the base visitation generated earlier. Motionworks aggregates the ridership-based visitation values from the standardization steps above into weekly numbers. When available, daily first-party data is aggregated to weekly; monthly visitation is distributed uniformly across weeks. The factors are calculated by dividing the first-party visitation by the observed visitation for each station and week. These factors are also applied to day-of-week and hour-of-day metrics so that temporal patterns align to the first-party data.
As an example, consider a system with 2 stations where first-party turnstile data for a single week reports 100 total entries, while the observed data for that same week reports 50:
- Assume consistent weekly numbers throughout the month: first-party = 4 x 100 = 400, observed = 4 x 50 = 200
- Calculate the factor as the ratio of first-party to observed: 400 / 200 = 2.0
- Apply a factor of 2.0 to the observed data for the weekly average in that month, as well as to day-of-week and hour-of-day estimates
Factors are applied regardless of direction -- scaling visits up when reported ridership exceeds observed activity, or scaling down when observed activity exceeds reported ridership. Factors are capped at an upper bound to prevent outlier distortion.
Factor Imputation/Expansion
There are situations where first-party data is incomplete. For example, factors may exist for certain time periods but not for all. When this happens, Motionworks estimates the missing factors as the median factor of the last 8 available weeks. If this still results in missing factors, Motionworks imputes with the median factor of the next 8 available weeks. This ensures that a factor is applied, based on the best available estimate, to the entire history of a scaled place.
Final Visitation
Once the above steps to generate base visitation, map station records, standardize ridership, and generate factors are complete, Motionworks applies the factors to scale the base visitation accordingly and produce the final visit estimates reported in the product.
Transit Stats
The table below compares Motionworks estimated station visits against benchmark ridership data for the largest transit systems in the Placecast database. A Difference Ratio near zero indicates close agreement between Motionworks estimates and benchmark data. This table includes the top 25 agencies by system rank, representing the largest transit systems in the United States.
| Agencies (in order of Benchmark Visits) | System Rank | Benchmark Station Visits* | Motionworks Estimated Station Visits | Difference Ratio (%) | |
|---|---|---|---|---|---|
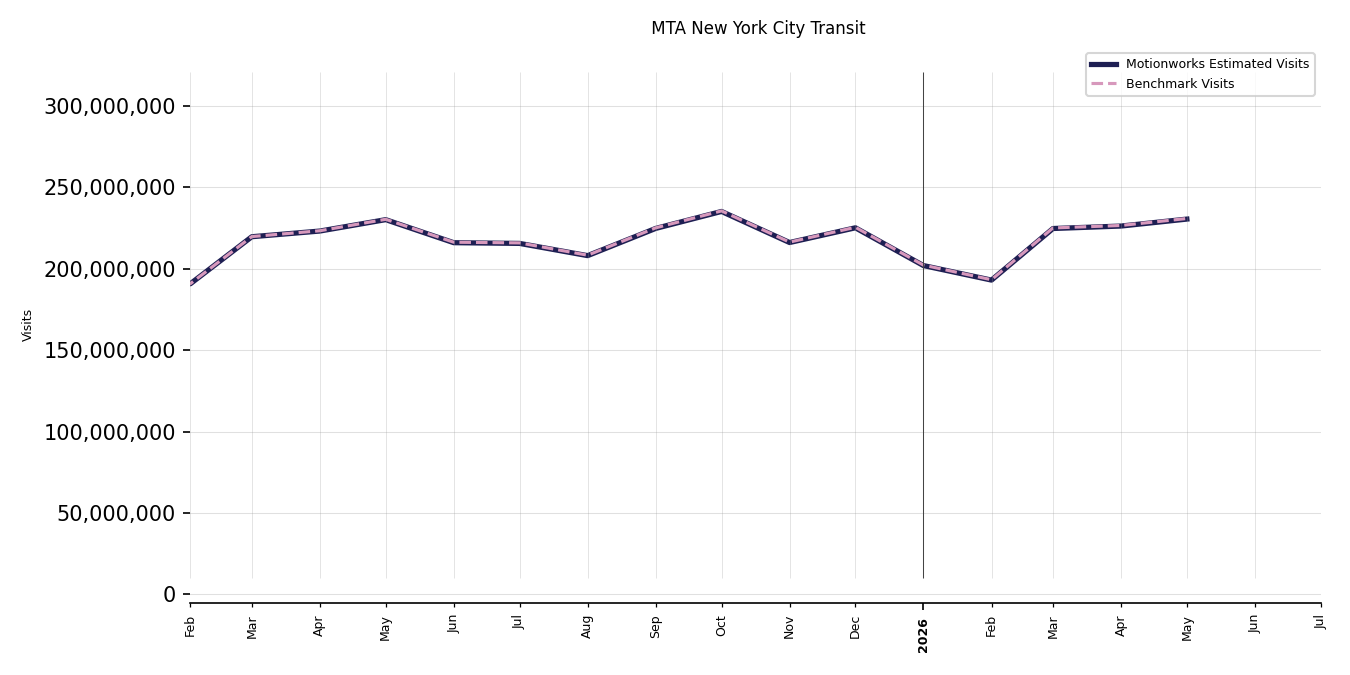
| 1 | MTA New York City Transit | 1/44 | 225,474,546 | 225,151,401 | -0.14 |
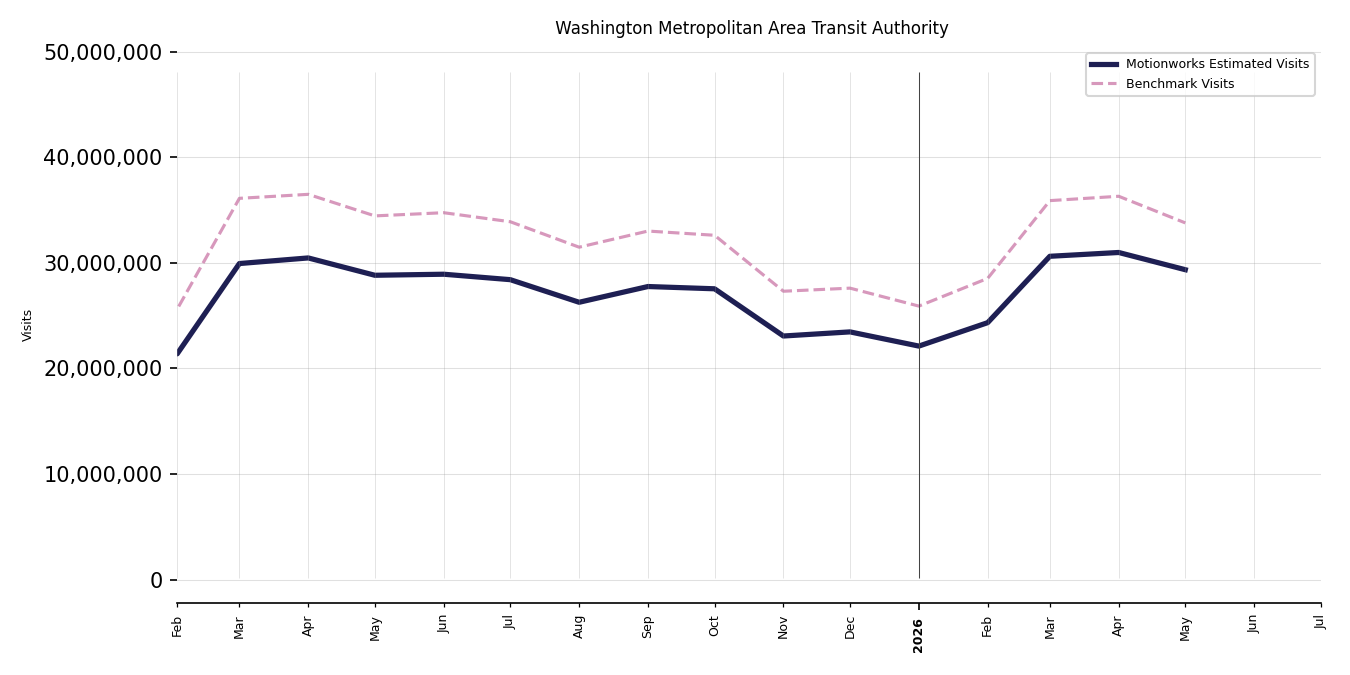
| 2 | Washington Metropolitan Area Transit Authority | 2/44 | 27,605,920 | 23,462,274 | -15.01 |
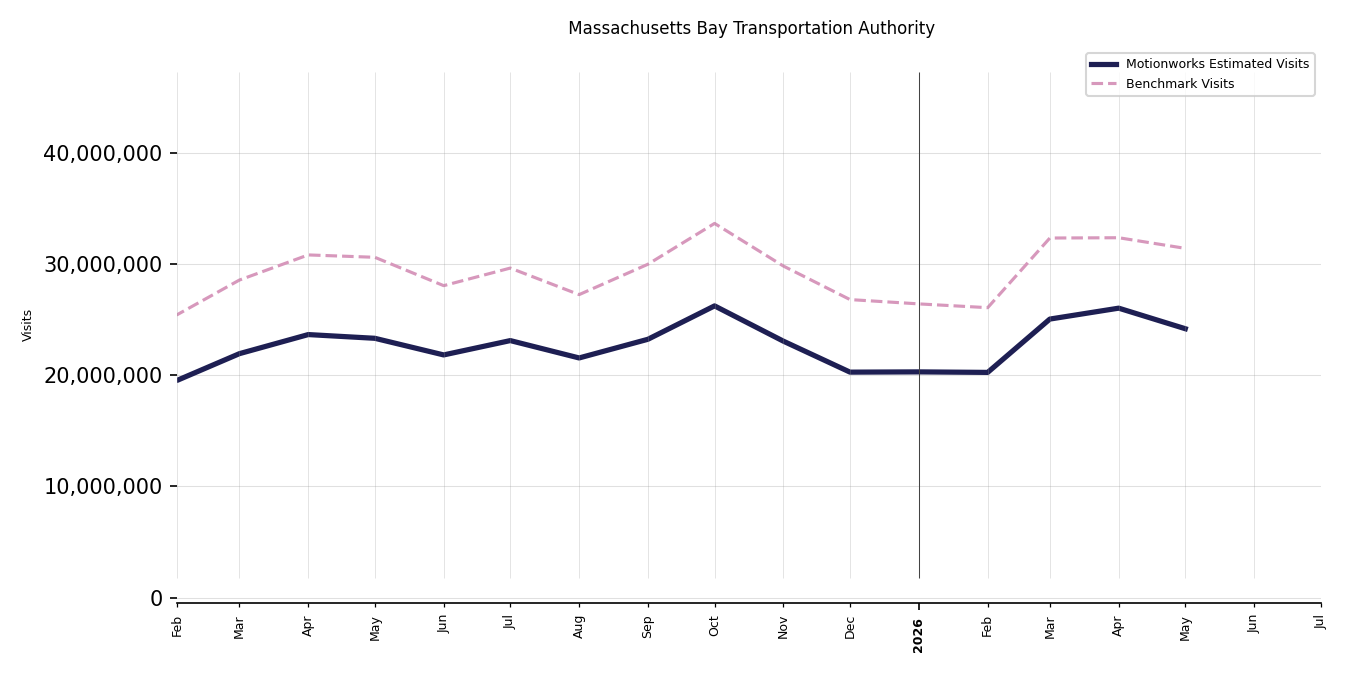
| 3 | Massachusetts Bay Transportation Authority | 3/44 | 26,784,872 | 20,265,338 | -24.34 |
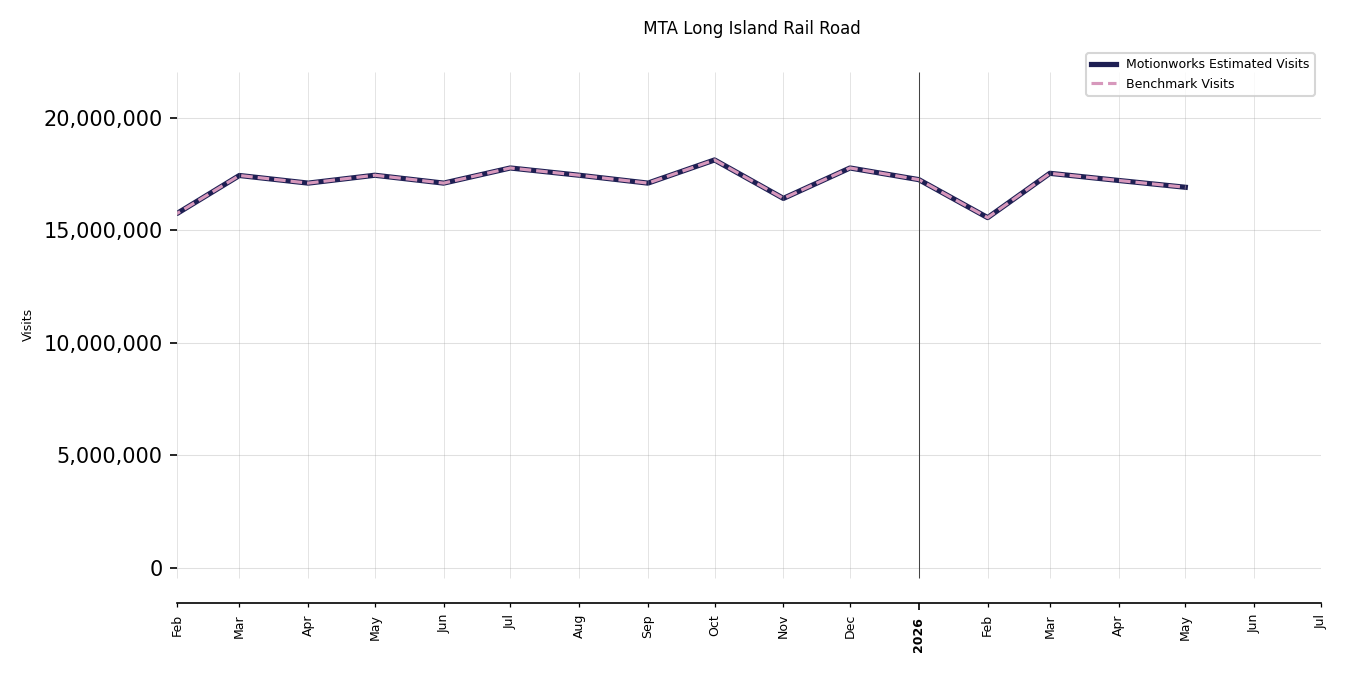
| 4 | MTA Long Island Rail Road | 4/44 | 17,775,404 | 17,775,404 | 0 |
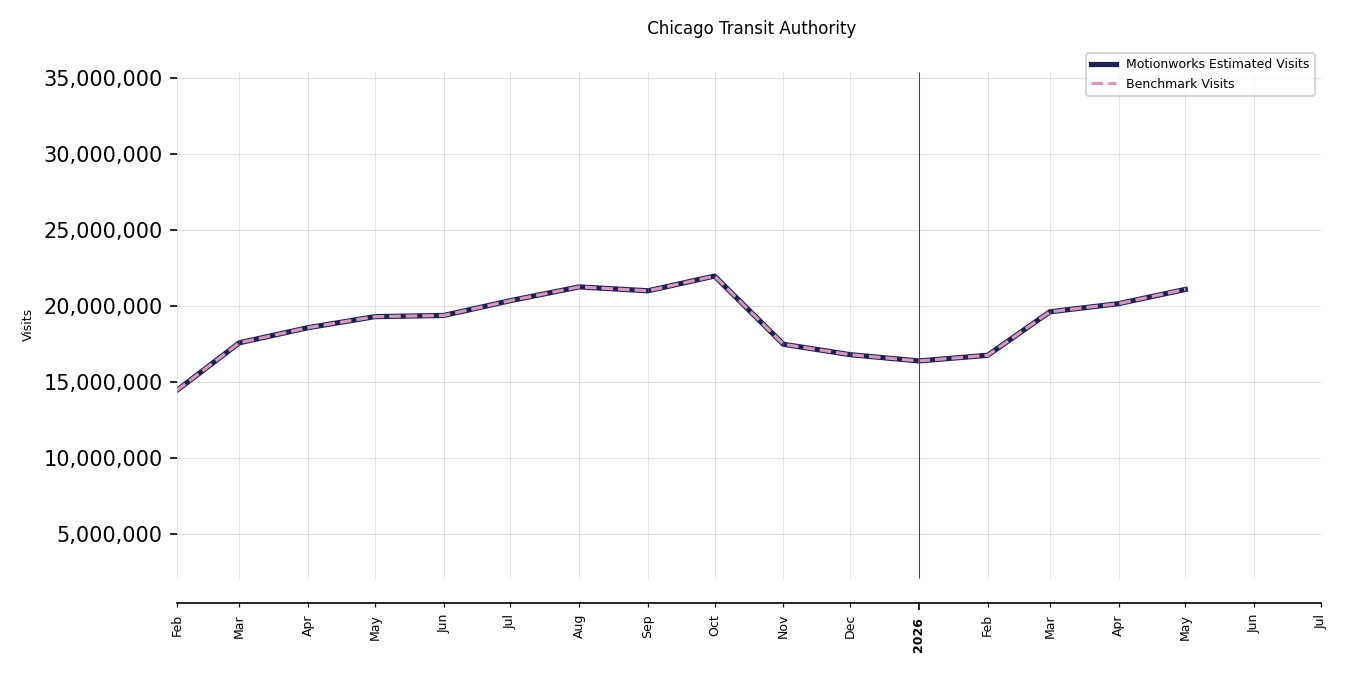
| 5 | Chicago Transit Authority | 5/44 | 16,811,096 | 16,811,096 | 0 |
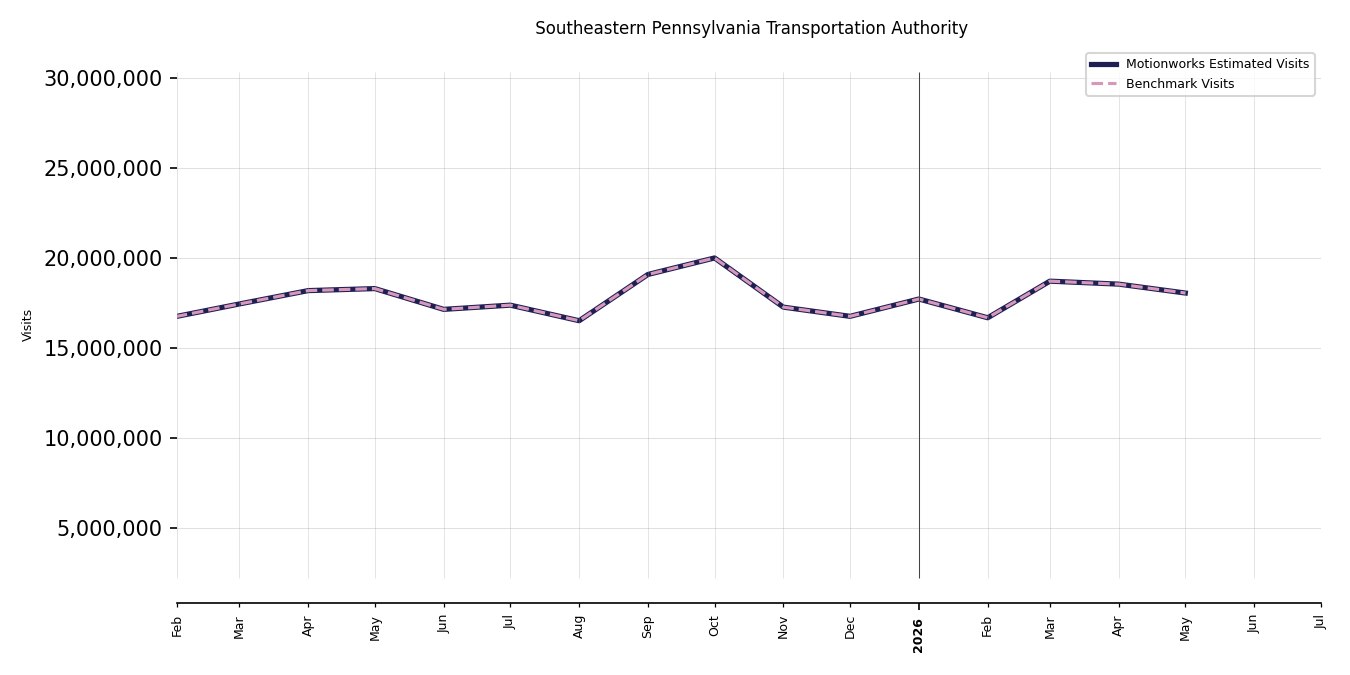
| 6 | Southeastern Pennsylvania Transportation Authority | 6/44 | 16,742,014 | 16,742,014 | 0 |
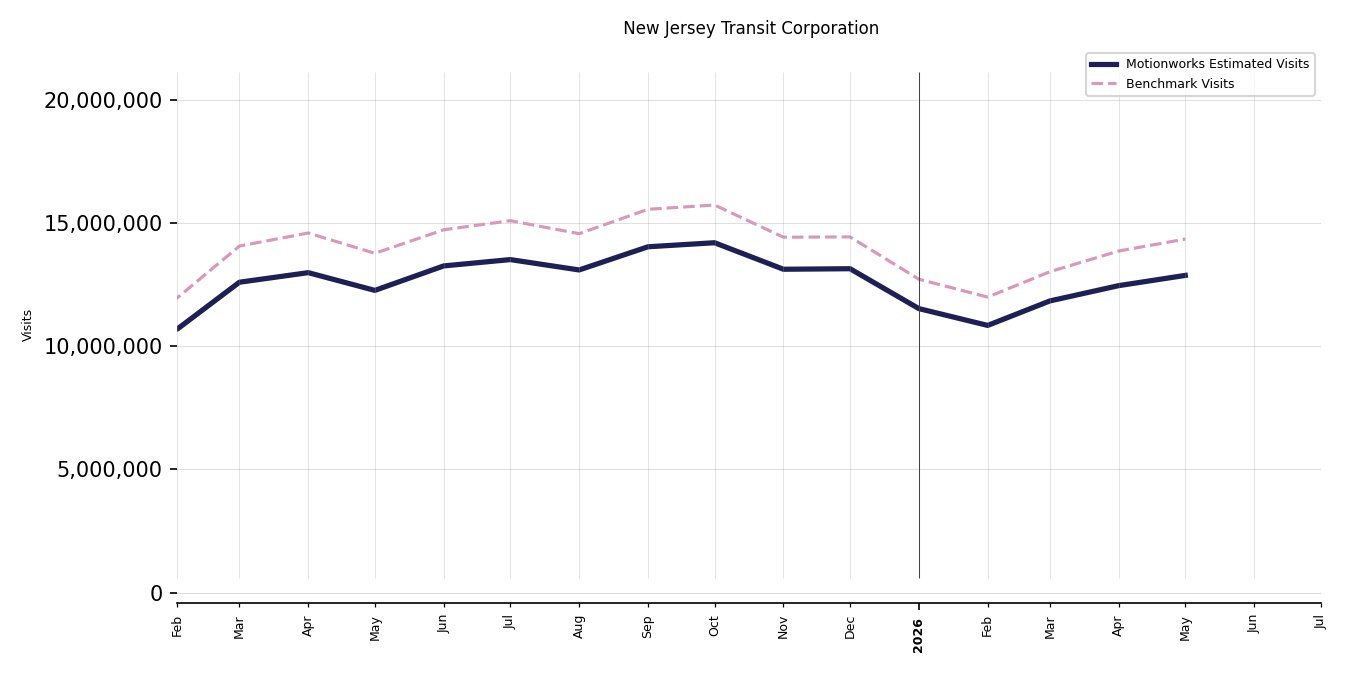
| 7 | New Jersey Transit Corporation | 7/44 | 14,442,694 | 13,150,517 | -8.95 |
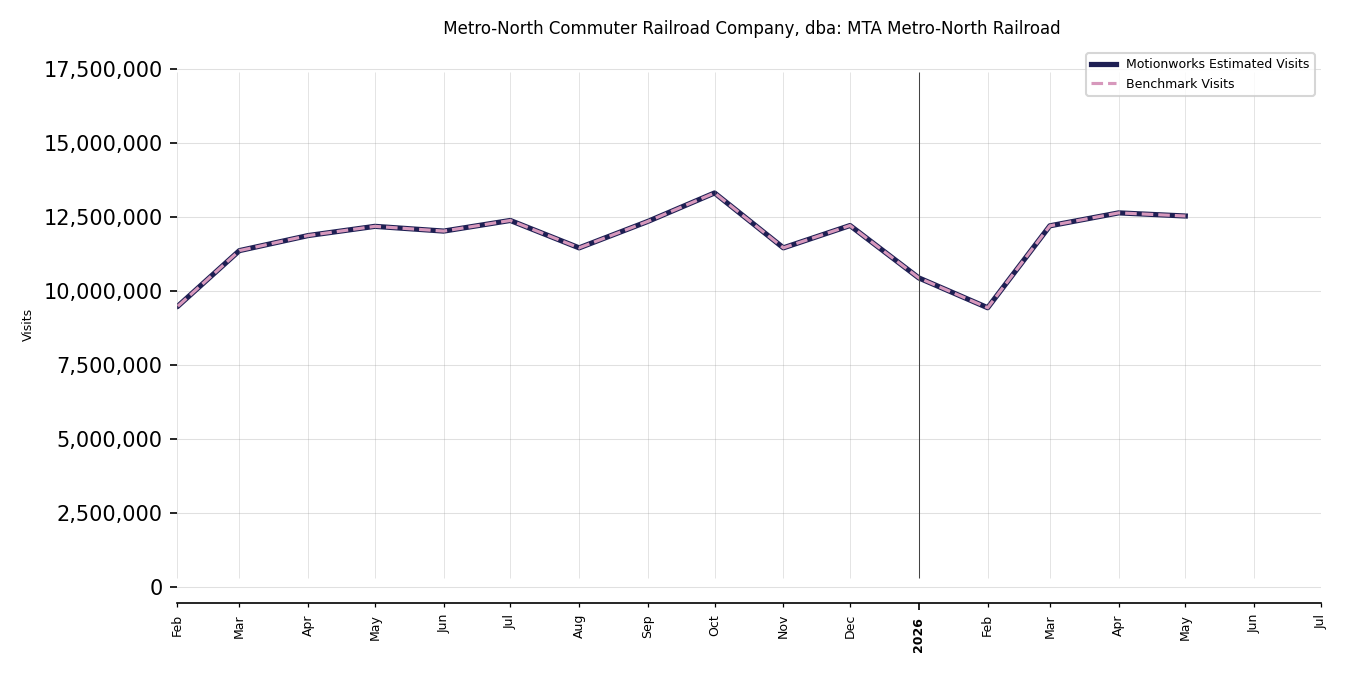
| 8 | Metro-North Commuter Railroad Company, dba: MTA Metro-North Railroad | 8/44 | 12,207,780 | 12,207,780 | 0 |
| 9 | Los Angeles County Metropolitan Transportation Authority | 9/44 | 10,481,530 | 10,481,531 | 0 |
| 10 | Port Authority Trans-Hudson Corporation | 10/44 | 10,351,950 | 10,351,950 | 0 |
| 11 | San Francisco Bay Area Rapid Transit District | 11/44 | 9,360,602 | 9,360,602 | 0 |
| 12 | San Diego Metropolitan Transit System | 12/44 | 6,397,734 | 6,397,735 | 0 |
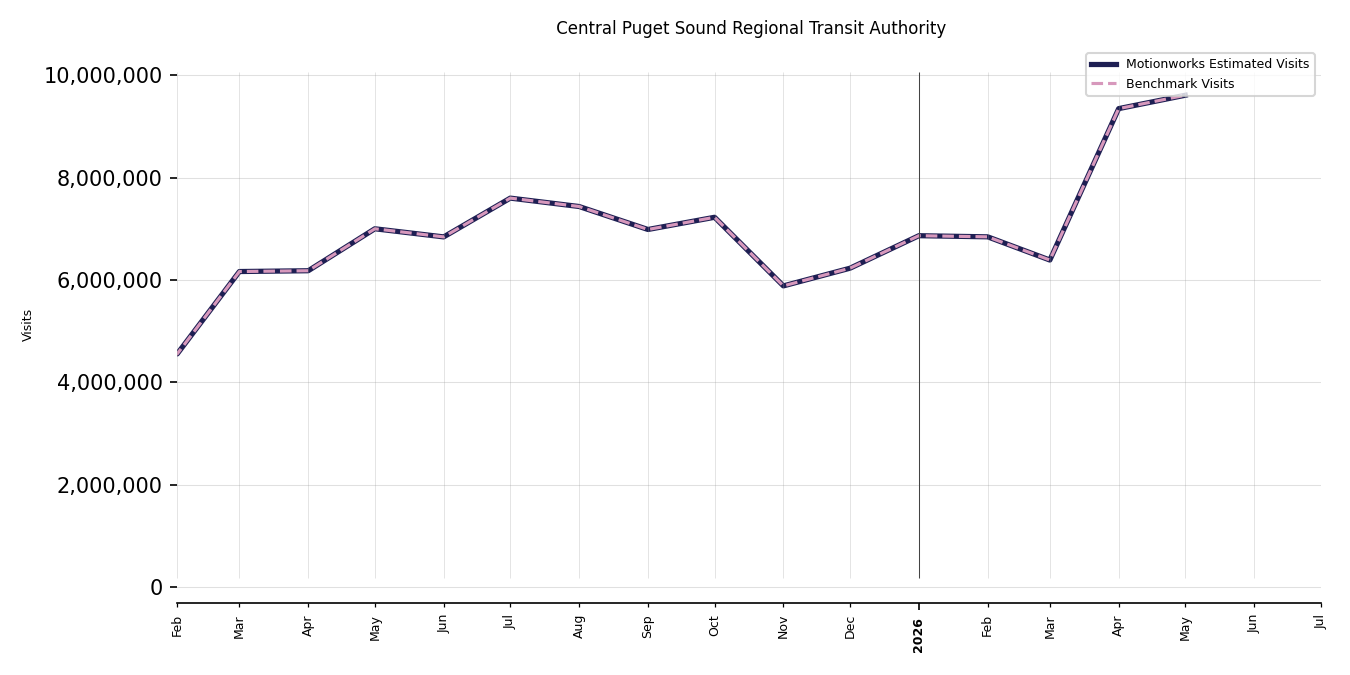
| 13 | Central Puget Sound Regional Transit Authority | 13/44 | 6,231,688 | 6,231,688 | 0 |
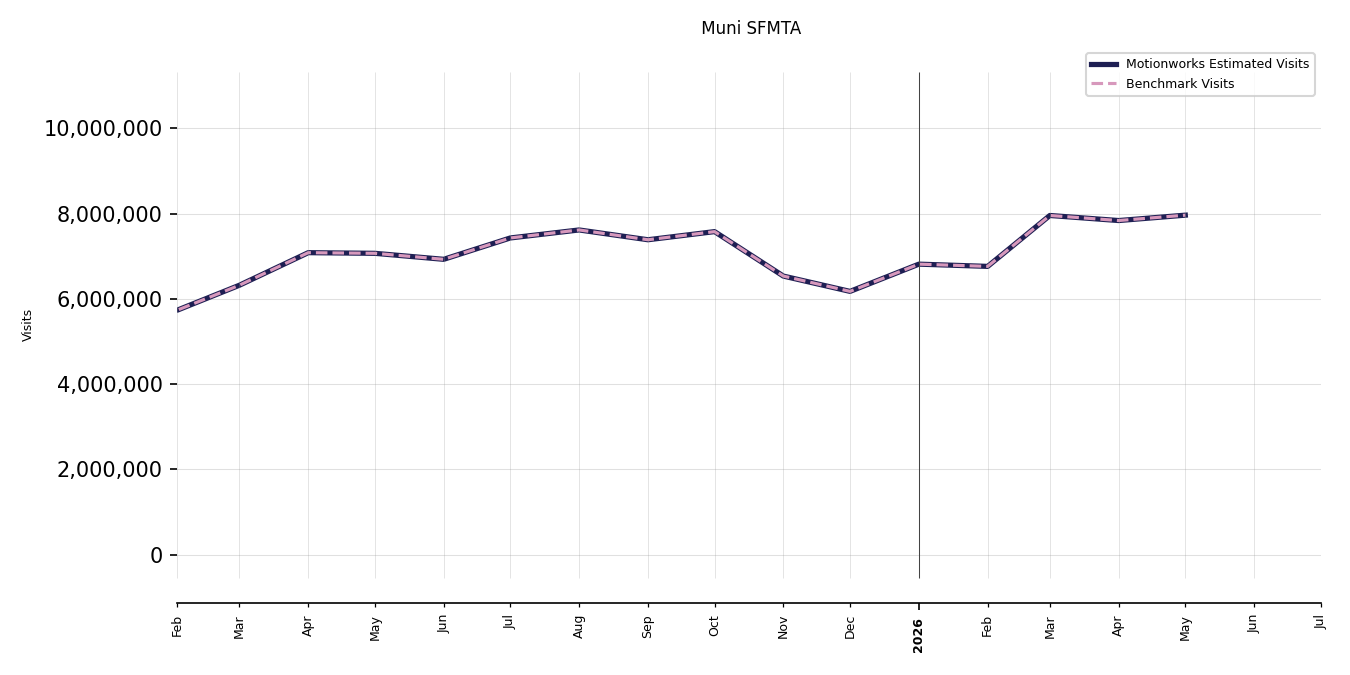
| 14 | Muni SFMTA | 14/44 | 6,176,790 | 6,176,791 | 0 |
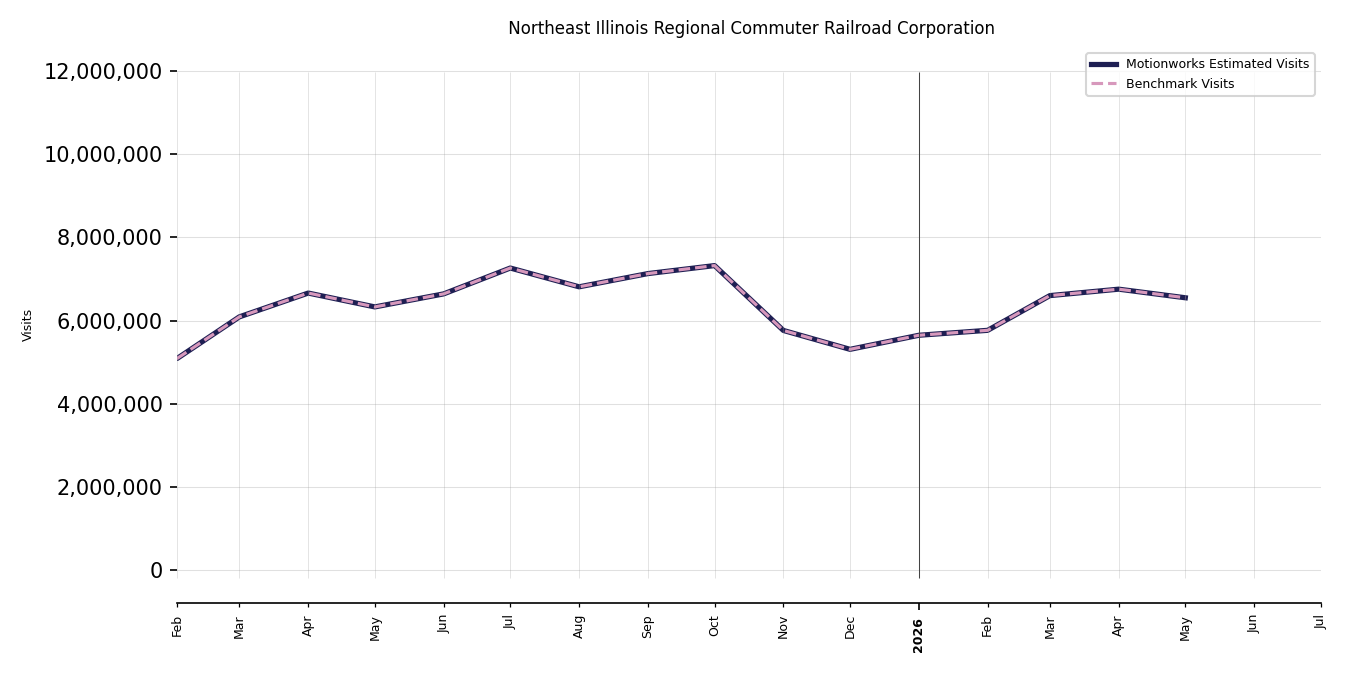
| 15 | Northeast Illinois Regional Commuter Railroad Corporation | 15/44 | 5,311,384 | 5,311,385 | 0 |
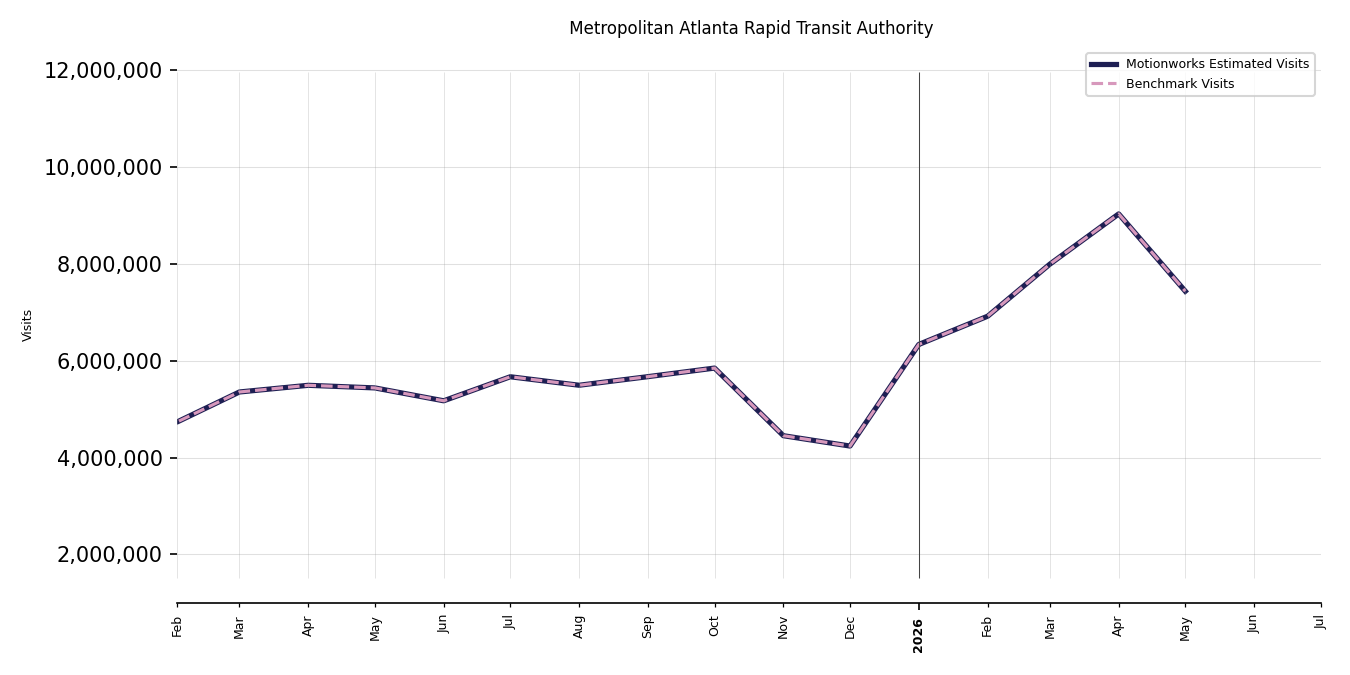
| 16 | Metropolitan Atlanta Rapid Transit Authority | 16/44 | 4,237,084 | 4,237,085 | 0 |
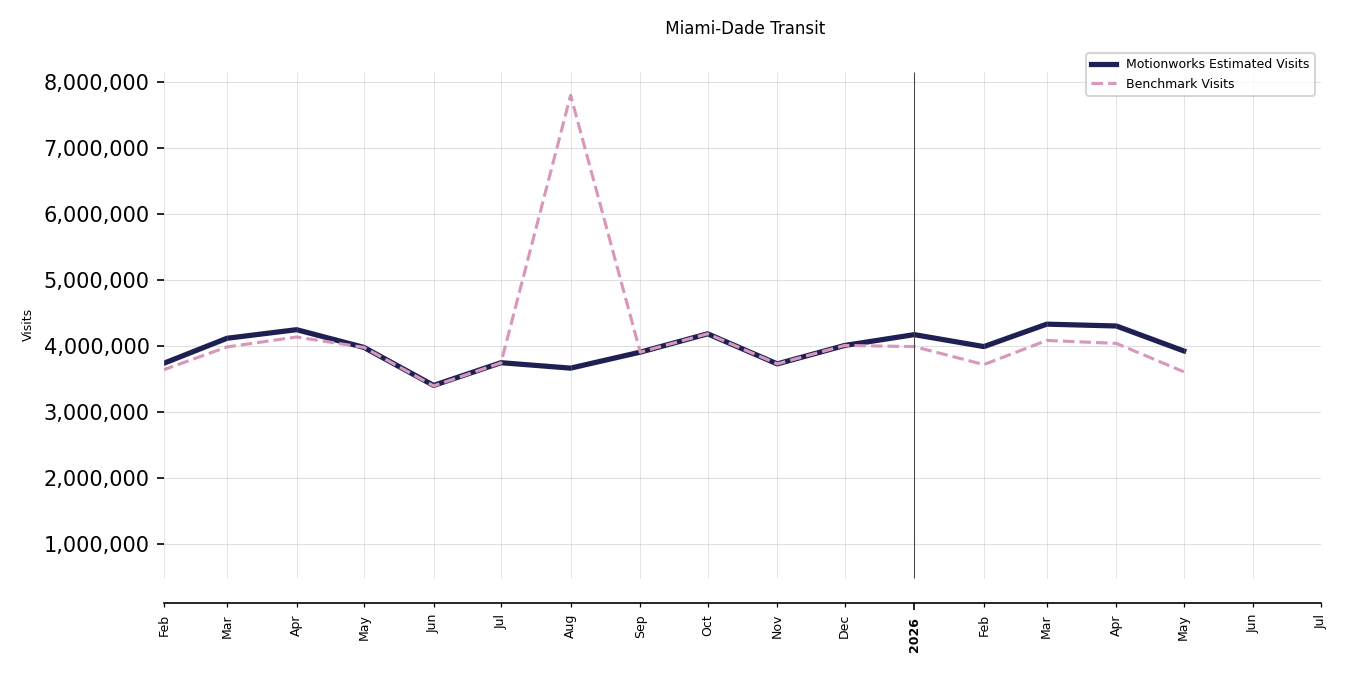
| 17 | Miami-Dade Transit | 17/44 | 4,009,130 | 4,009,130 | 0 |
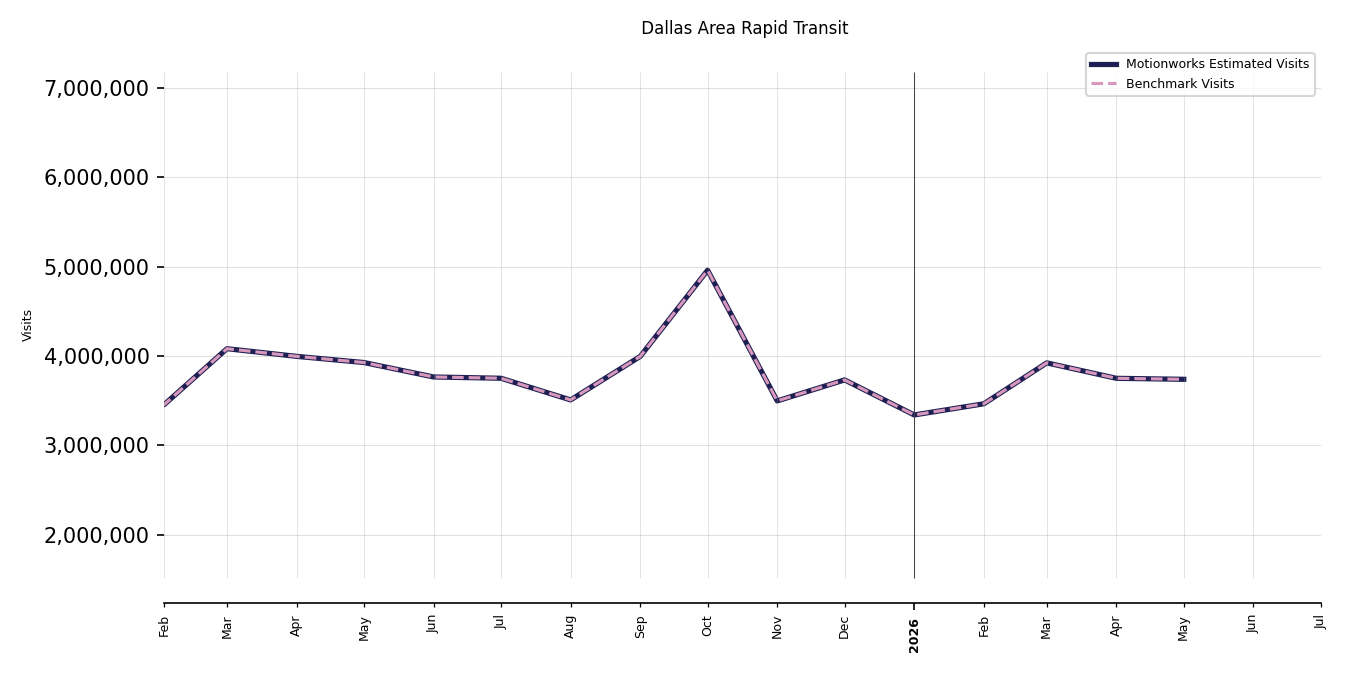
| 18 | Dallas Area Rapid Transit | 18/44 | 3,731,898 | 3,731,898 | 0 |
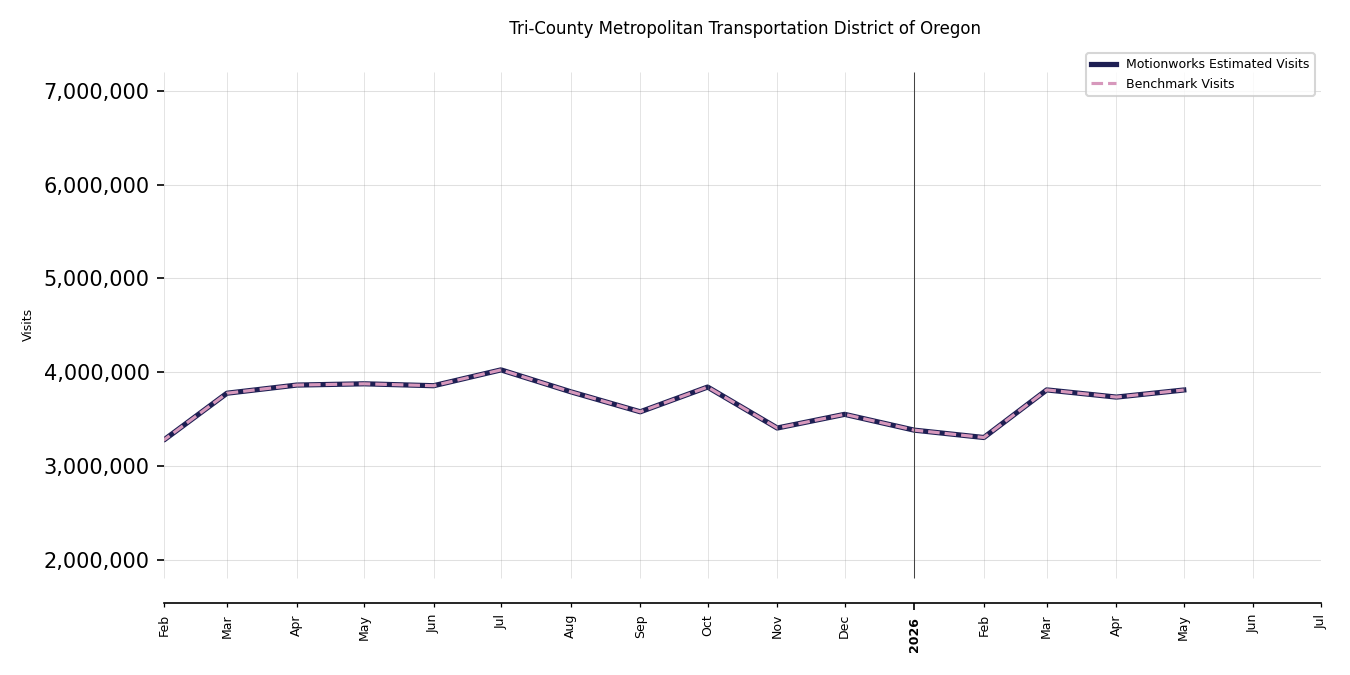
| 19 | Tri-County Metropolitan Transportation District of Oregon | 19/44 | 3,549,658 | 3,549,658 | 0 |
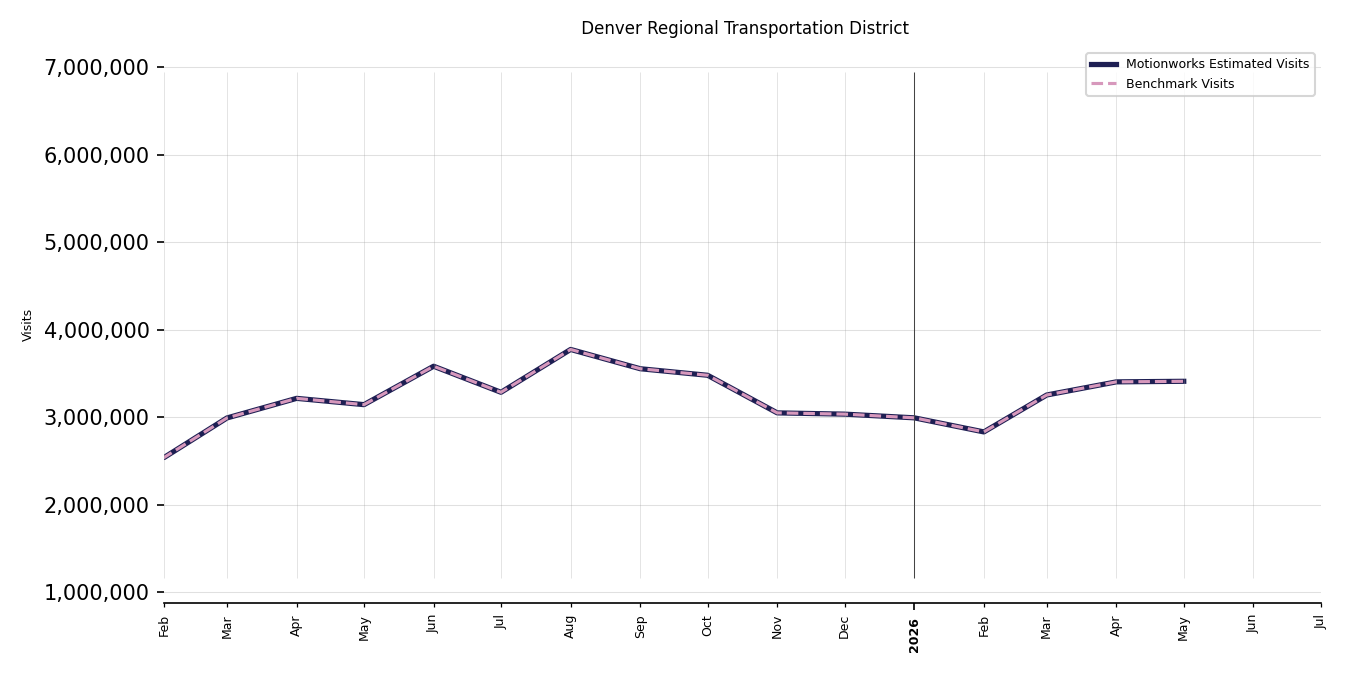
| 20 | Denver Regional Transportation District | 20/44 | 3,036,278 | 3,036,278 | 0 |
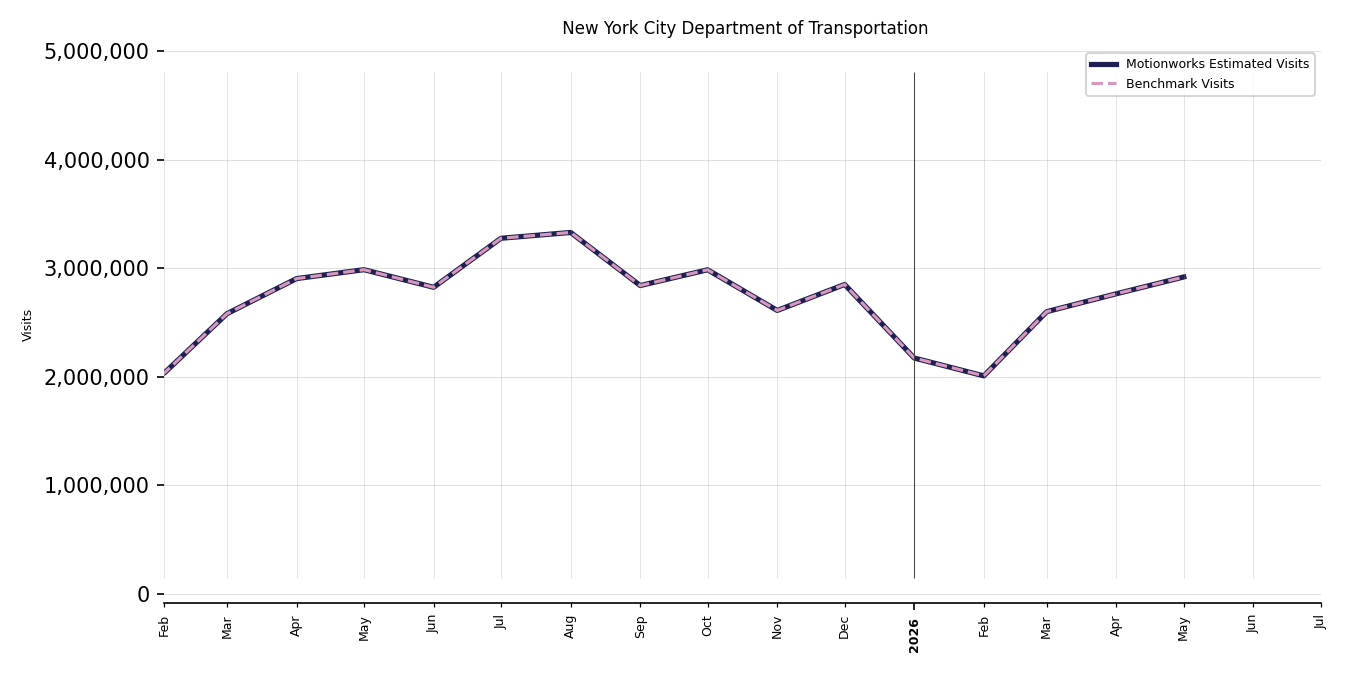
| 21 | New York City Department of Transportation | 21/44 | 2,850,704 | 2,850,704 | 0 |
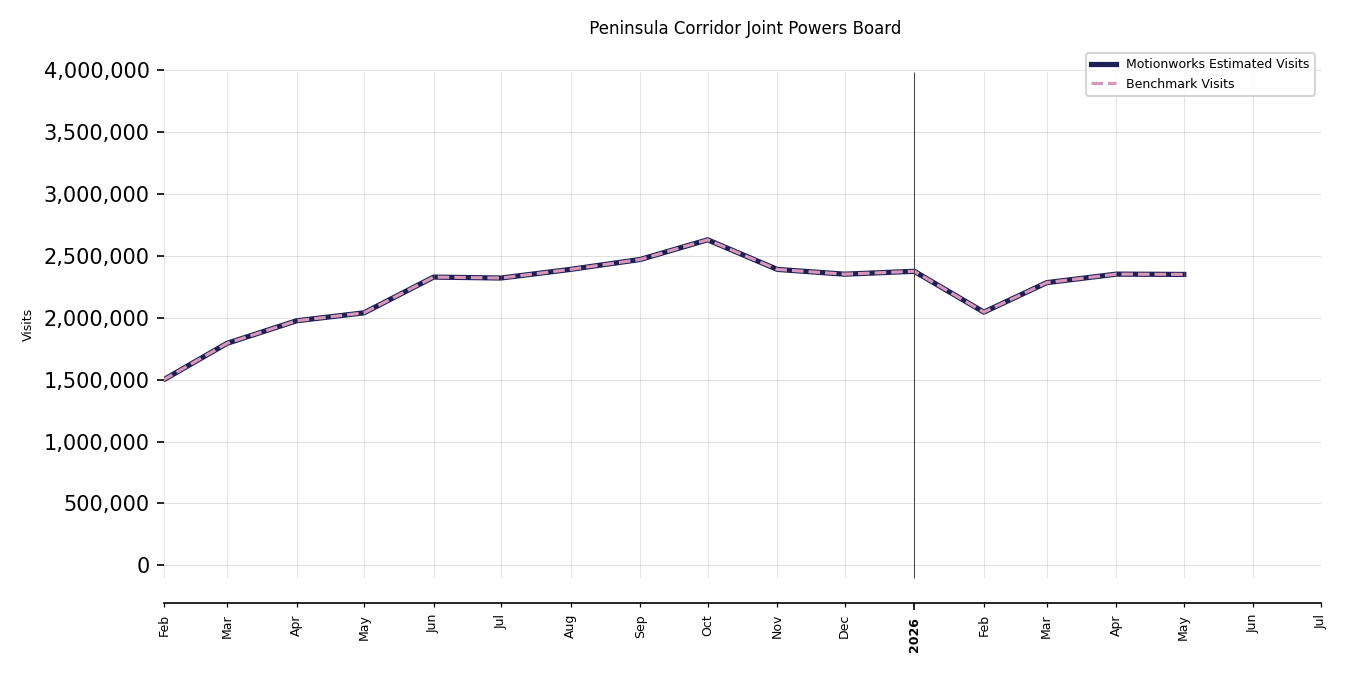
| 22 | Peninsula Corridor Joint Powers Board | 22/44 | 2,352,168 | 2,352,168 | 0 |
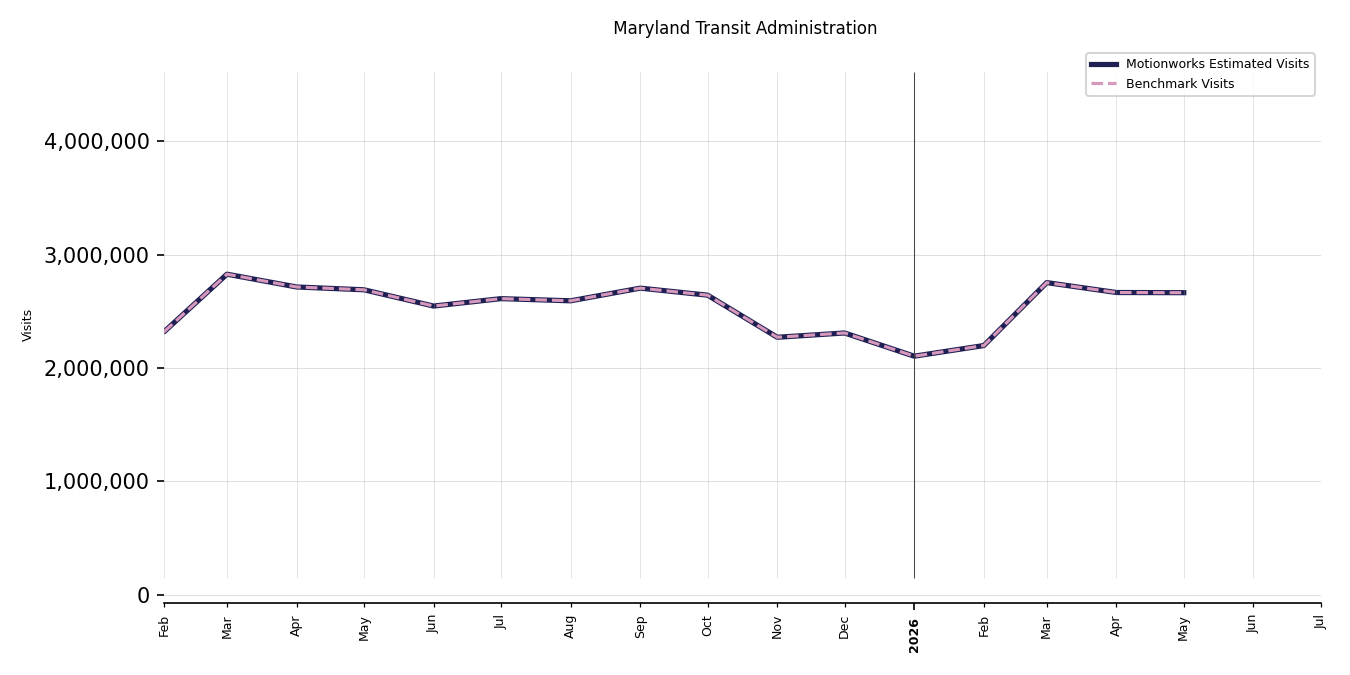
| 23 | Maryland Transit Administration | 23/44 | 2,308,998 | 2,308,998 | 0 |
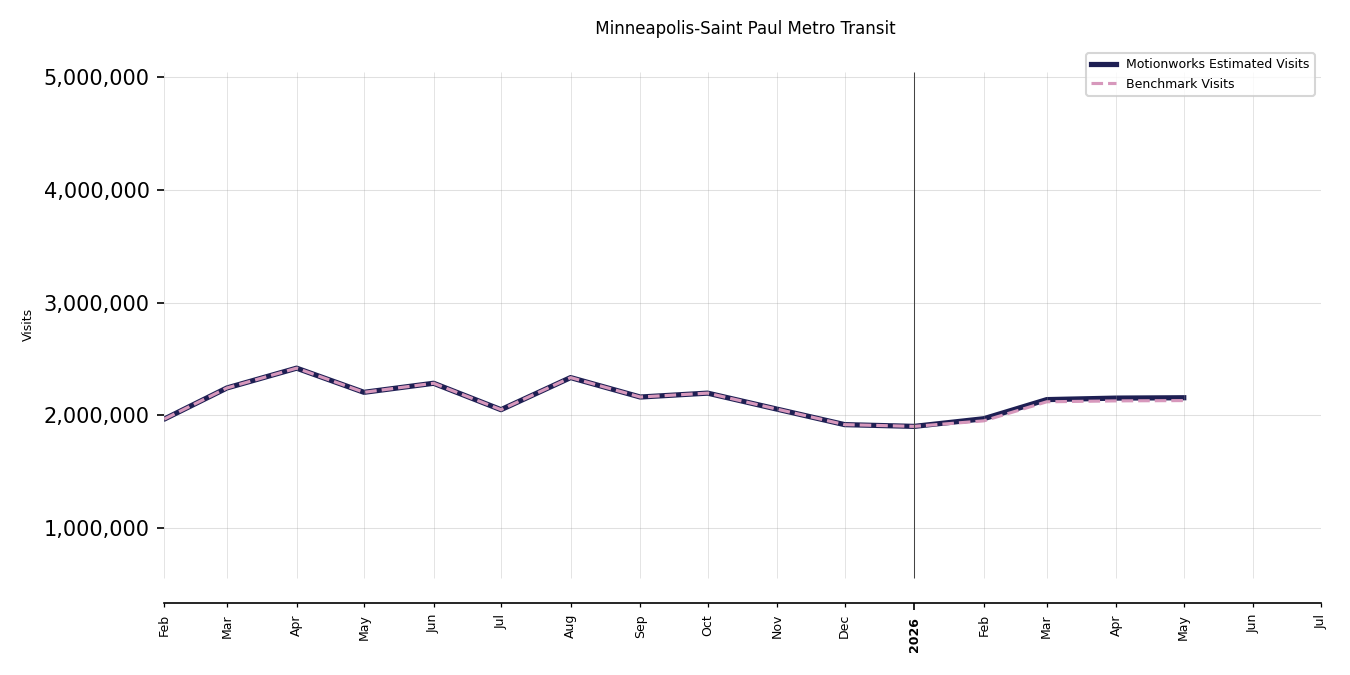
| 24 | Minneapolis-Saint Paul Metro Transit | 24/44 | 1,917,518 | 1,917,518 | 0 |
| 25 | Bi-State Development Agency of the Missouri-Illinois Metropolitan District | 25/44 | 1,138,514 | 1,138,514 | 0 |
* Benchmark Station Visits represent first-party data from transit operators where available; otherwise FTA National Transit Database. Values represent boardings and alightings at a station. Difference Ratio (%) = (Motionworks Estimated Station Visits - Benchmark Station Visits) / Benchmark Station Visits x 100.
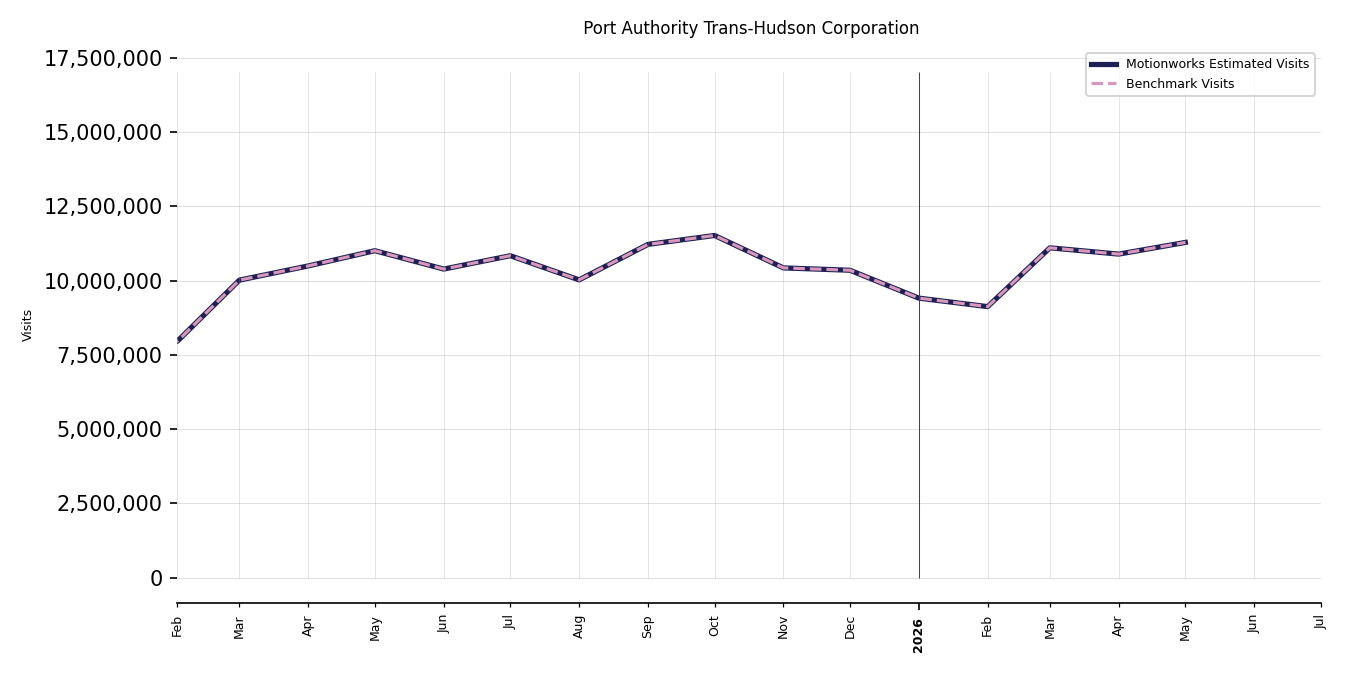
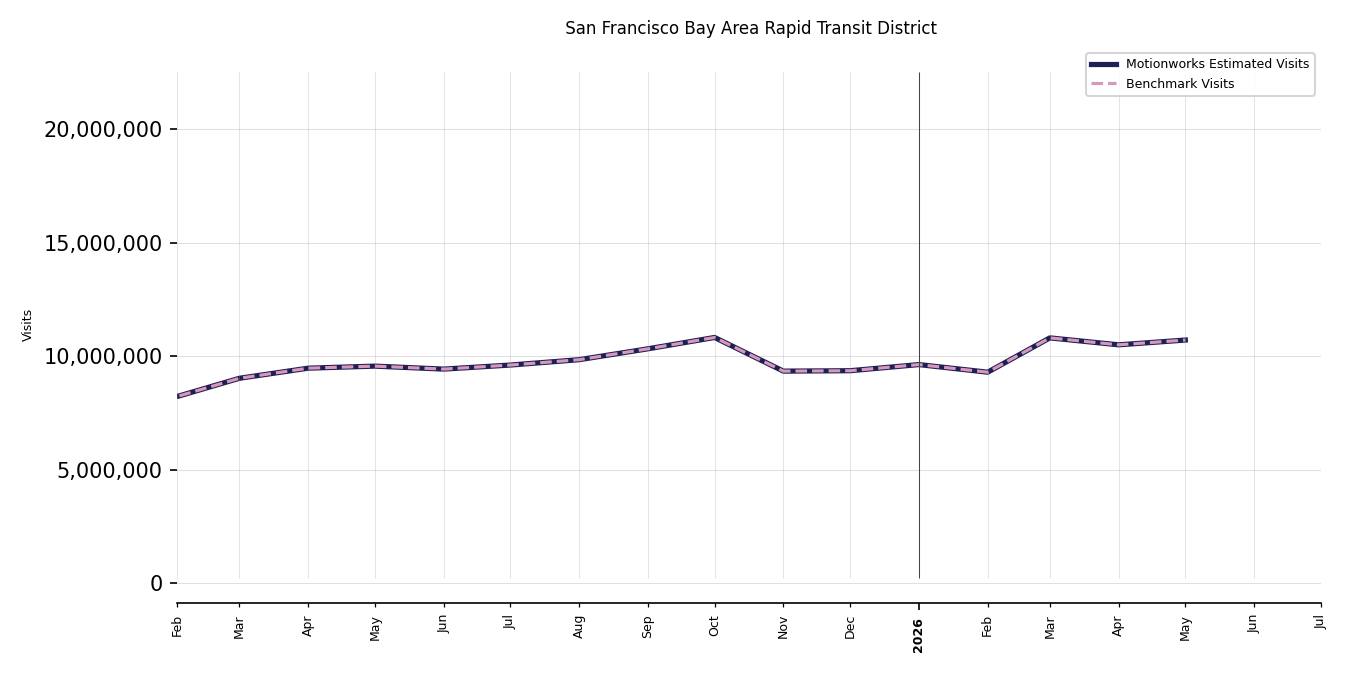
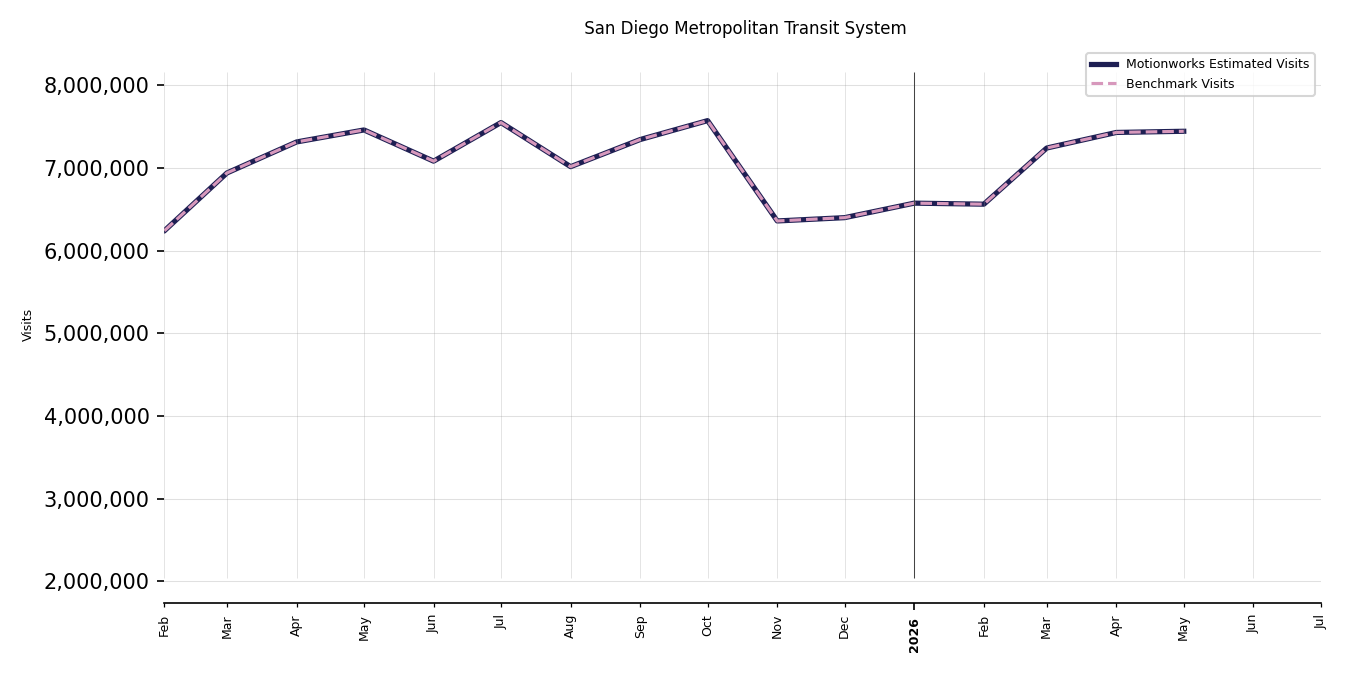
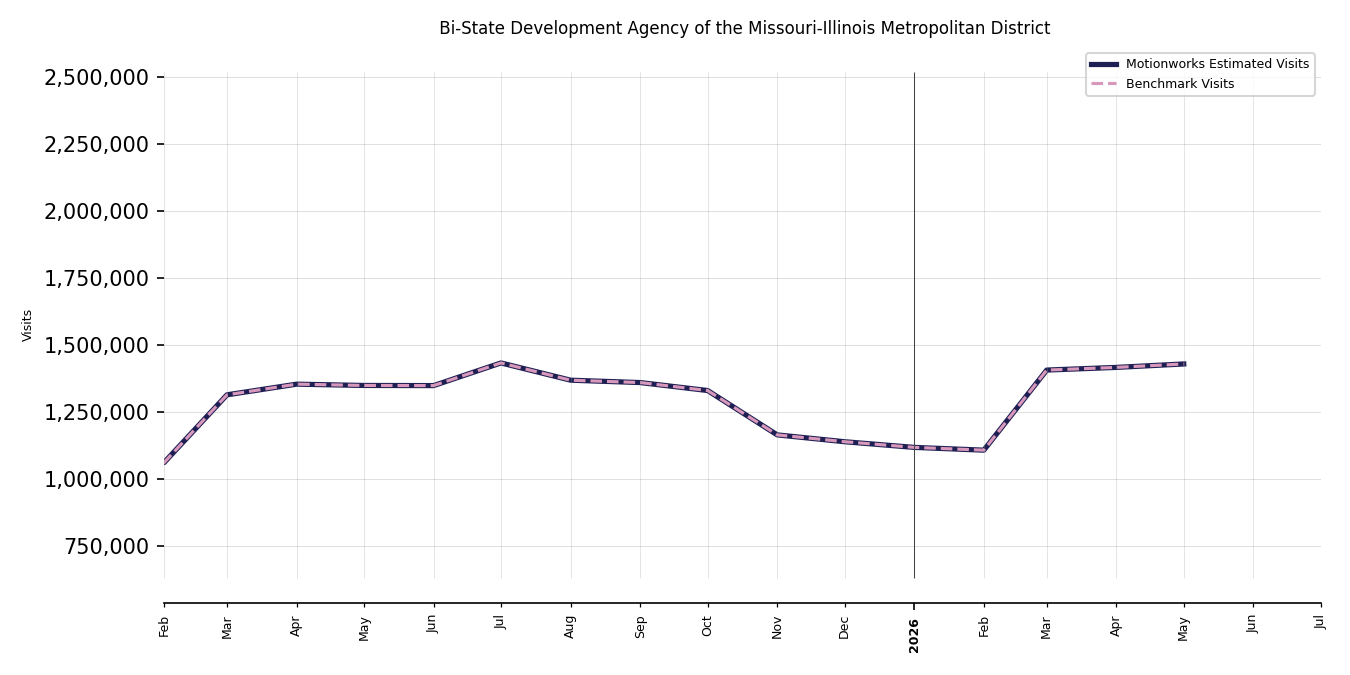
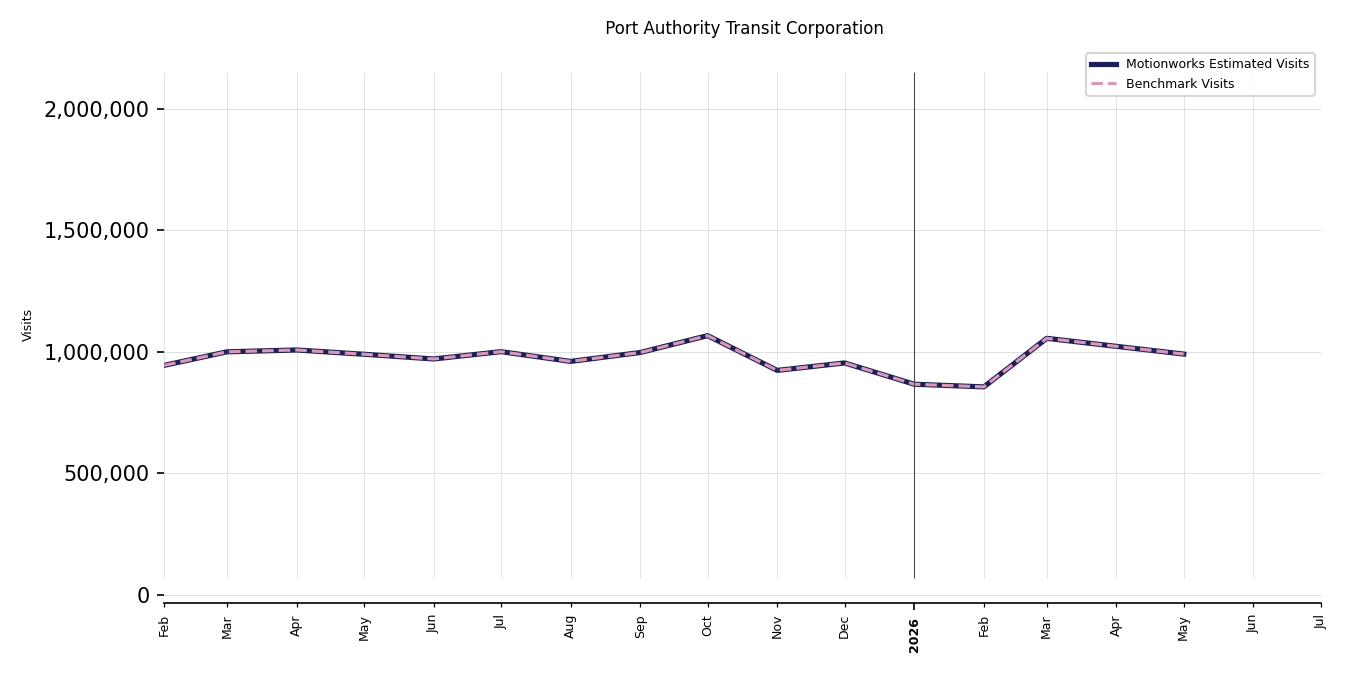
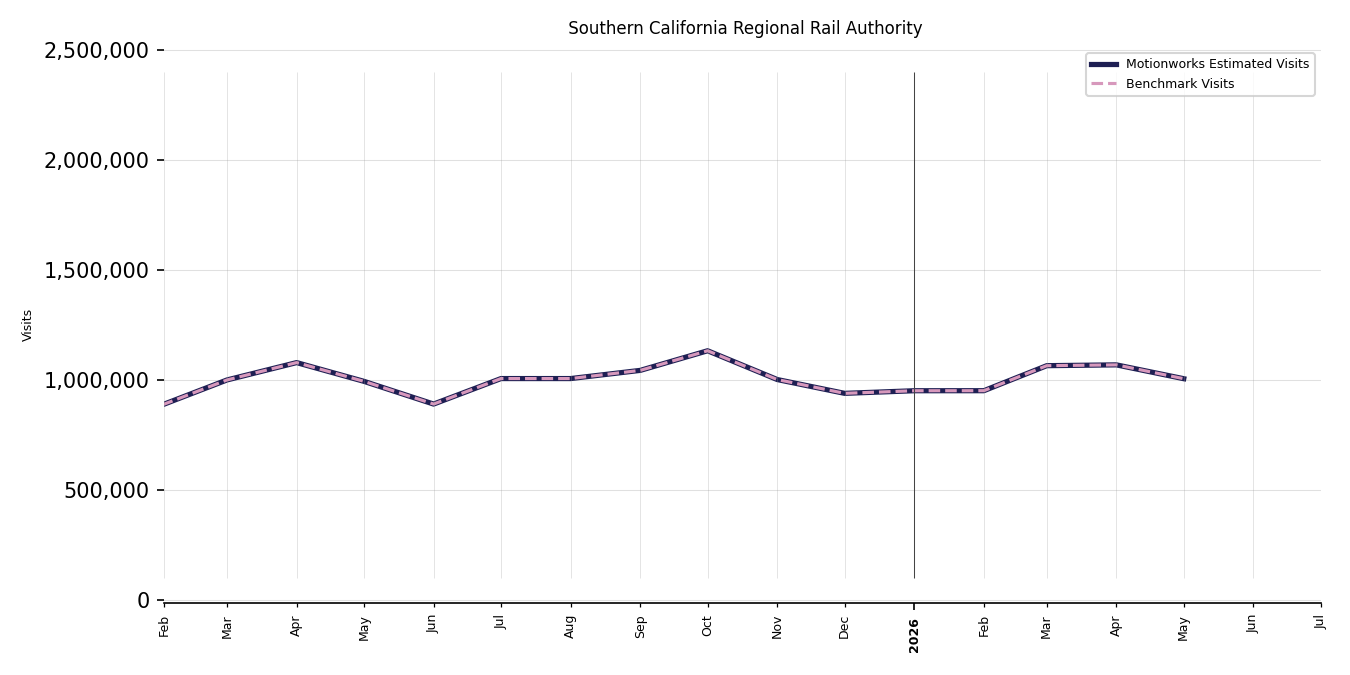
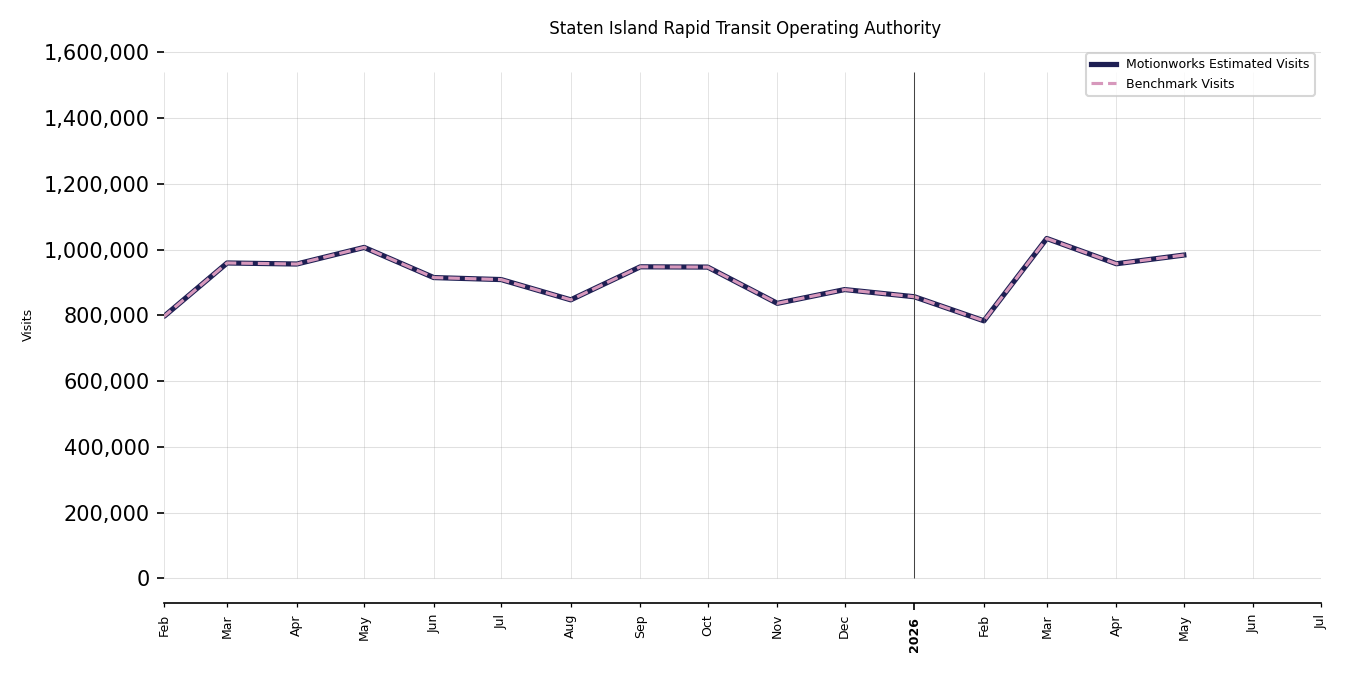
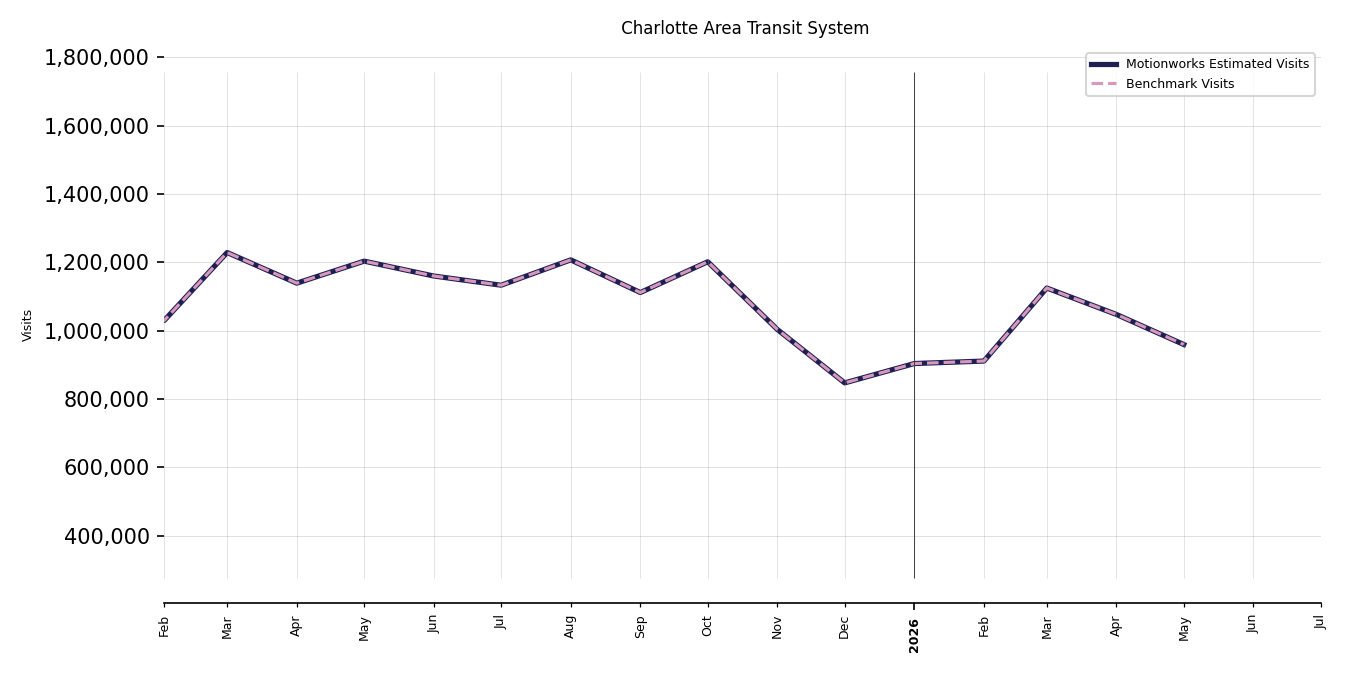
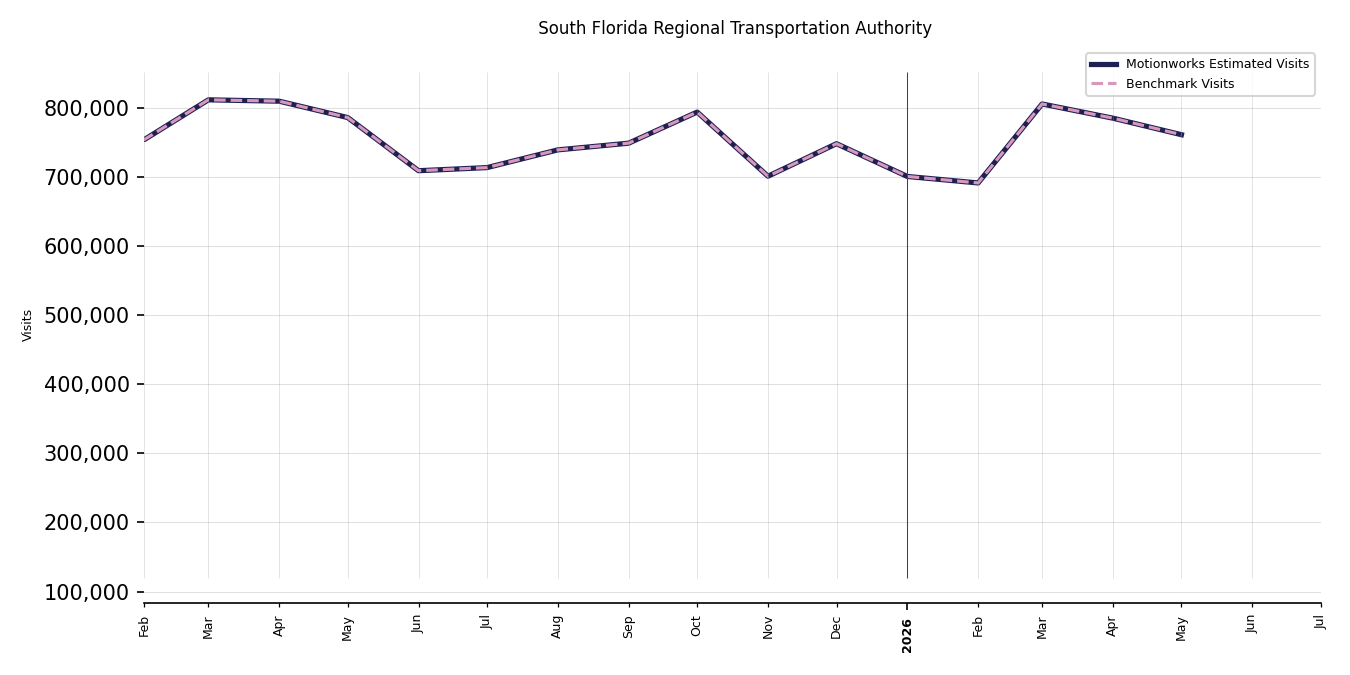
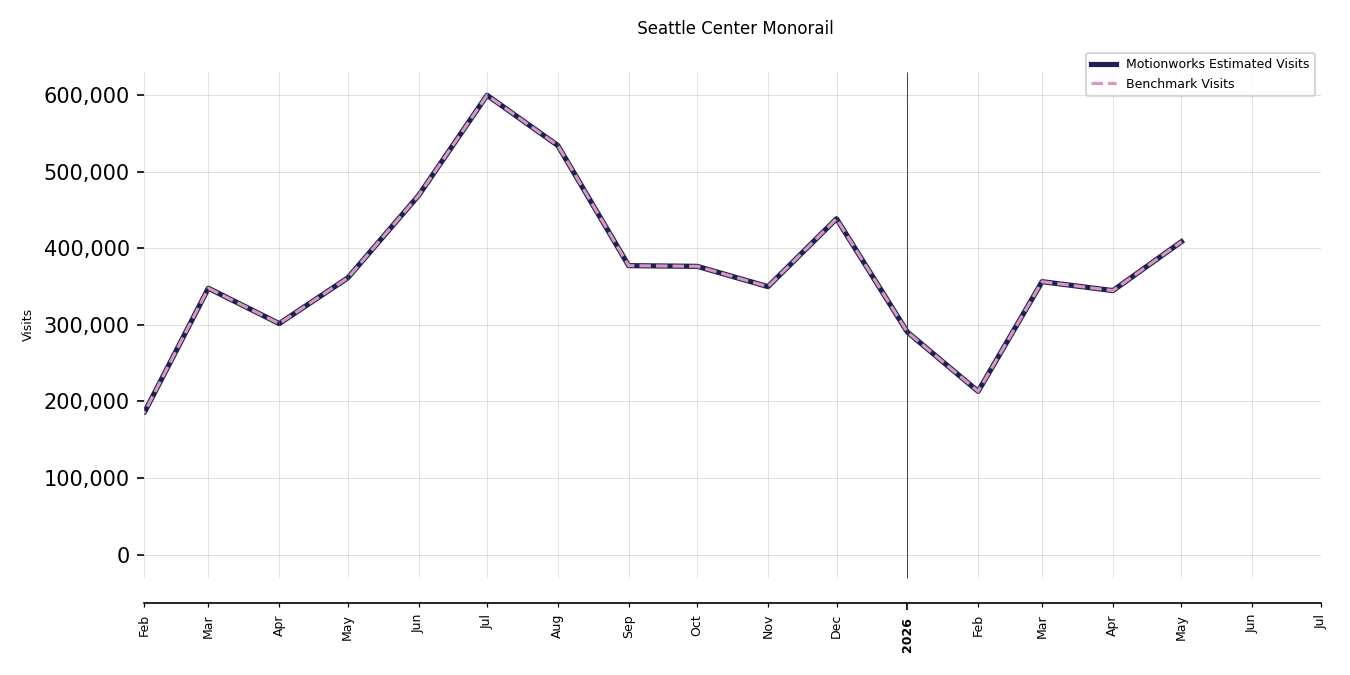
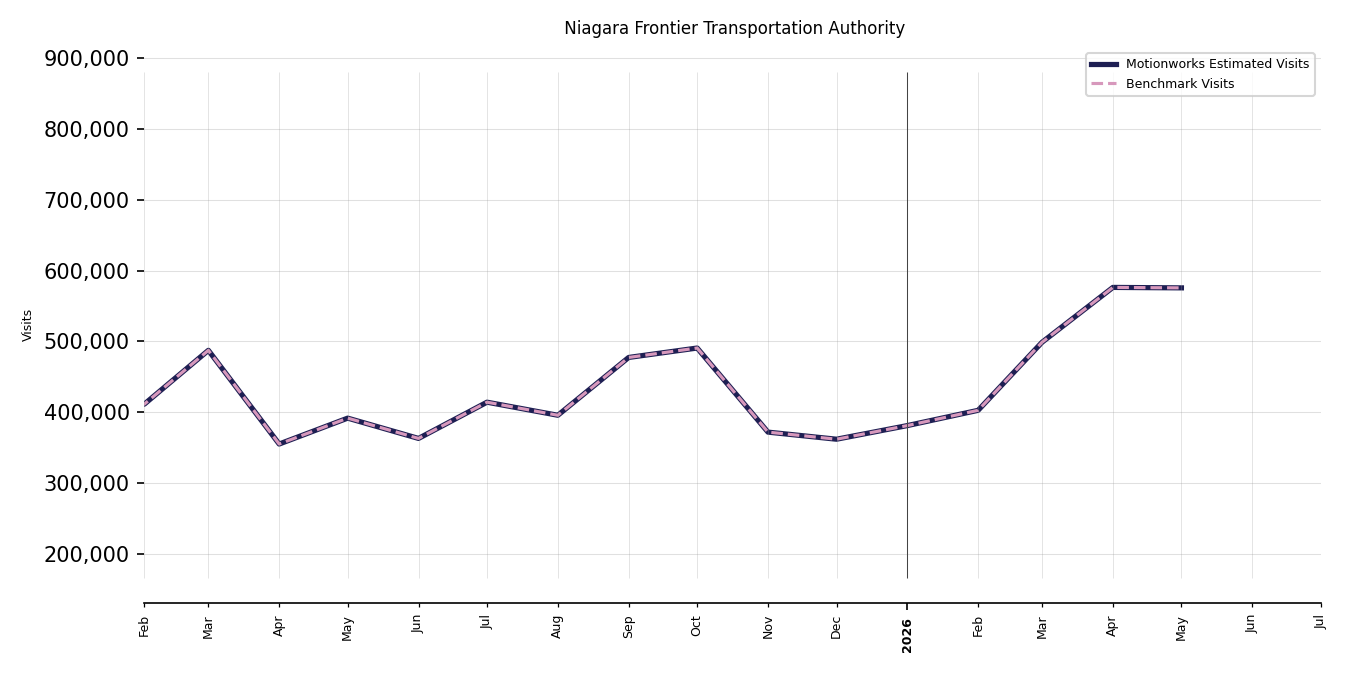
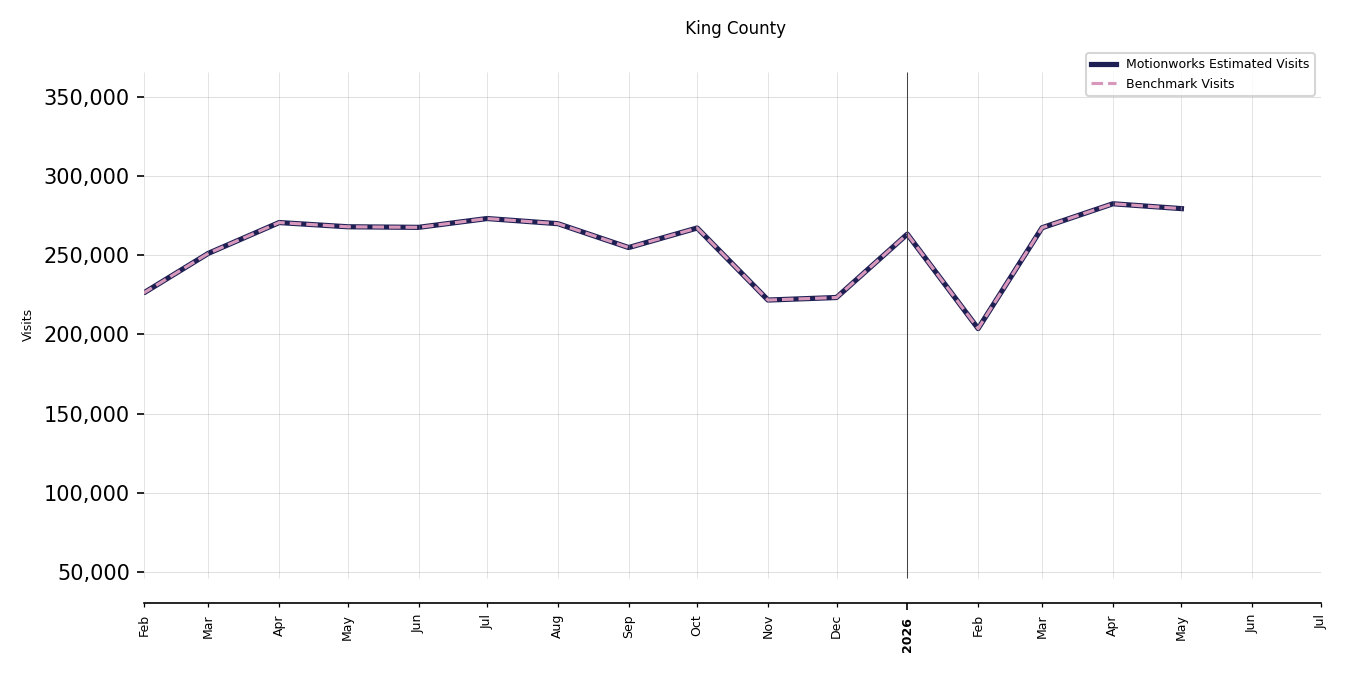
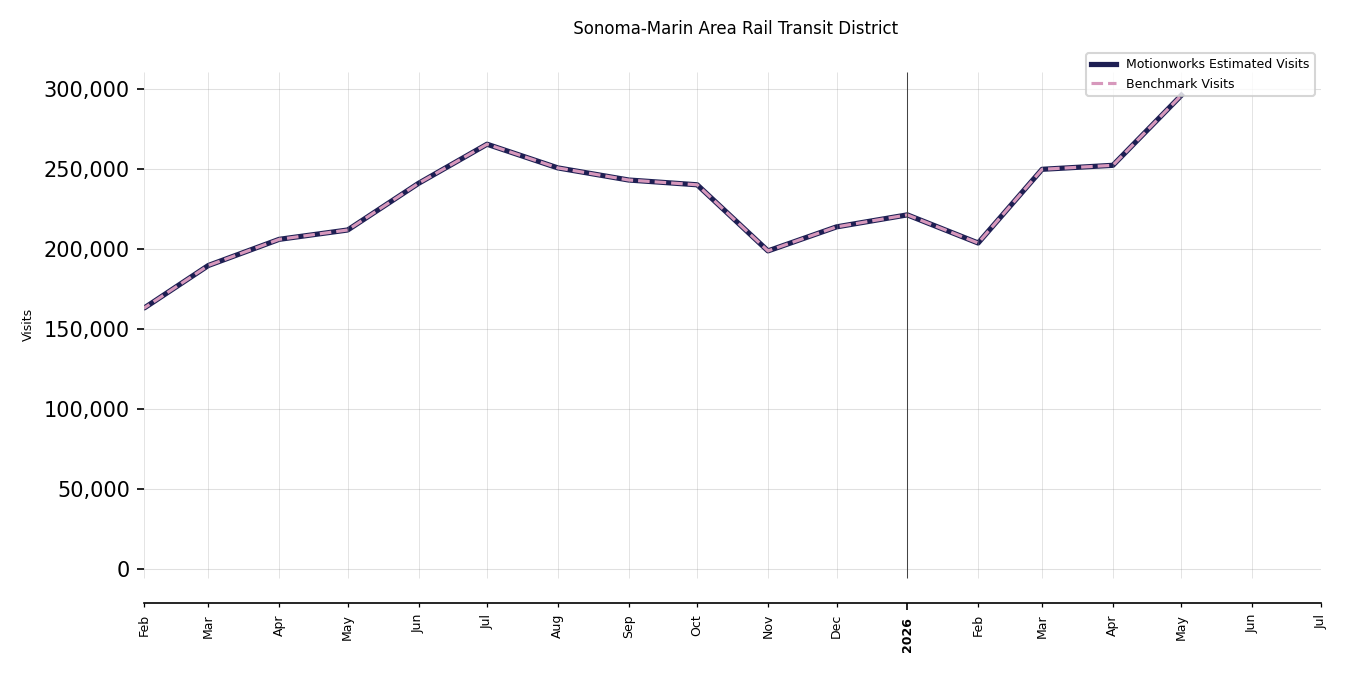
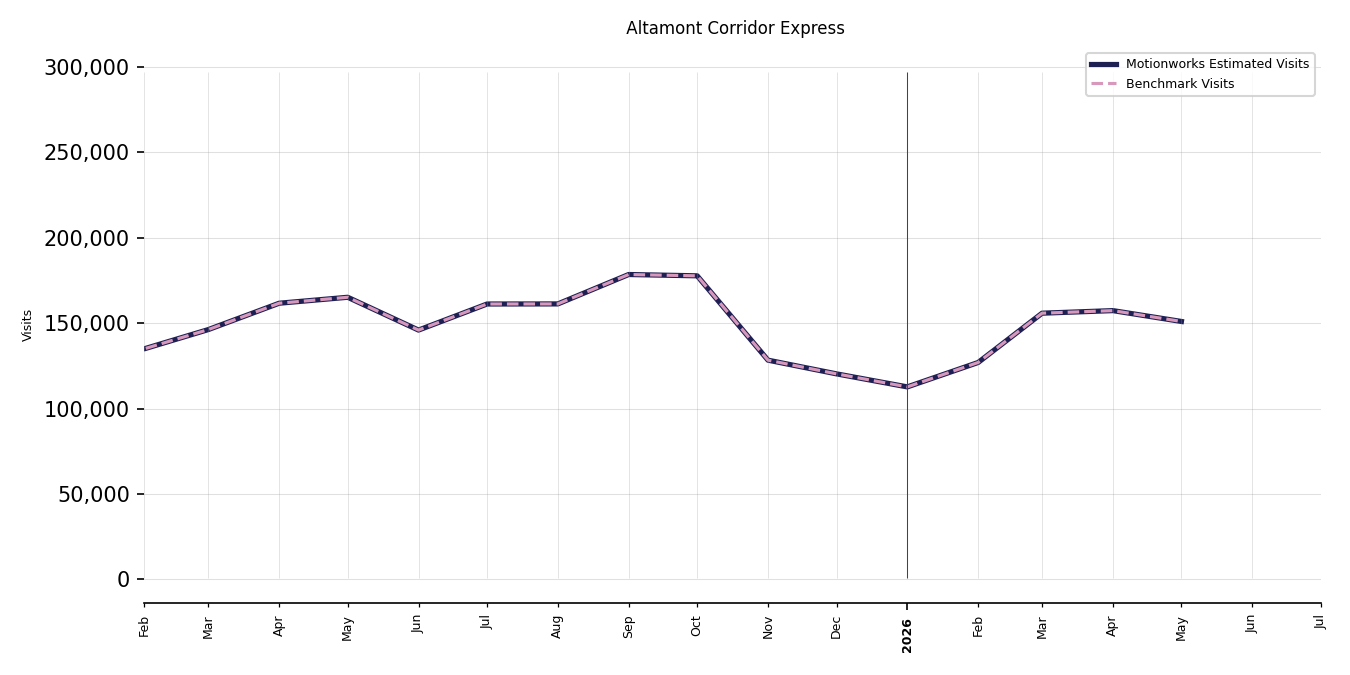
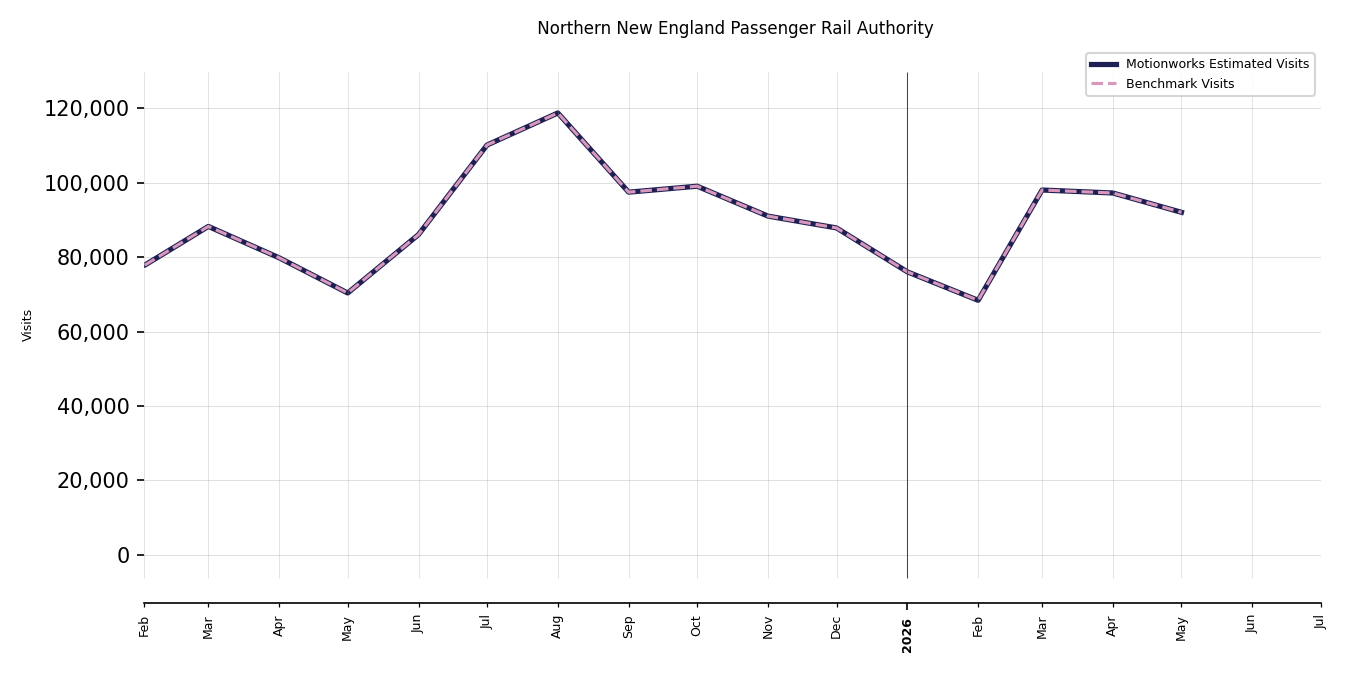
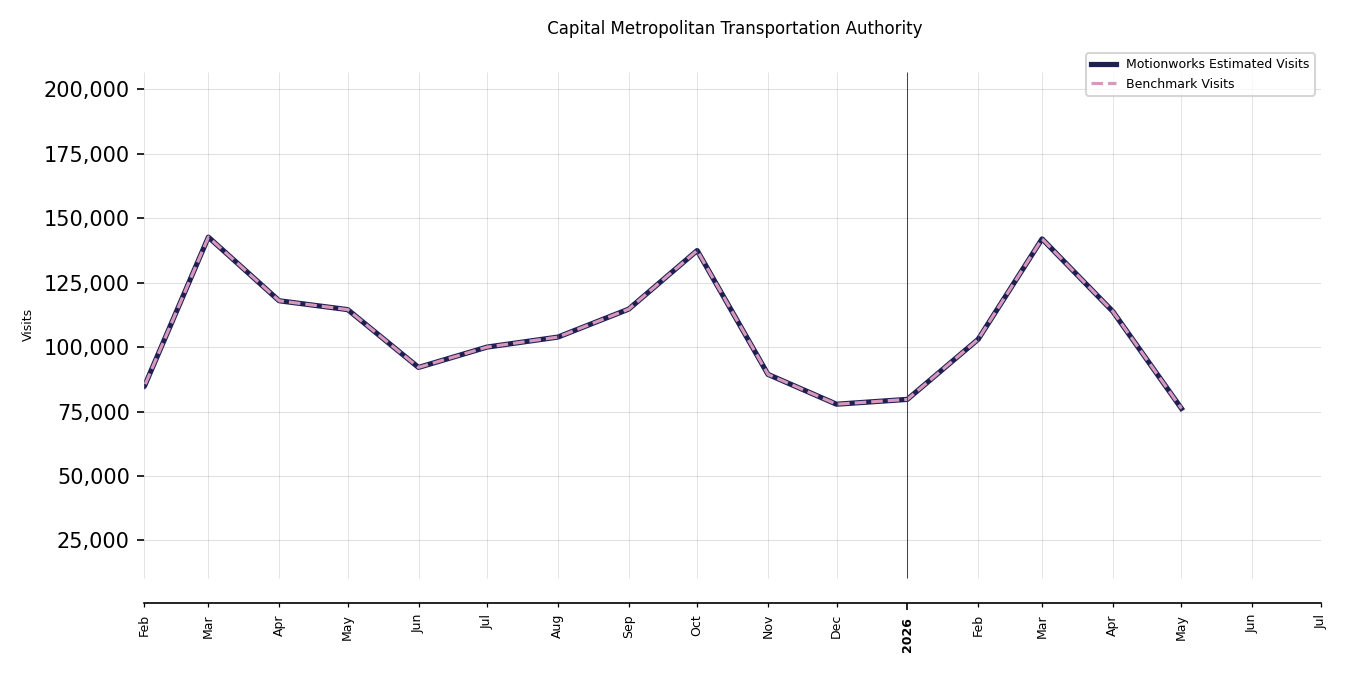
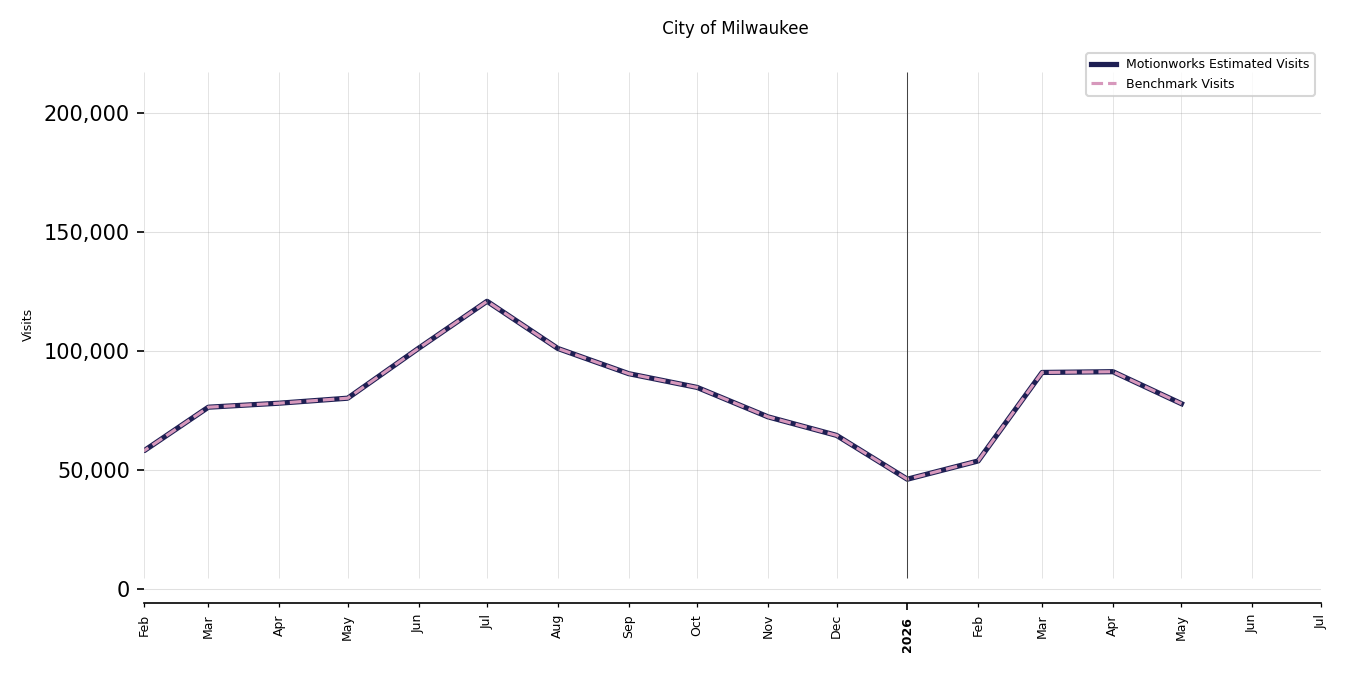
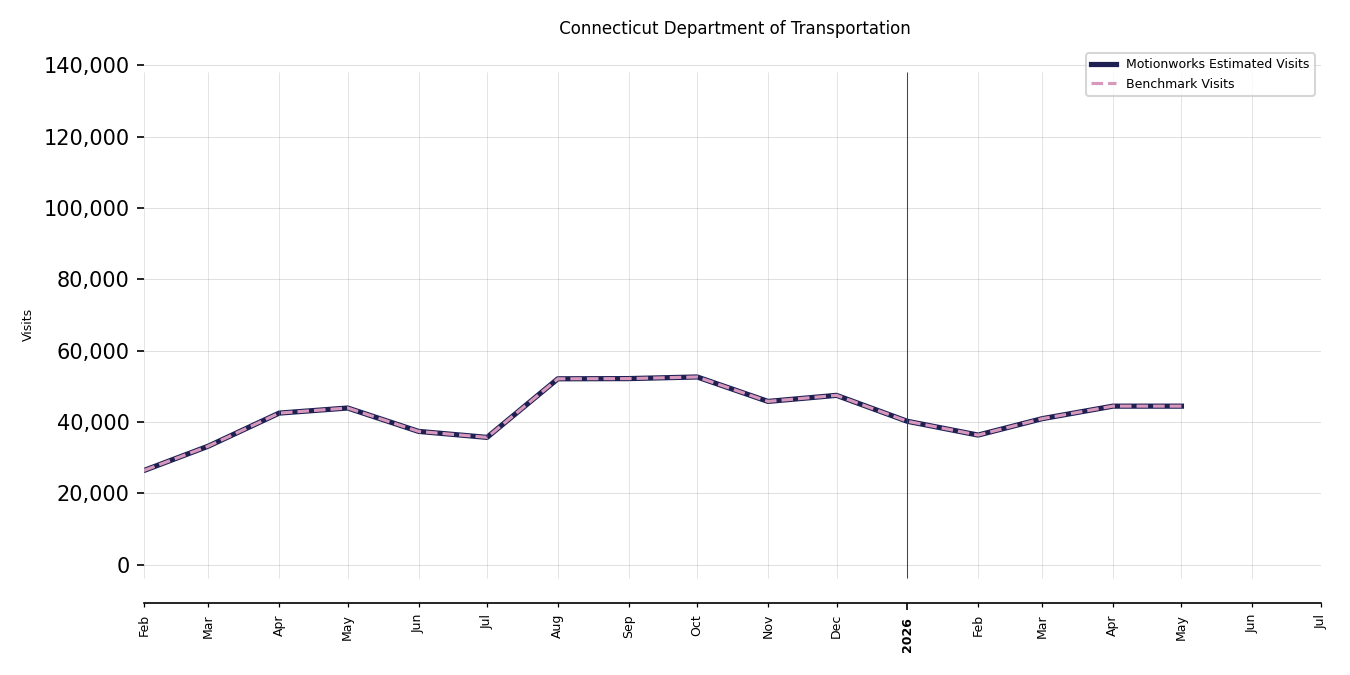
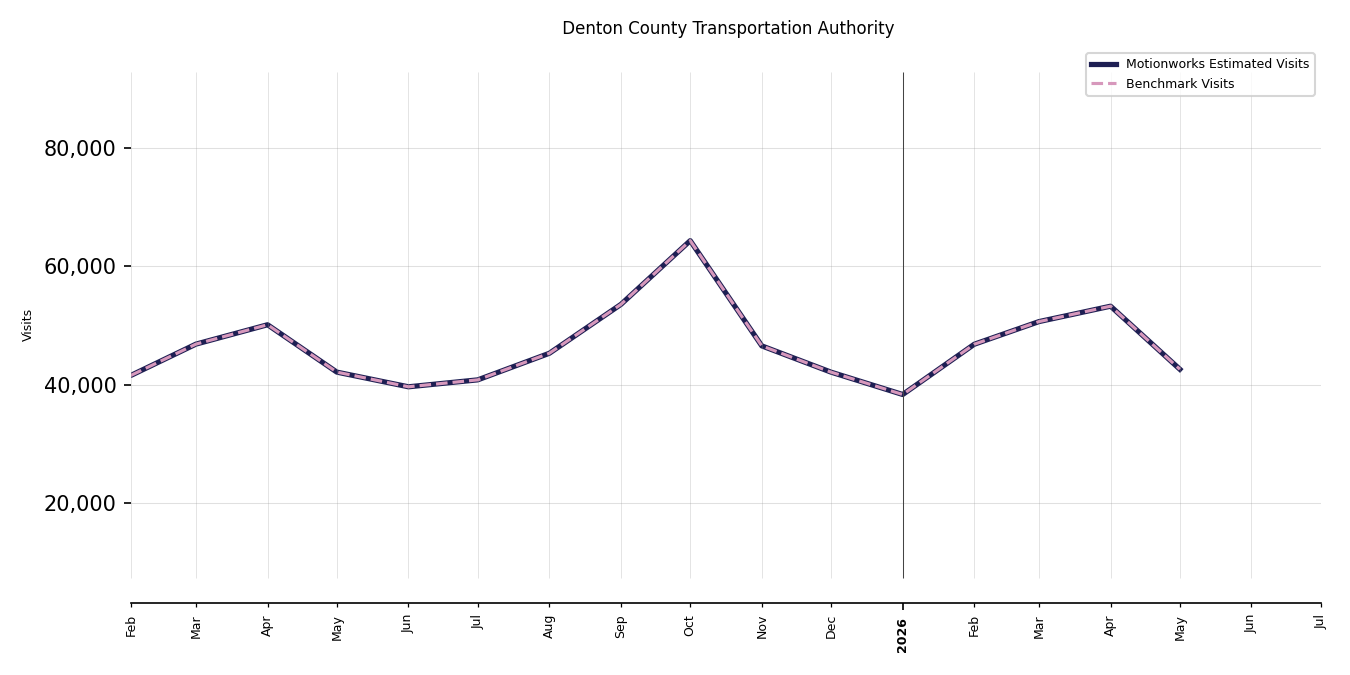
Transit Charts
The charts below show the monthly trend of Motionworks estimated visits compared to benchmark ridership data for each transit system. Each chart covers the most recent 18 months of data.
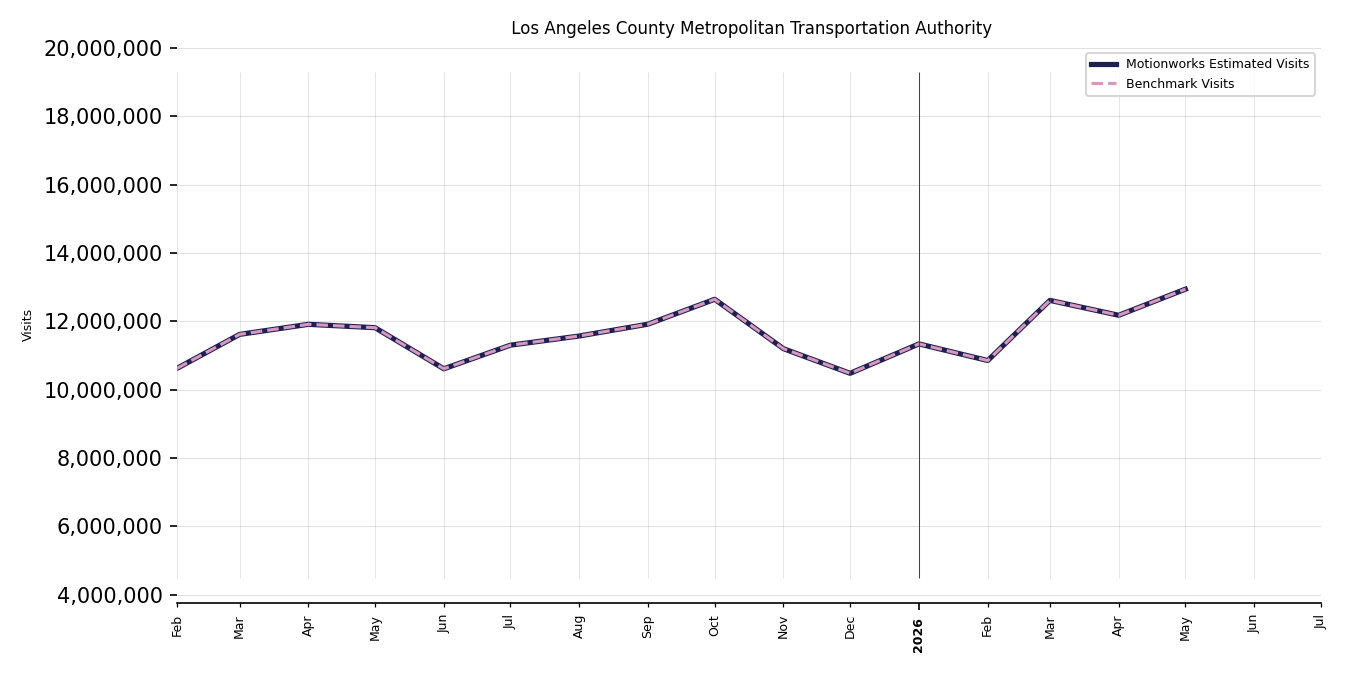
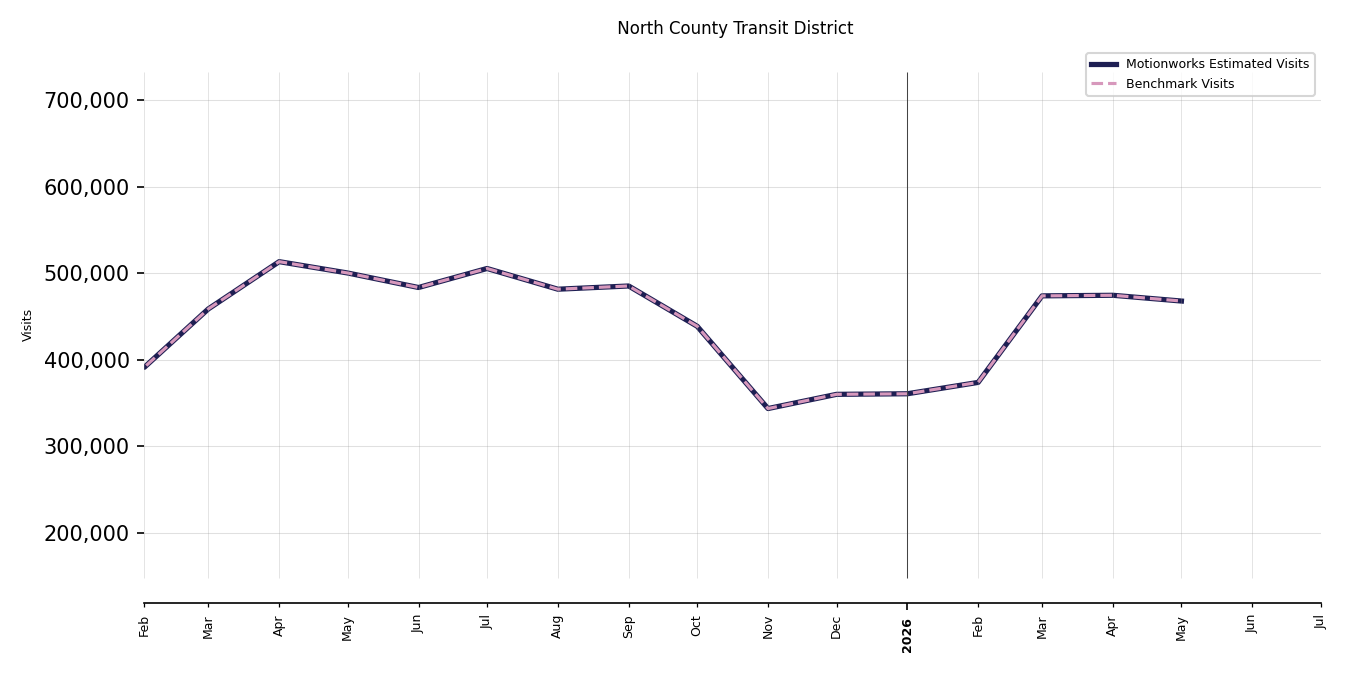
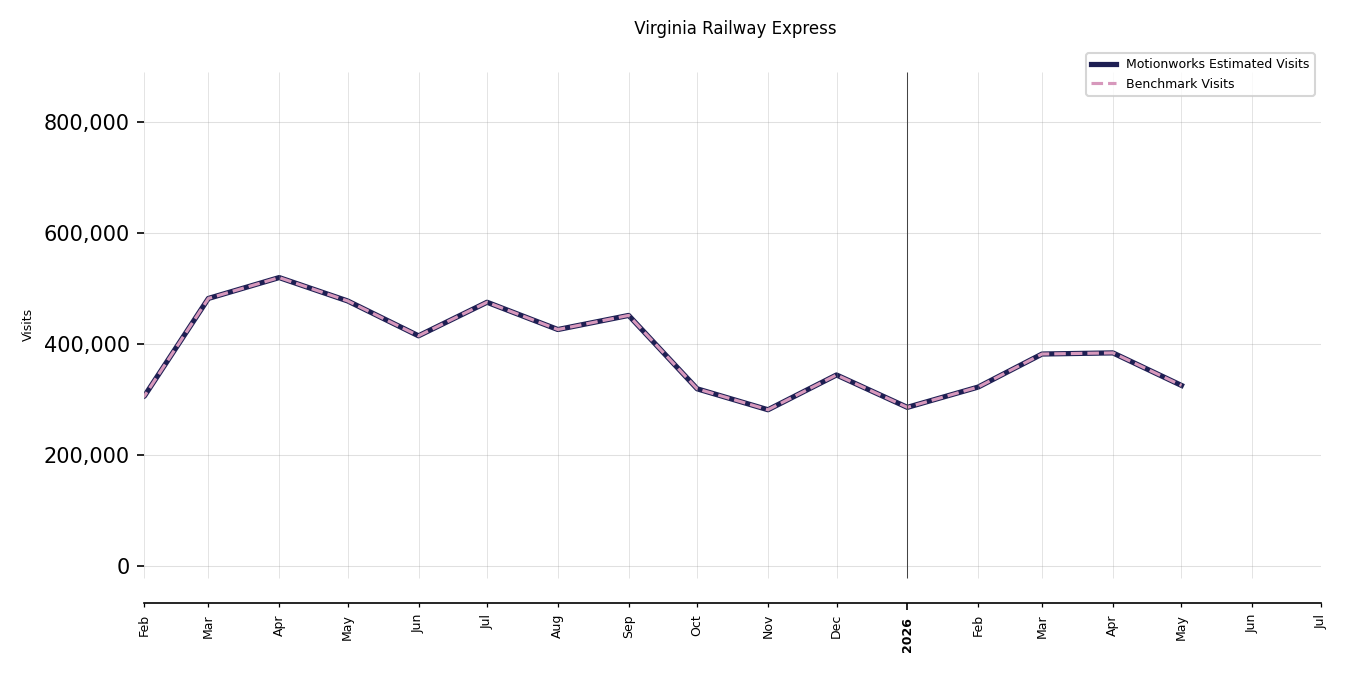
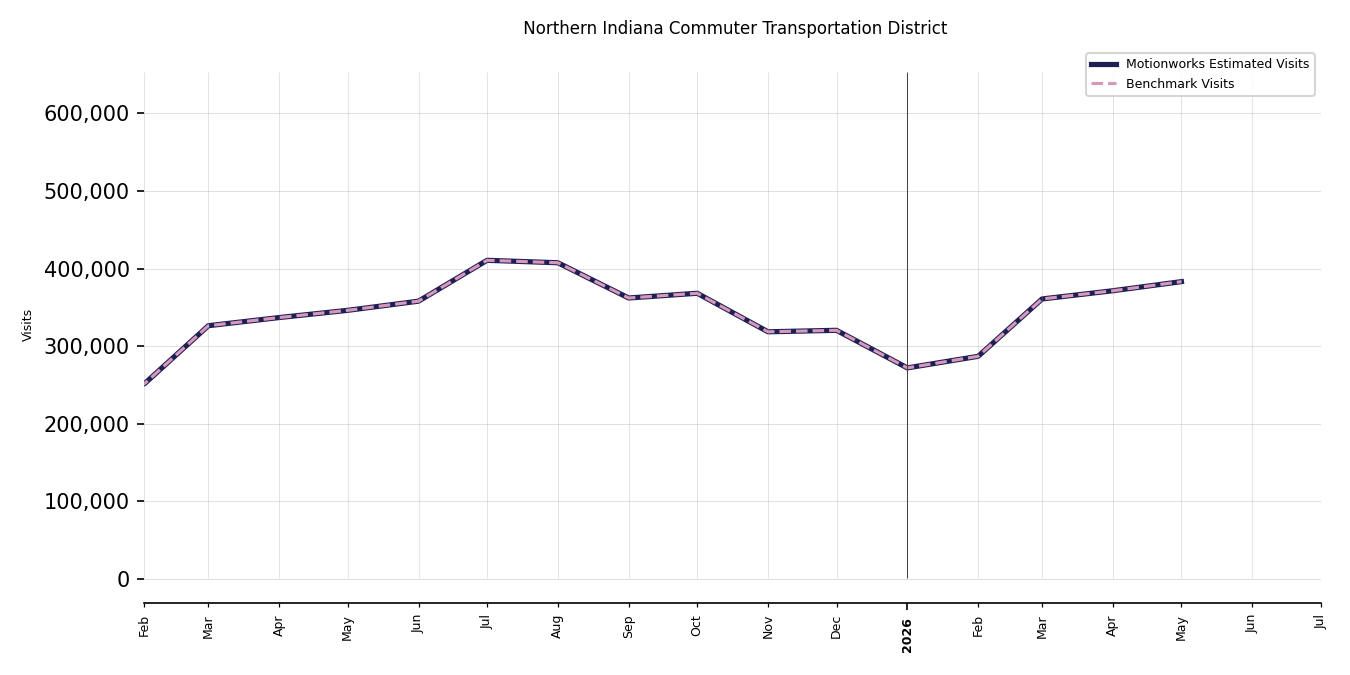
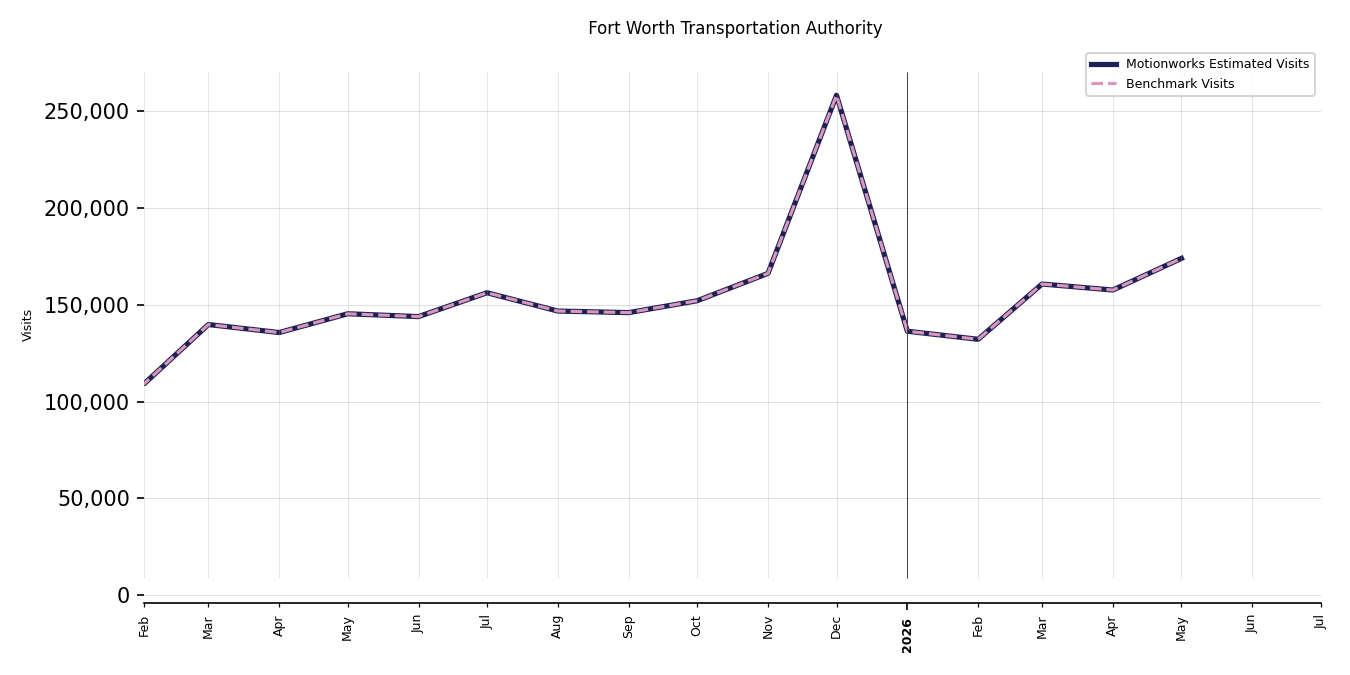
Updated 7 days ago