
Activity Pattern Curation
Activity-pattern itineraries that describe where individuals are likely to be by using common locations, travel patterns, and schedules over the monthly release lookback window.
The most balanced representative devices are selected during the Curation of the Panel.
The next step in the process is to curate an “activity pattern” for every device in our panel. This produces an expectation for where an individual will likely be, using common locations, travel patterns, and schedules over the lookback window.
Historical Analysis
Motionworks compiles the activity data from the Data Cleansing process within a lookback window of the last 8-12 weeks. This data, when aggregated, provide a sparse but intuitive understanding of the probability that a specific device may be at one of its common locations. In the example below, it is easy to see that at 3 pm on a Monday afternoon, the individual is likely at a work location (shown in orange below).
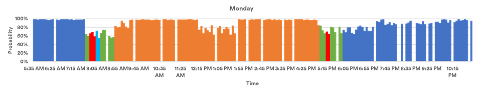
Figure 1. Sample Travel Probabilities
Identifying Home and Work Locations
Using the common location historical analysis shown above, home neighborhoods and work locations are identified. As stated, Motionworks is committed to respecting the privacy of individuals, so we resolve the devices in our panels to the neighborhood in which they reside rather than any individual homes.
Observed Itineraries
Motionworks uses data science techniques to produce accurate observed itineraries for a panel of millions of devices. For each monthly release, Motionworks uses available observations to refine activity patterns and identify events, such as long-distance travel or systematic schedule changes, that should be reflected in population-level estimates.
Below is a simple illustration of how the Motionworks panelists demonstrate behavioral travel patterns that get integrated into our data products. The two maps show the total person-miles traveled per capita from our Basecast™ by Day product on two subsequent Mondays in 2021.
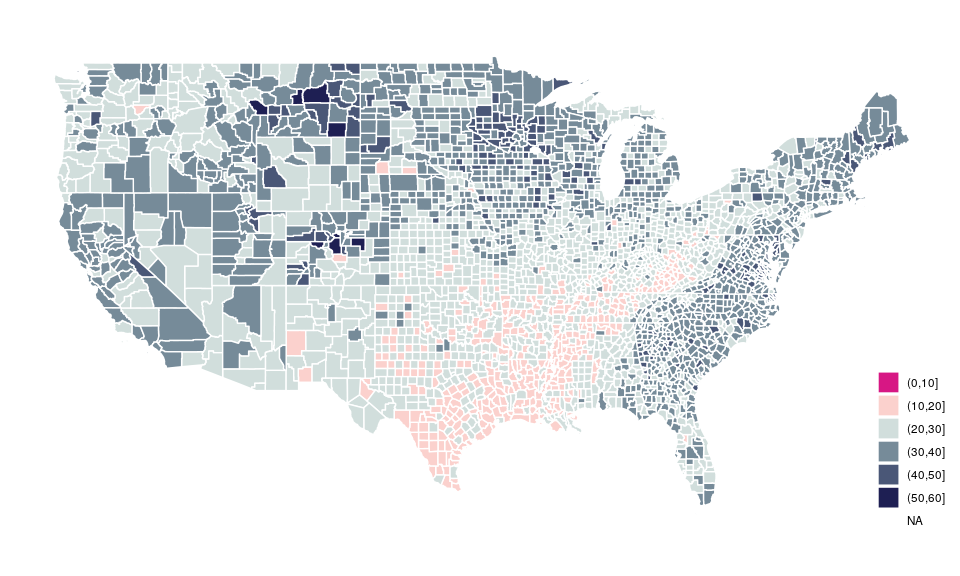
Figure 2. Motionworks person-miles traveled per capita on 15 February 2021.
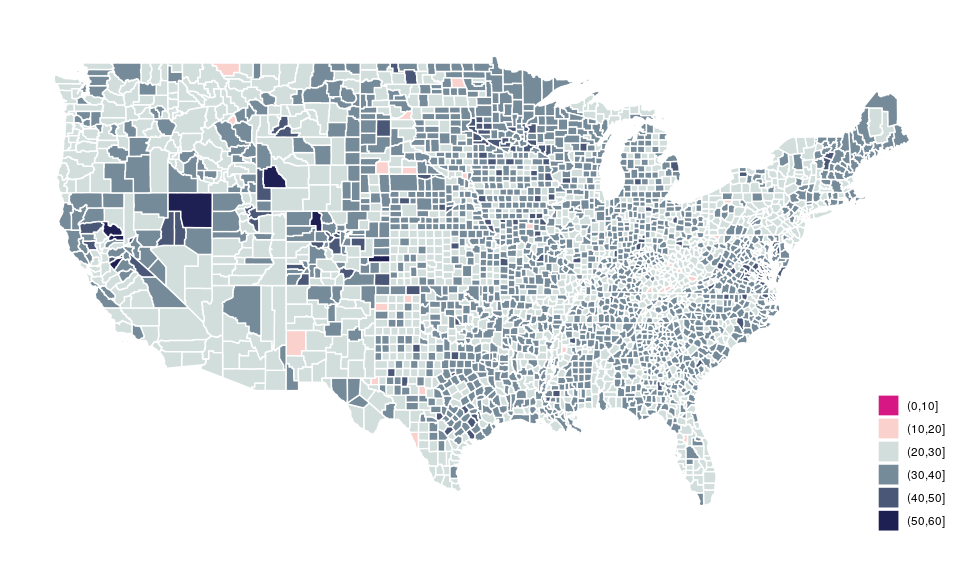
Figure 3. Motionworks person-miles traveled per capita on 22 February 2021.
The first map shows suppressed travel in the south-central and central portions of the United States due to hazardous conditions during a nationally-significant snowstorm. The second map shows the rebound in travel across the country the following week after the storm passed.
There are no gaps in the activity schedules; unreliable location data is identified and cleaned. Finally, the observed location data is associated with known places and routed through a multi-modal network, allowing an understanding of the routes taken as part of an individual's daily schedule.
For a geo-demographic cohort, the benefit of having a complete understanding of the activity schedule allows answers to questions like:
- When are different possible routes through the transportation network preferred, and how is public transport used? Do they take the train to commute, but if they go shopping, they prefer to drive?
- How frequently are they visiting the same locations or passing the same sections of roadway?
- Do they prefer to shop near home or work?
- What's the probability of going out in the evening? Do they go home before going out or is it part of their return home after work?
- Accurate arrival and departure times from specific places are understood by considering the time series of location observations and expectations before and after visiting a place.
Updated about 1 month ago