
2021 Motionworks Canada Popcast™ Digital Pop Validation
Introduction
When marketing a product or service, it is helpful to look at the demographics of a geographic area. For example, one might be curious about the relationship between family size and household income in Downtown Vancouver to either market a luxury vehicle or locate a new preschool. Traditionally, this involves either performing a survey or finding an existing source that has predefined cross-tabulations and set variable categories (e.g. Statistics Canada). Either way, data acquisition is time and cost inefficient. With traditional surveying, there are also increasing non-response biases.
A digital population, also called a "synthetic population", is a virtual representation of a true population that can be used to analyze an audience. Put succinctly, a digital population is a simplified, microscopic representation of an actual population. It is simplified in the sense that it does not contain all possible population attributes---only those part of its design; and it is microscopic, meaning that every person and household is represented individually. That being said, a digital population is not identical to a real population. You will not find an exact virtual copy of yourself, or anyone else, within it. Rather, it is generated in such a way that a virtual person exists that is statistically representative of you, and anyone else in the real population. Because of this, the use of digital populations has the added benefit of protecting individuals’ privacy.
Validation at National Level
Figures in this section show high-level distributions of nationwide households and persons across various features such as age, gender, and household income. Comparisons are presented with the latest available Statistics Canada 2021 Census of the Population and Environics' DemoStats from 2021.
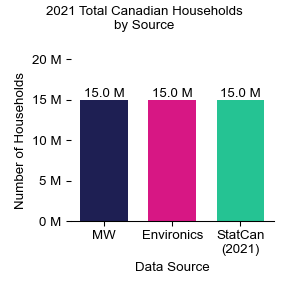
Total Households (National)
The chart below compares total households in the 2021 Motionworks Digital Population (MW), 2021 Environics DemoStats, and Canada 2021 Census of the Population. Total households is the primary control in Motionworks Digital Population. As a result, the Digital Population matches with both the Canadian Census and Environics estimates for total households well.
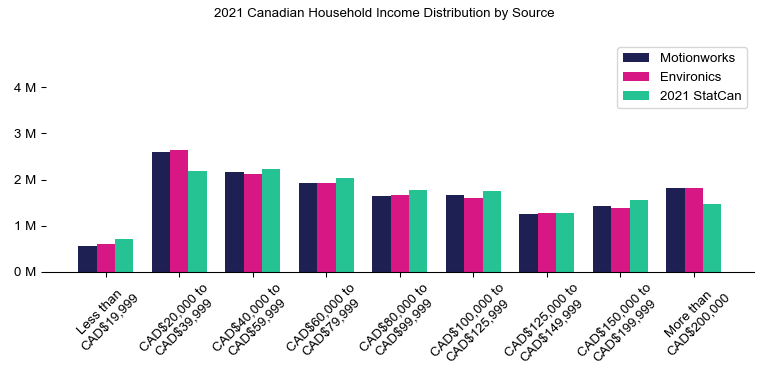
Households By Household Income (National)
Motionworks uses Environics household income estimates for income controls in the Digital Population. The chart below represents the control category bins and the comparison in household counts for the Digital Population, Environics, and Statistics Canada.
The Environics income represents household incomes in 2021 dollars while the Statistics Canada data is reported in 2020 dollars, and represents the most significant reason why Claritas household incomes skew higher than the Canadian Census. Between 2020 and 2021, Claritas is reporting growth in real income and also increases in household income due to inflation. The Statistics Canada and Environics definitions of household income also contain some differences.
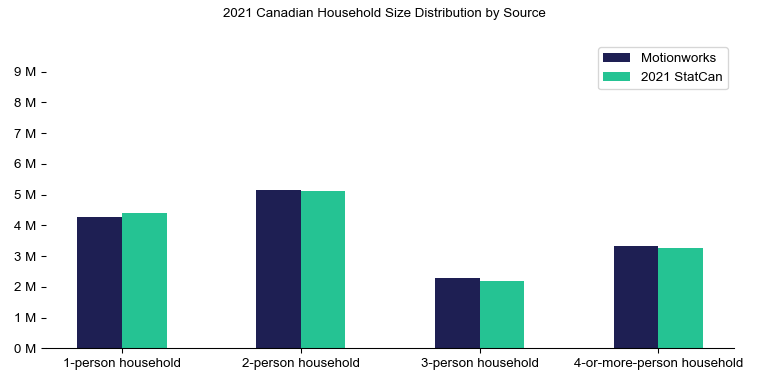
Households by Household Size (National)
The charts below represent Motionwork's 2021 Digital Population compared to the 2021 Statistics Canada Census of the Population. In general, the Digital Population by household size compares well to the Census data. The sampling procedures used in the construction of the Digital Population does create a small skewing toward larger households. This is also seen in total population comparisons as well.
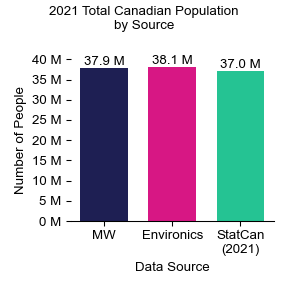
Total Population (National)
The chart below compares total population in Canada between 2021 Motionworks Digital Population (MW), 2021 Environics DemoStats, and 2021 Canadian Census of the Population. The Digital Population is 2.4 percent larger than the Canadian Census, and it is 0.5 percent less than the Environics estimate.
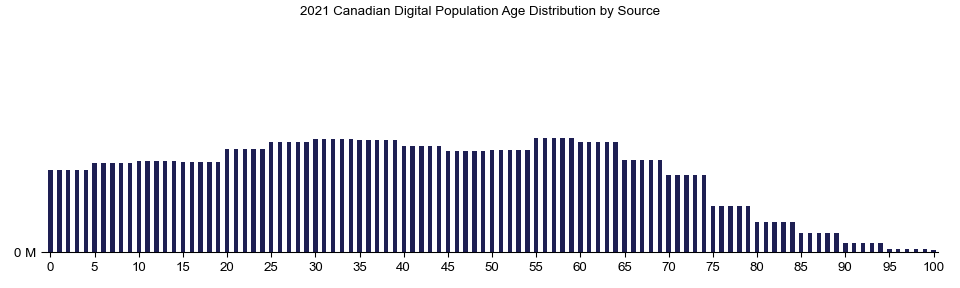
Total Population by Age (National)
The charts below represent Motionwork's 2021 Digital Population age distribution for Canada. This chart is provided in isolation to review any clumps within age groups. Statistics Canada only provides micro data in five year age bins, and Motionworks, in the absence of more detailed information, simply distributes the population evenly over each age in the bin resulting in flat steps in each five year grouping.
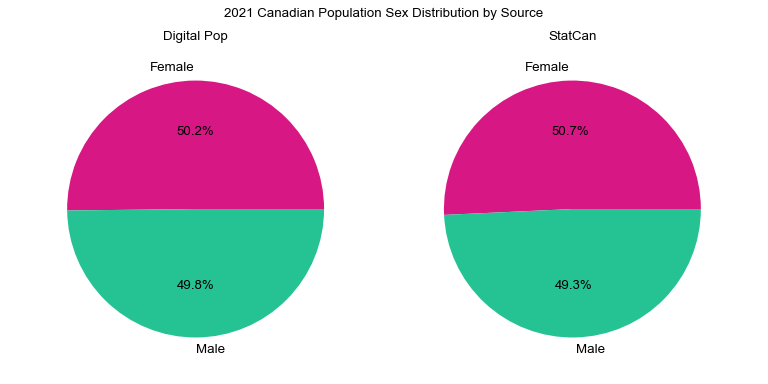
Total Population by Sex (National)
The charts below represent Motionwork's 2021 Digital Population compared to the 2021 Canadian Census of the Population for the total population by sex. The Digital Population by sex compares well to the Census data distribution. At a national level, the Digital Population matches the sex proportions of the latest Census data.
Validation at Neighborhood Level
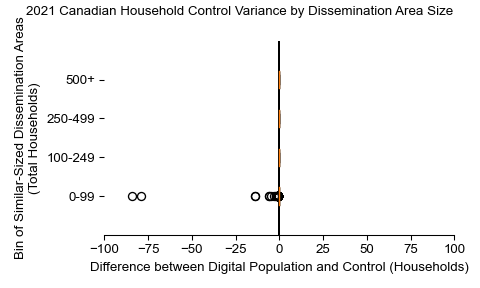
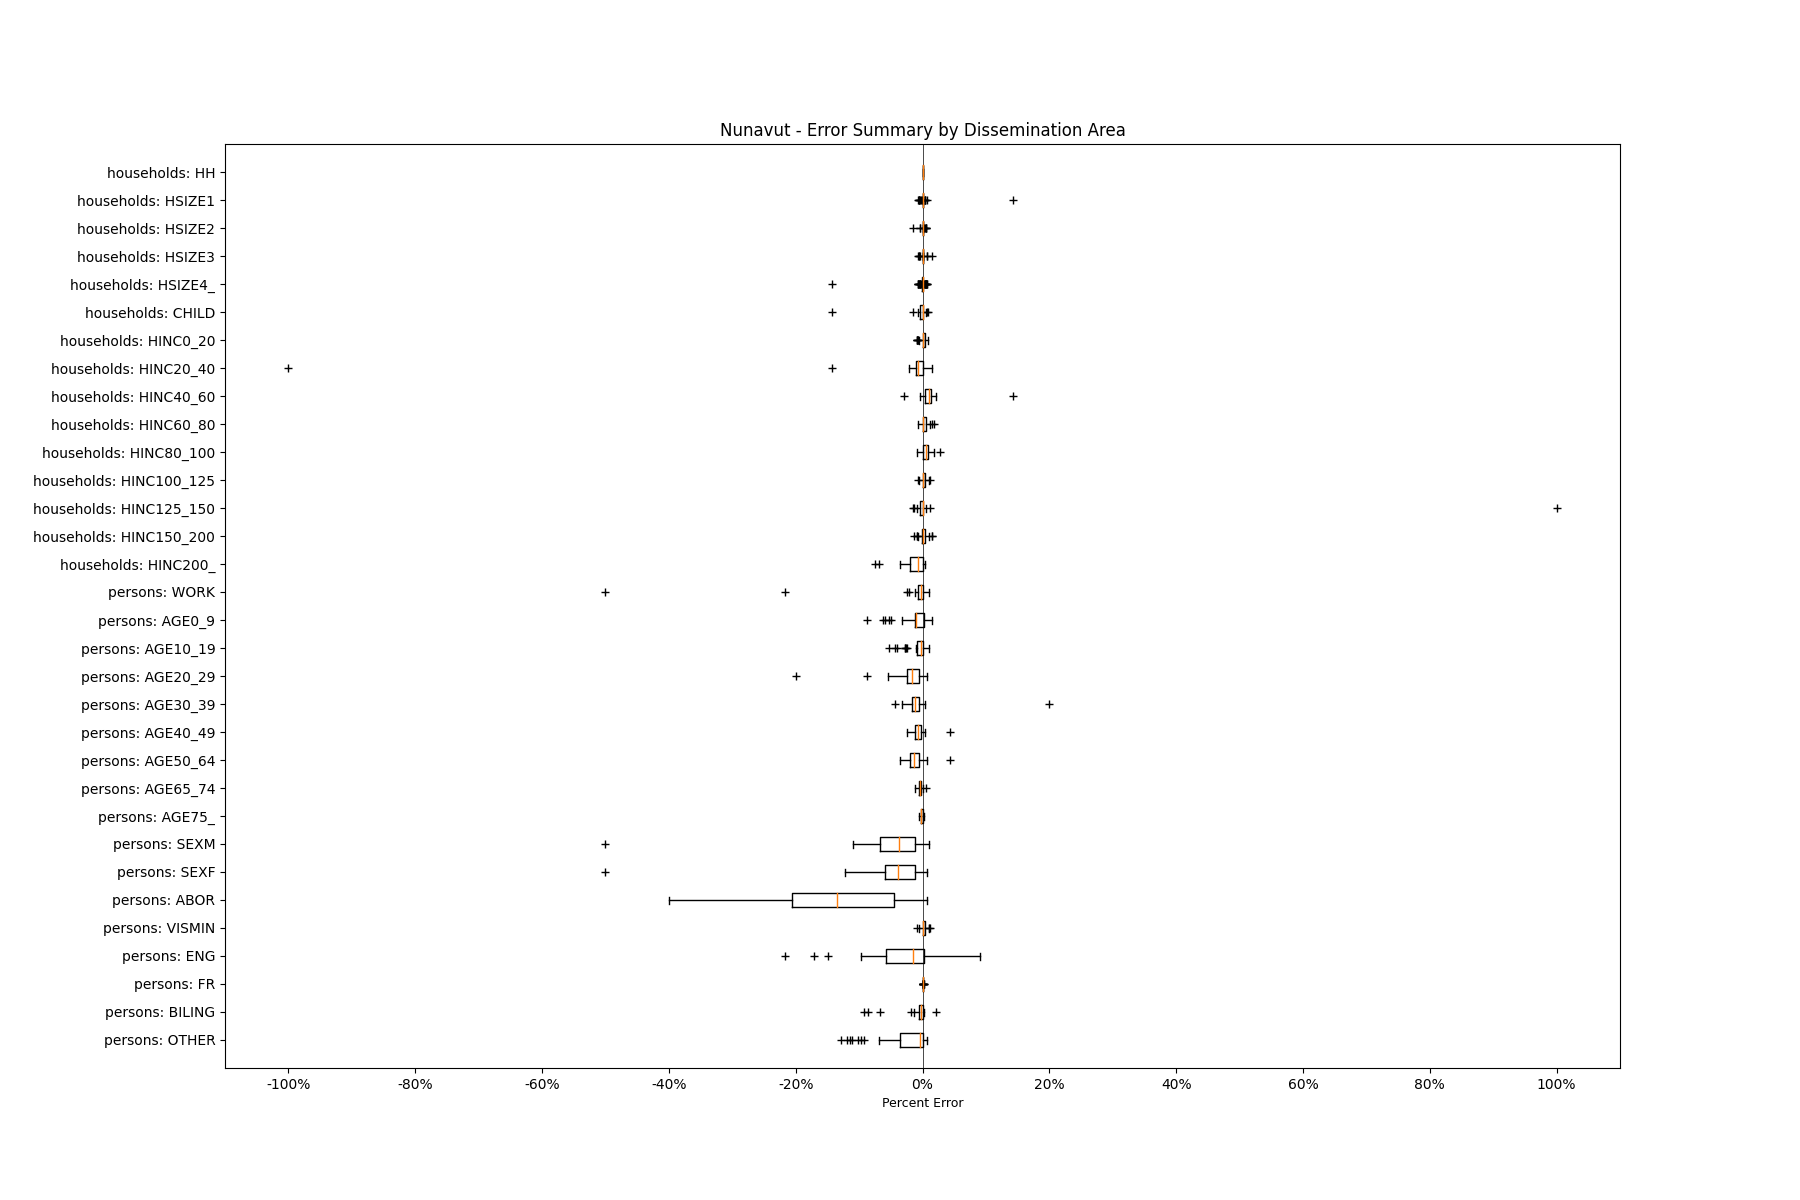
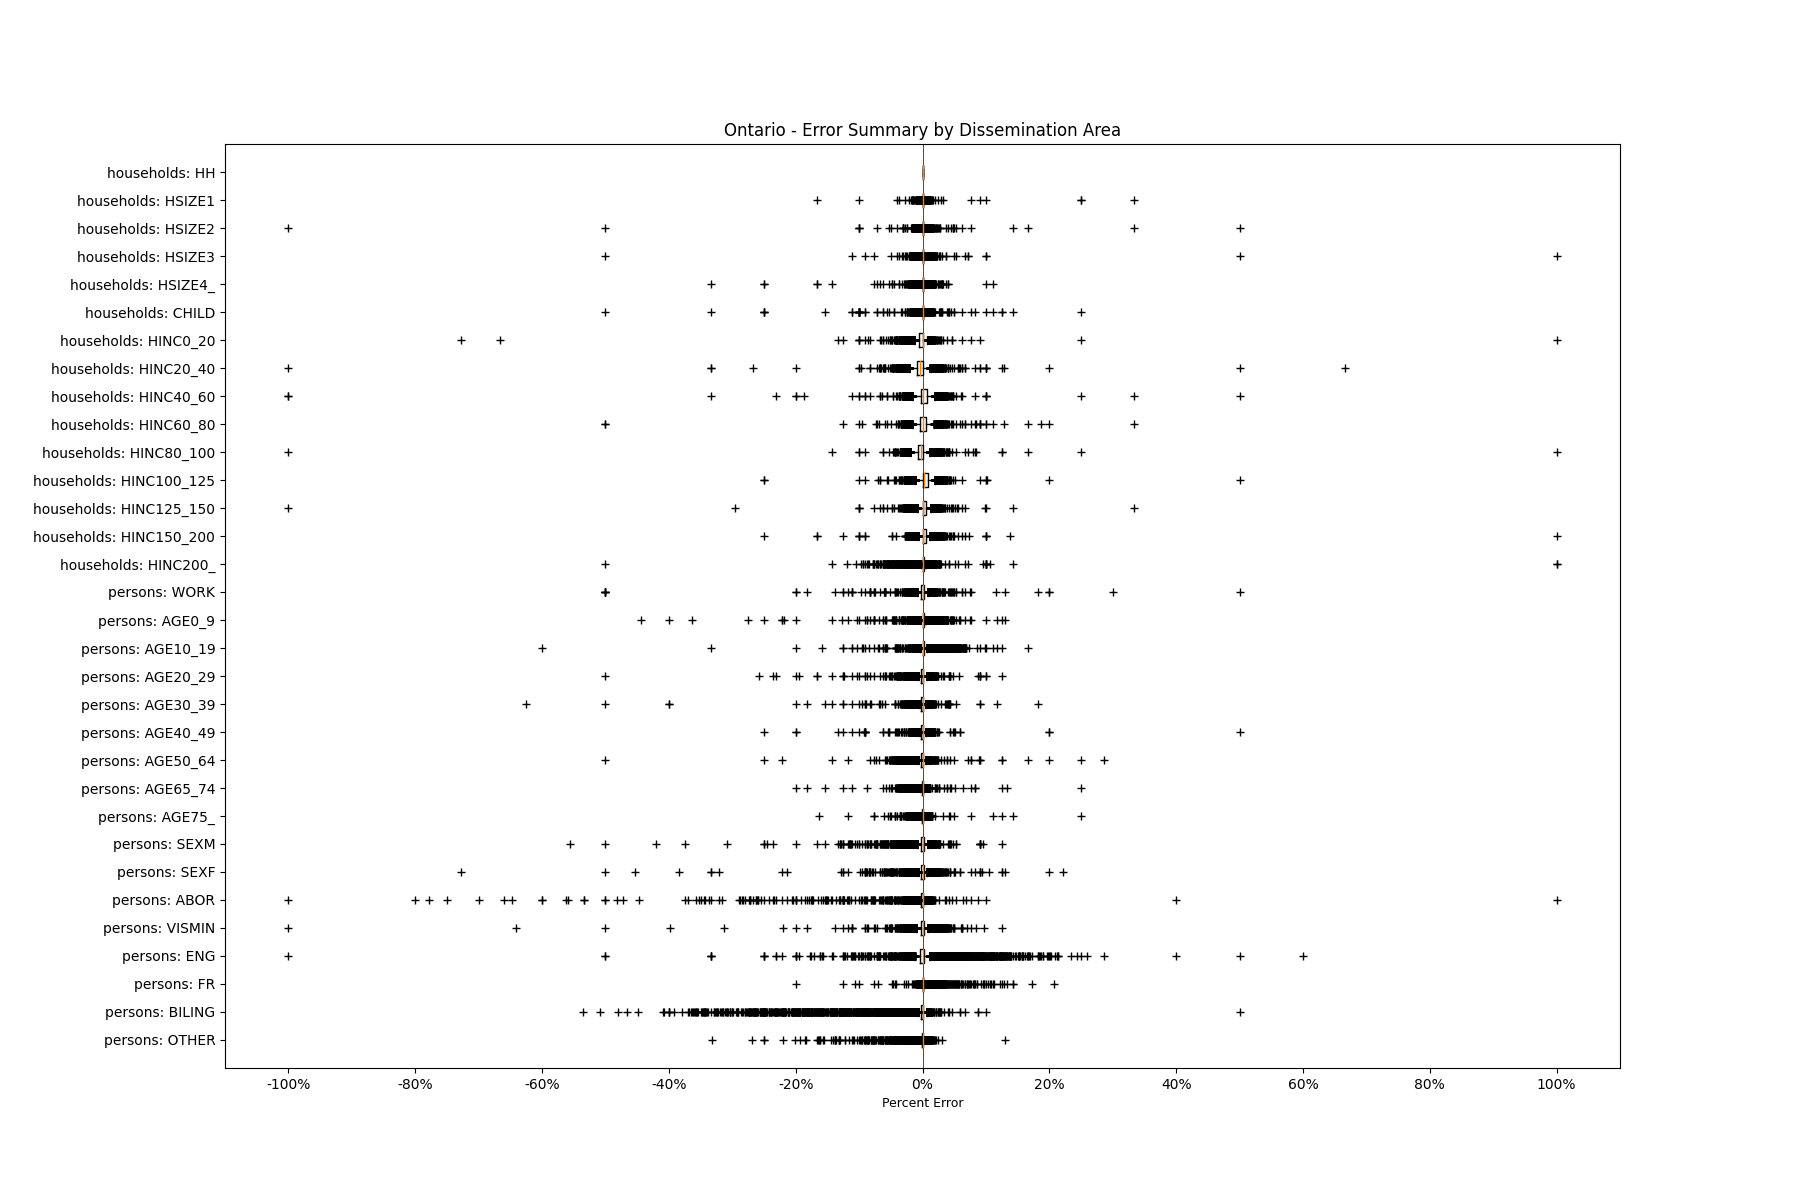
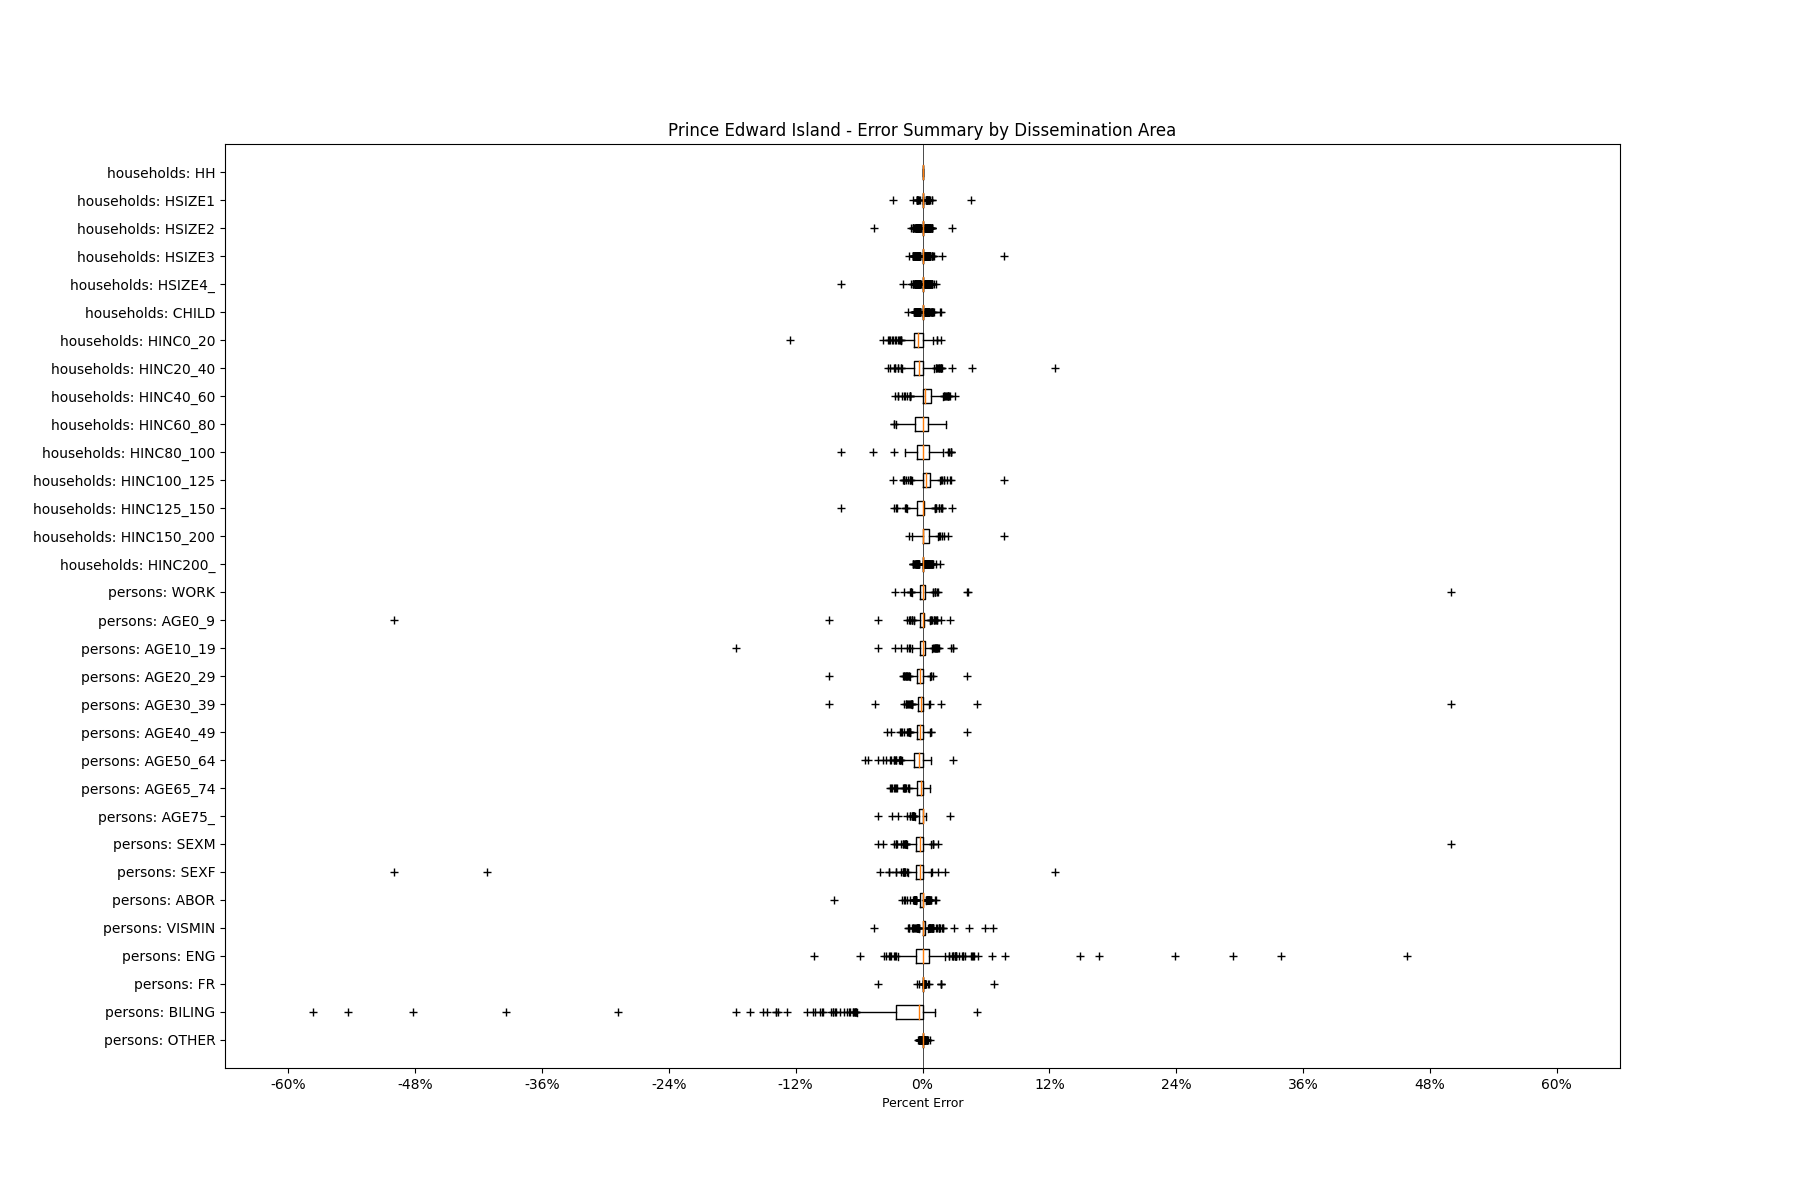
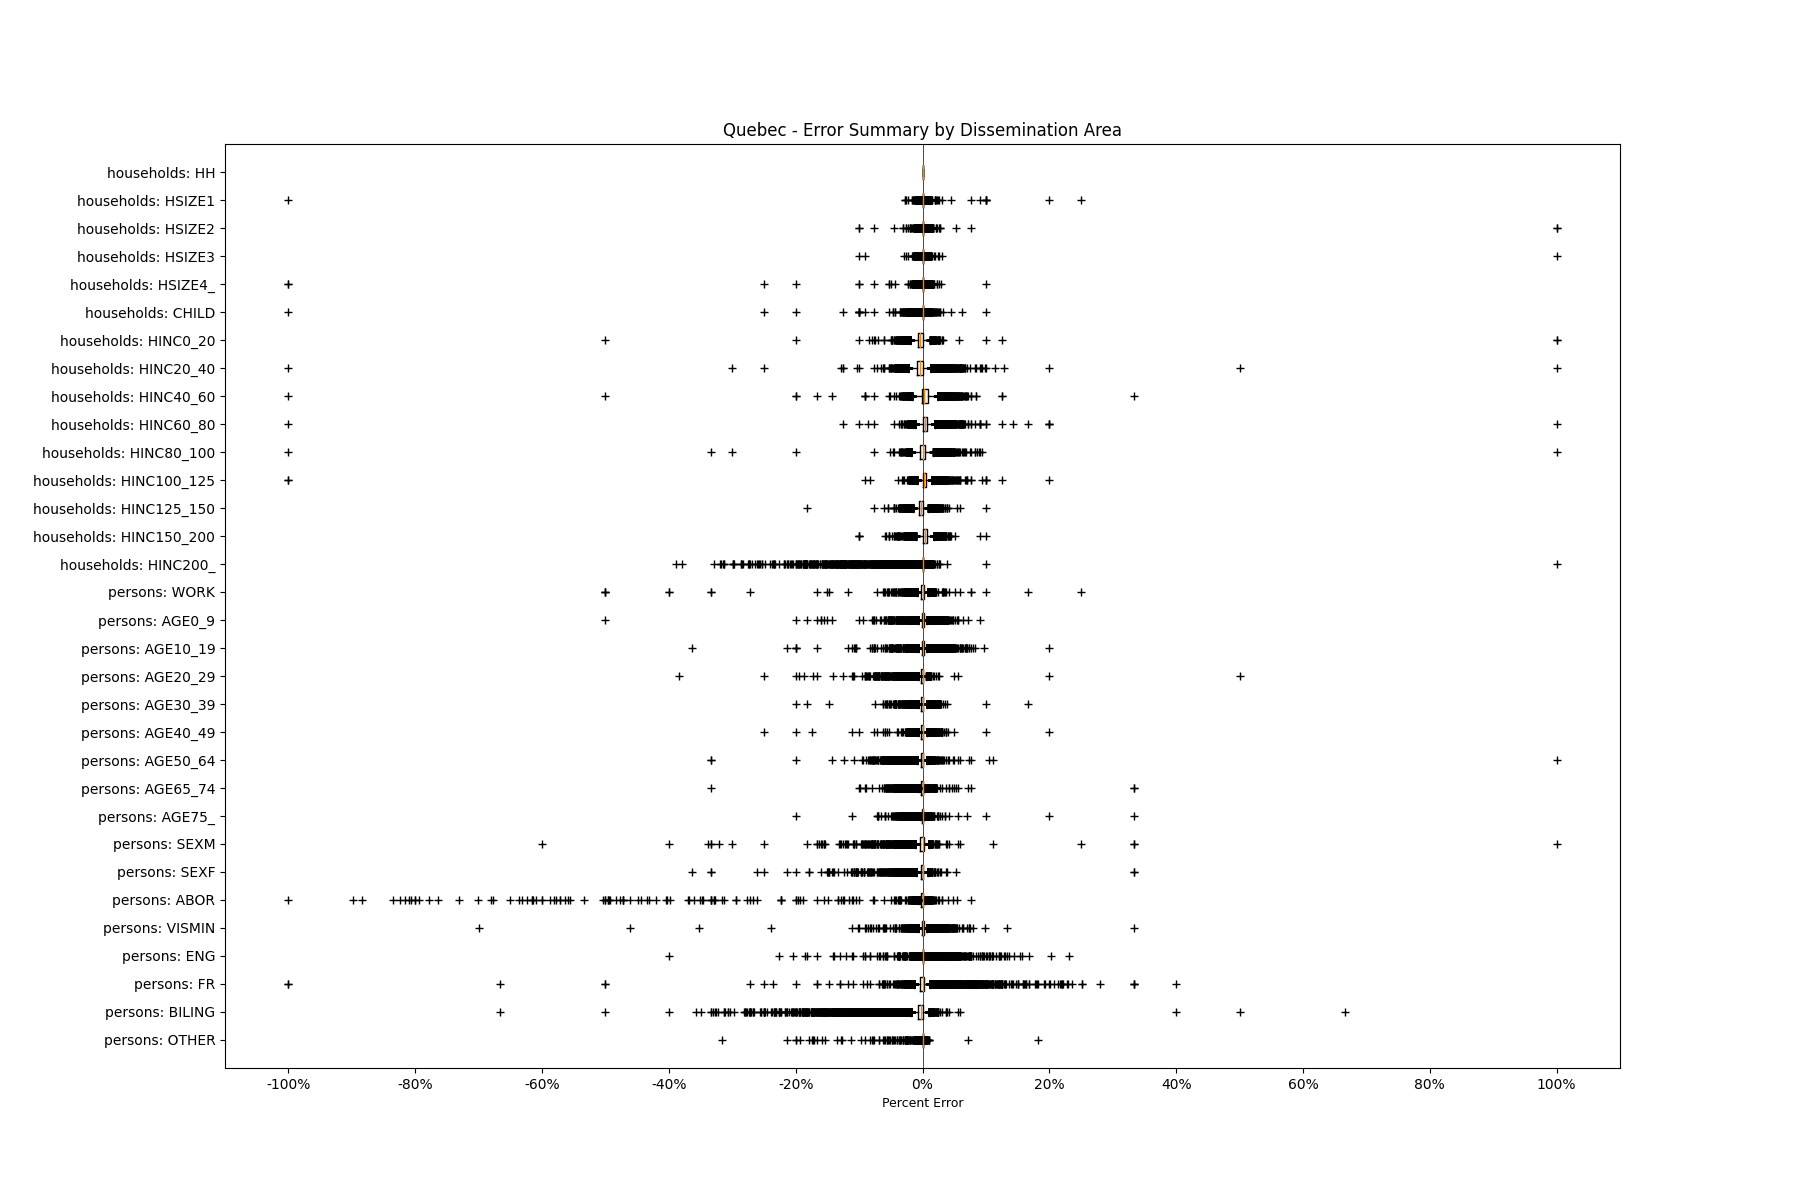
Motionworks’s Digital Population is also validated against each of the controlled variables at the neighborhood level, which in Canada is a Statistics Canada Dissemination Area. The plots below compare Motionworks' Digital Population totals and the control totals.
For each variable, dissemination areas are binned together along the vertical axis into similar sized quartiles. For household variables, the dissemination areas are binned into categories of 0-99 households, 100-249 households, 250-499 households, and 500+ households.
Along the horizontal axis in the plots, the distribution of the difference over the dissemination areas between the digital total and control total is shown using a boxplot. One on this scale is a difference of one person (or household) between the control total and the digital population total. For example, dissemination area A has a control total of 100 people and the digital population has 99 people. The ends of the horizontal lines out from the box show the 5th and 95th percentiles.
Total Households (Neighborhood)
These dissemination area comparison plots show that the Motionworks Digital Population is less than 1 households away from the control total in nearly all dissemination areas.
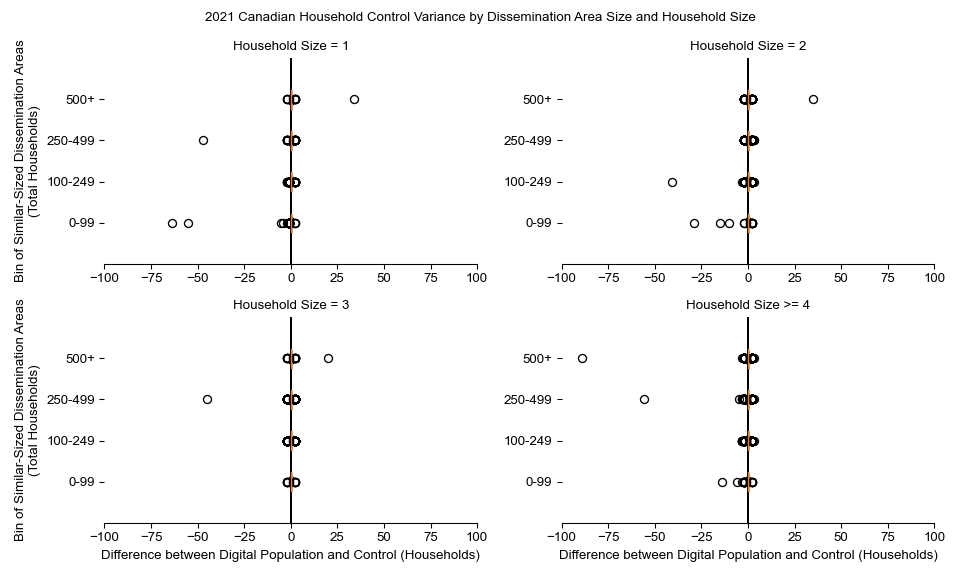
Households by Size (Neighborhood)
Similar to total households, the Digital Population tends to match household size counts well.
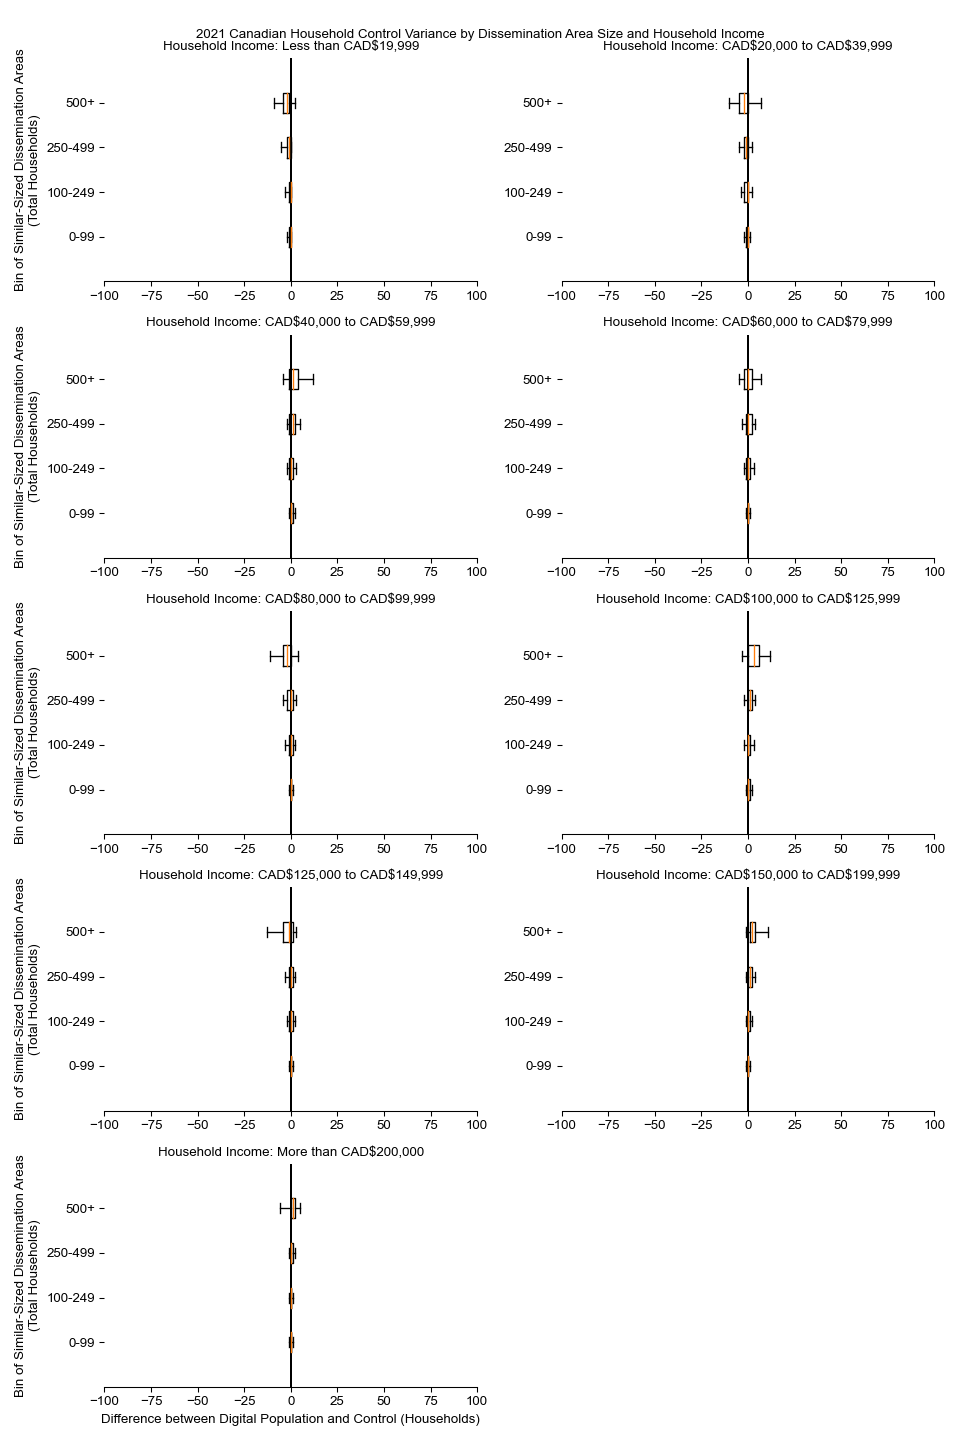
Households by Income (Neighborhood)
The Digital Population construction process heavily prioritizes matching household income distributions. In nearly every income bin and dissemination area size category, households are within 5 households of the control totals in 95% or more of the dissemination areas.
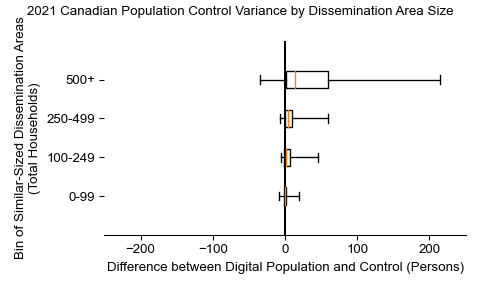
Total Population (Neighborhood)
Because the Digital Population tends to overrepresent larger households the population differences between the modeled population compared to the control population accumulate in larger numbers in larger dissemination areas. Overall though, most dissemination areas are within 10 people of the control value.
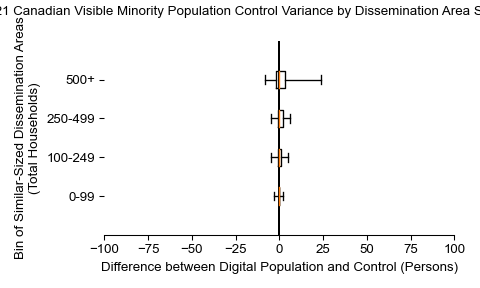
Population by Visible Minority Status (Neighborhood)
Visible minority refers to whether a person is a visible minority or not, as defined by the Canadian Employment Equity Act. The Employment Equity Act defines visible minorities as "persons, other than Aboriginal peoples, who are non-Caucasian in race or non-white in colour".
The Digital Population matches the controls relatively well for Visible Minority. Within each dissemination area, the Digital Population matches with 5 people most of the time.
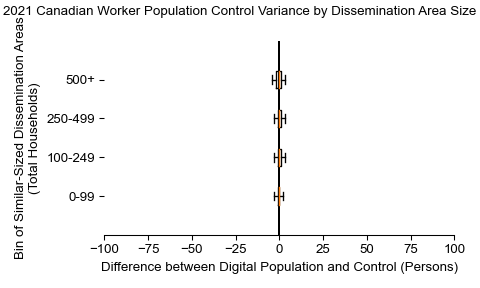
Population by Worker Status (Neighborhood)
In nearly every dissemination area size category, workers are within 5 people of the control totals in 95% or more of the dissemination areas.
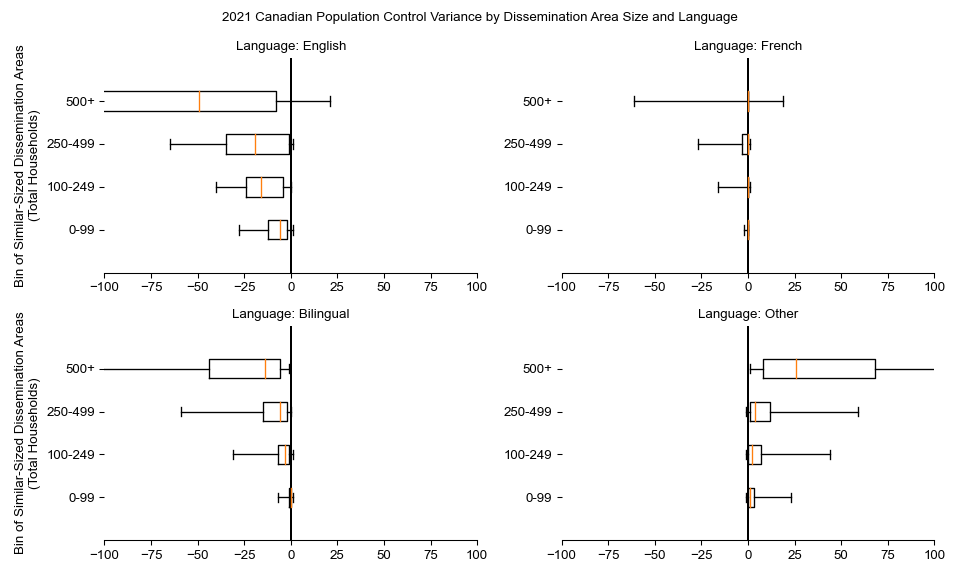
Population by Language Spoken at Home (Neighborhood)
The Digital Population includes a language attribute. This is the lowest priority control in the Digital Population construction. Language matches reasonably well in most dissemination areas, but does have more variability than other variables.
It is also important to point out that variance is greater for English speakers given the absolute scale of the number of English speakers in the Canada compared to French and other language speakers.
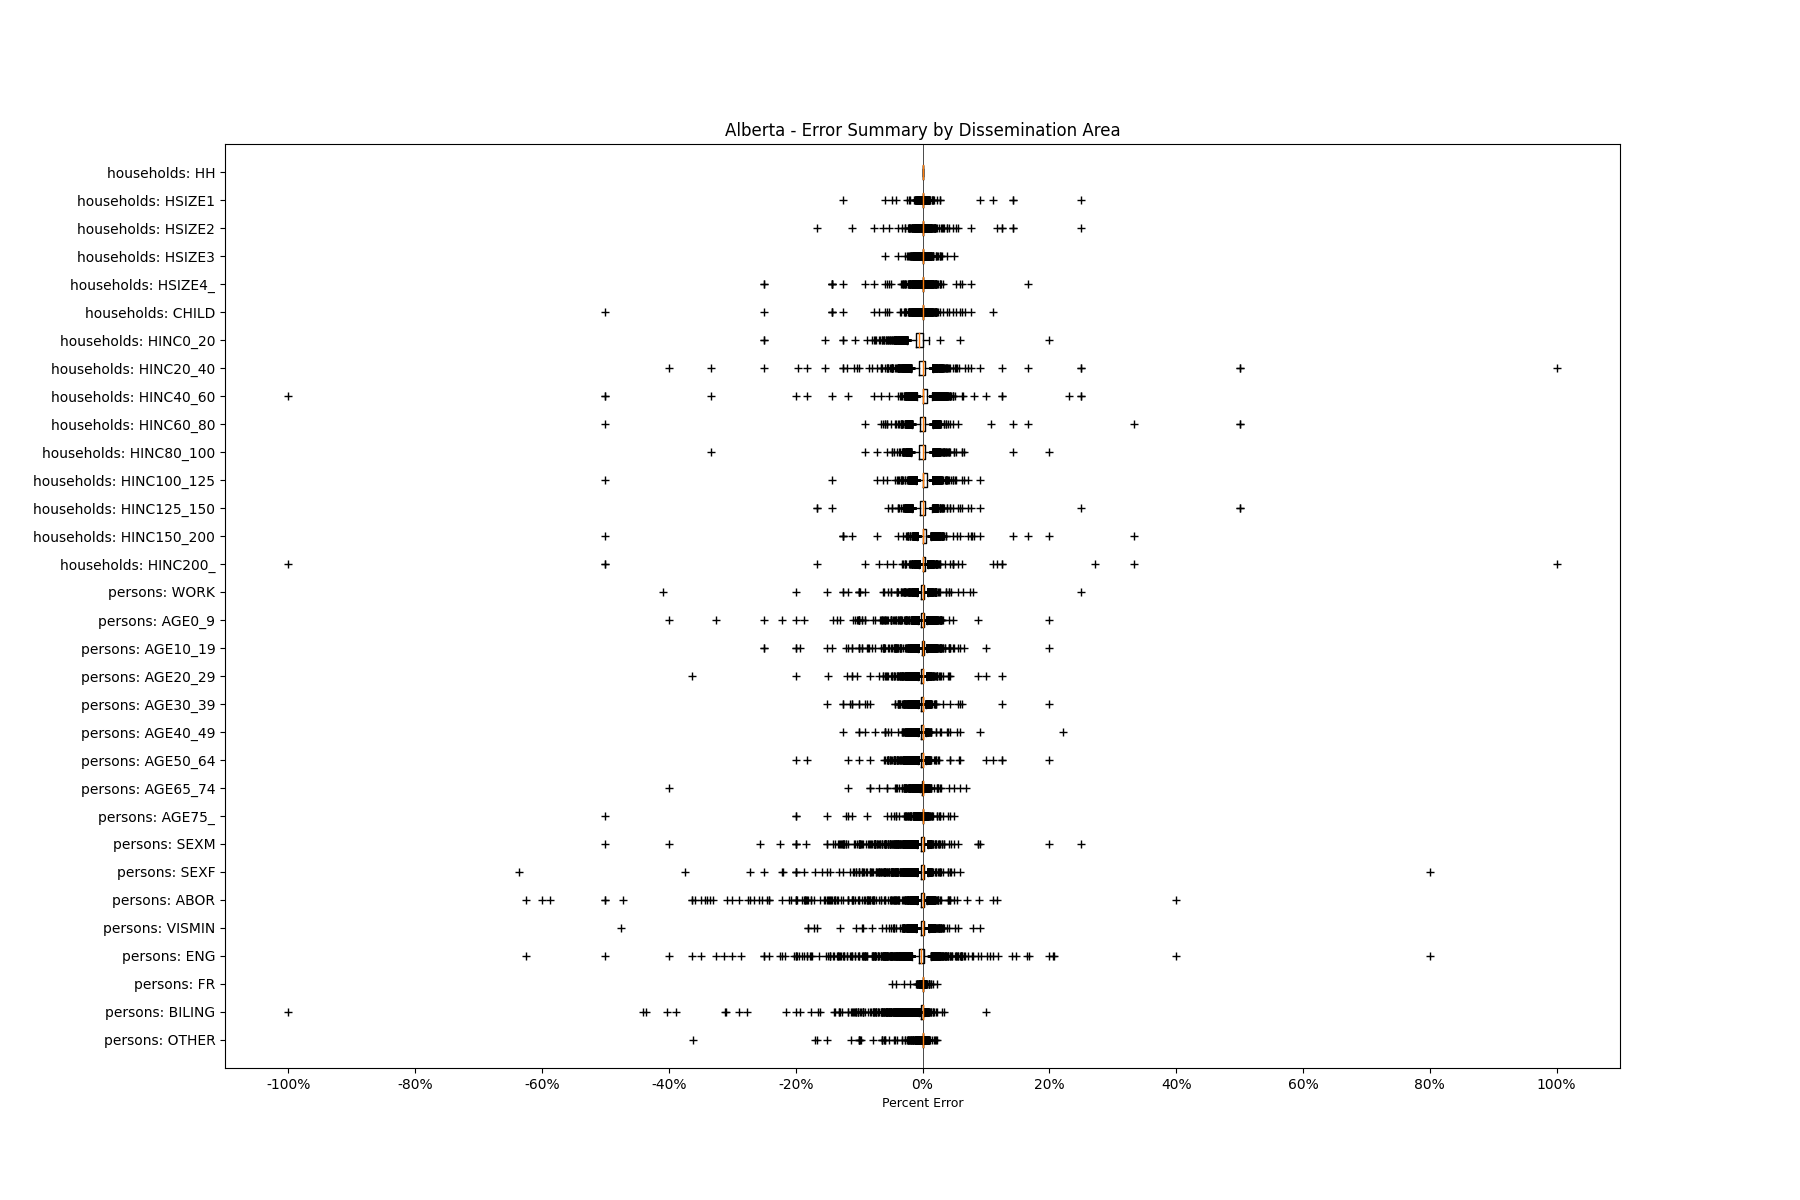
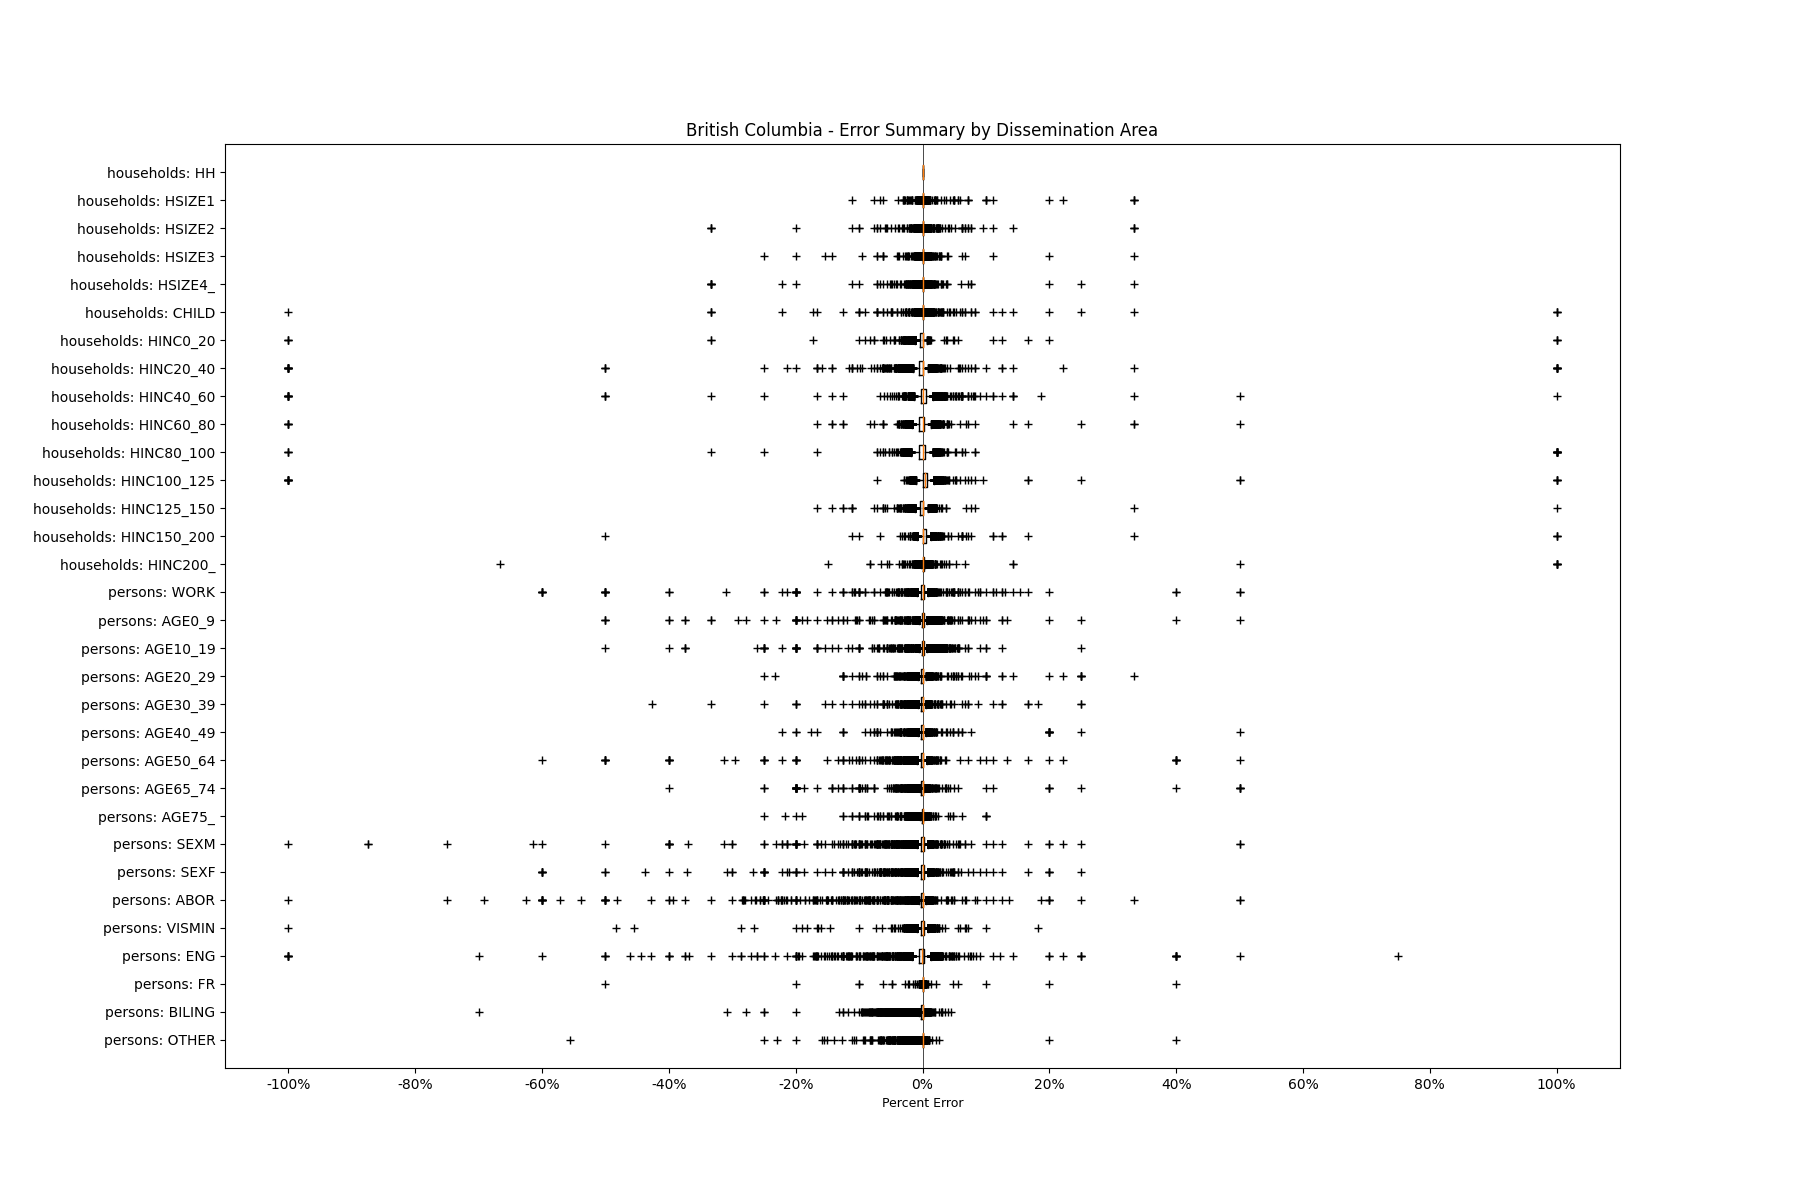
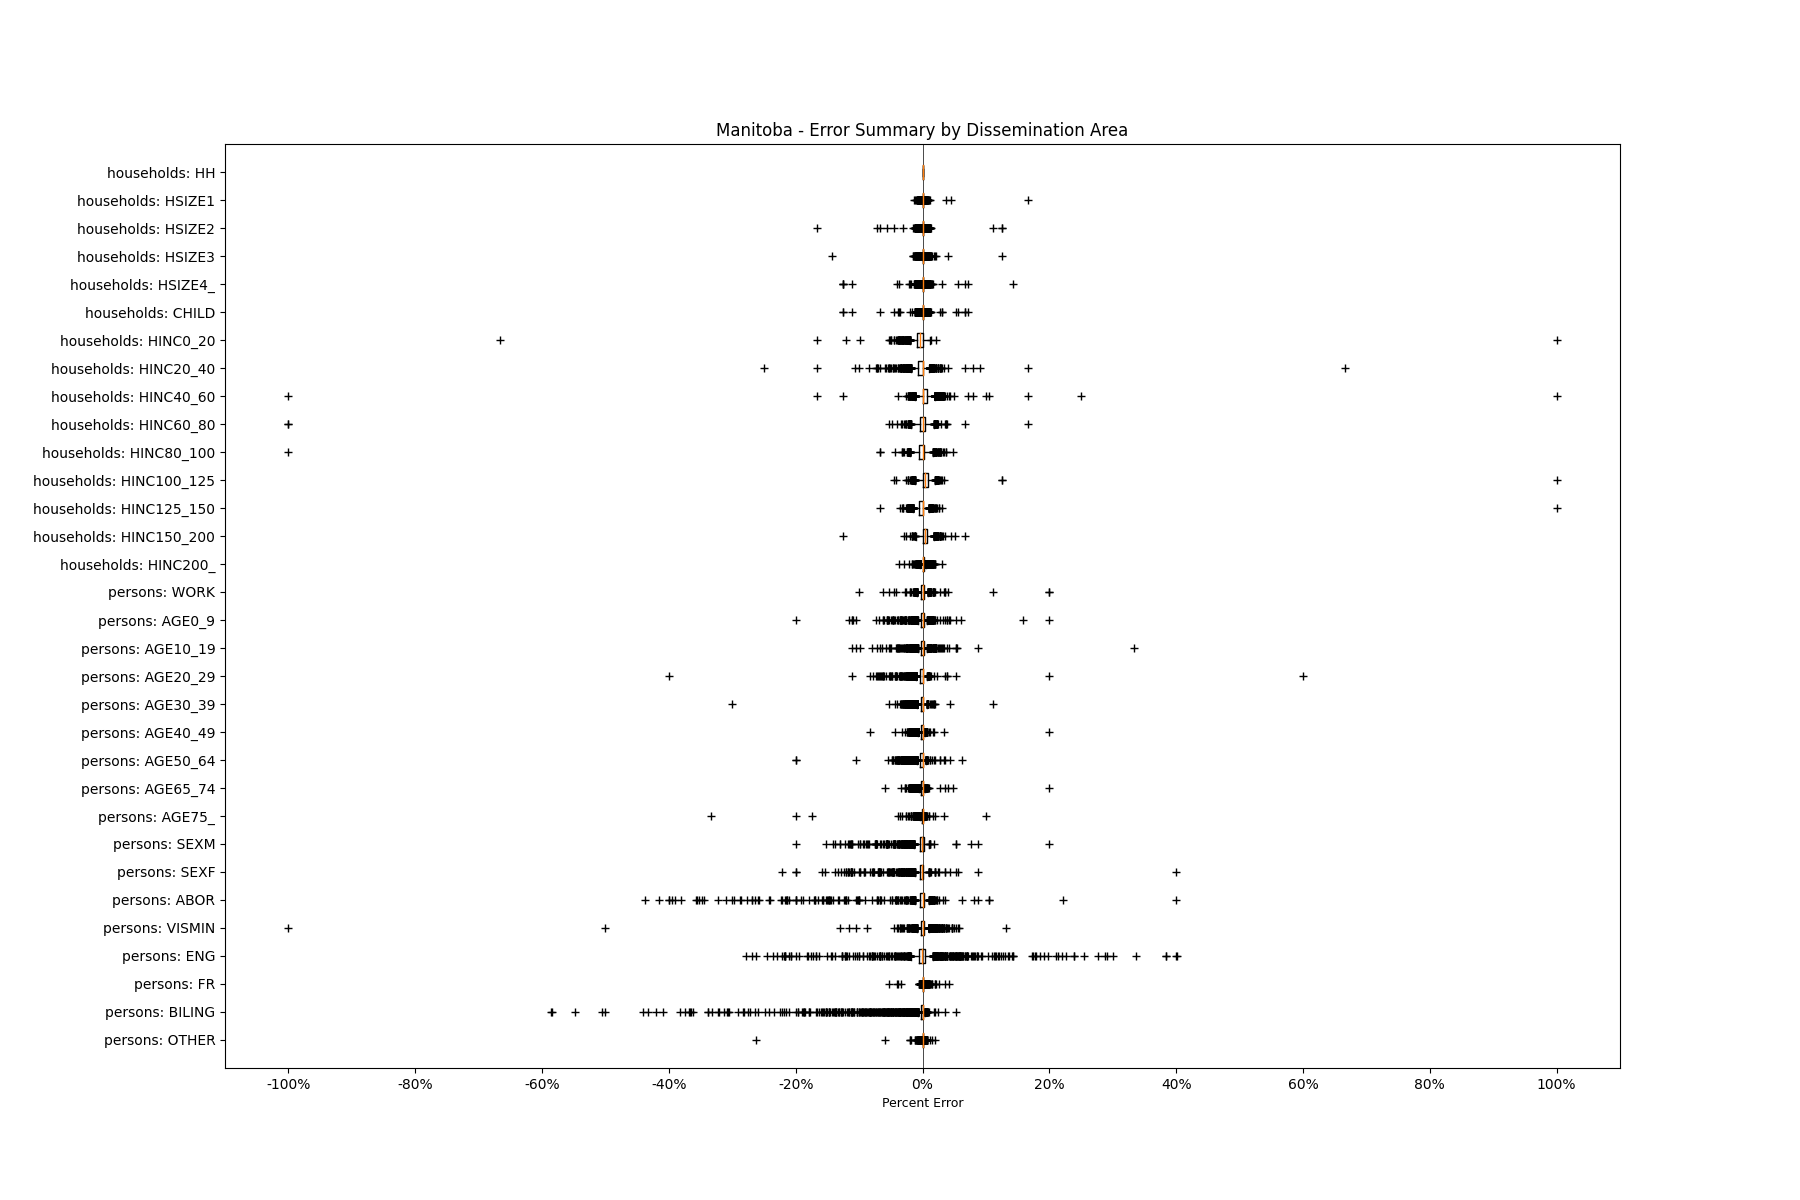
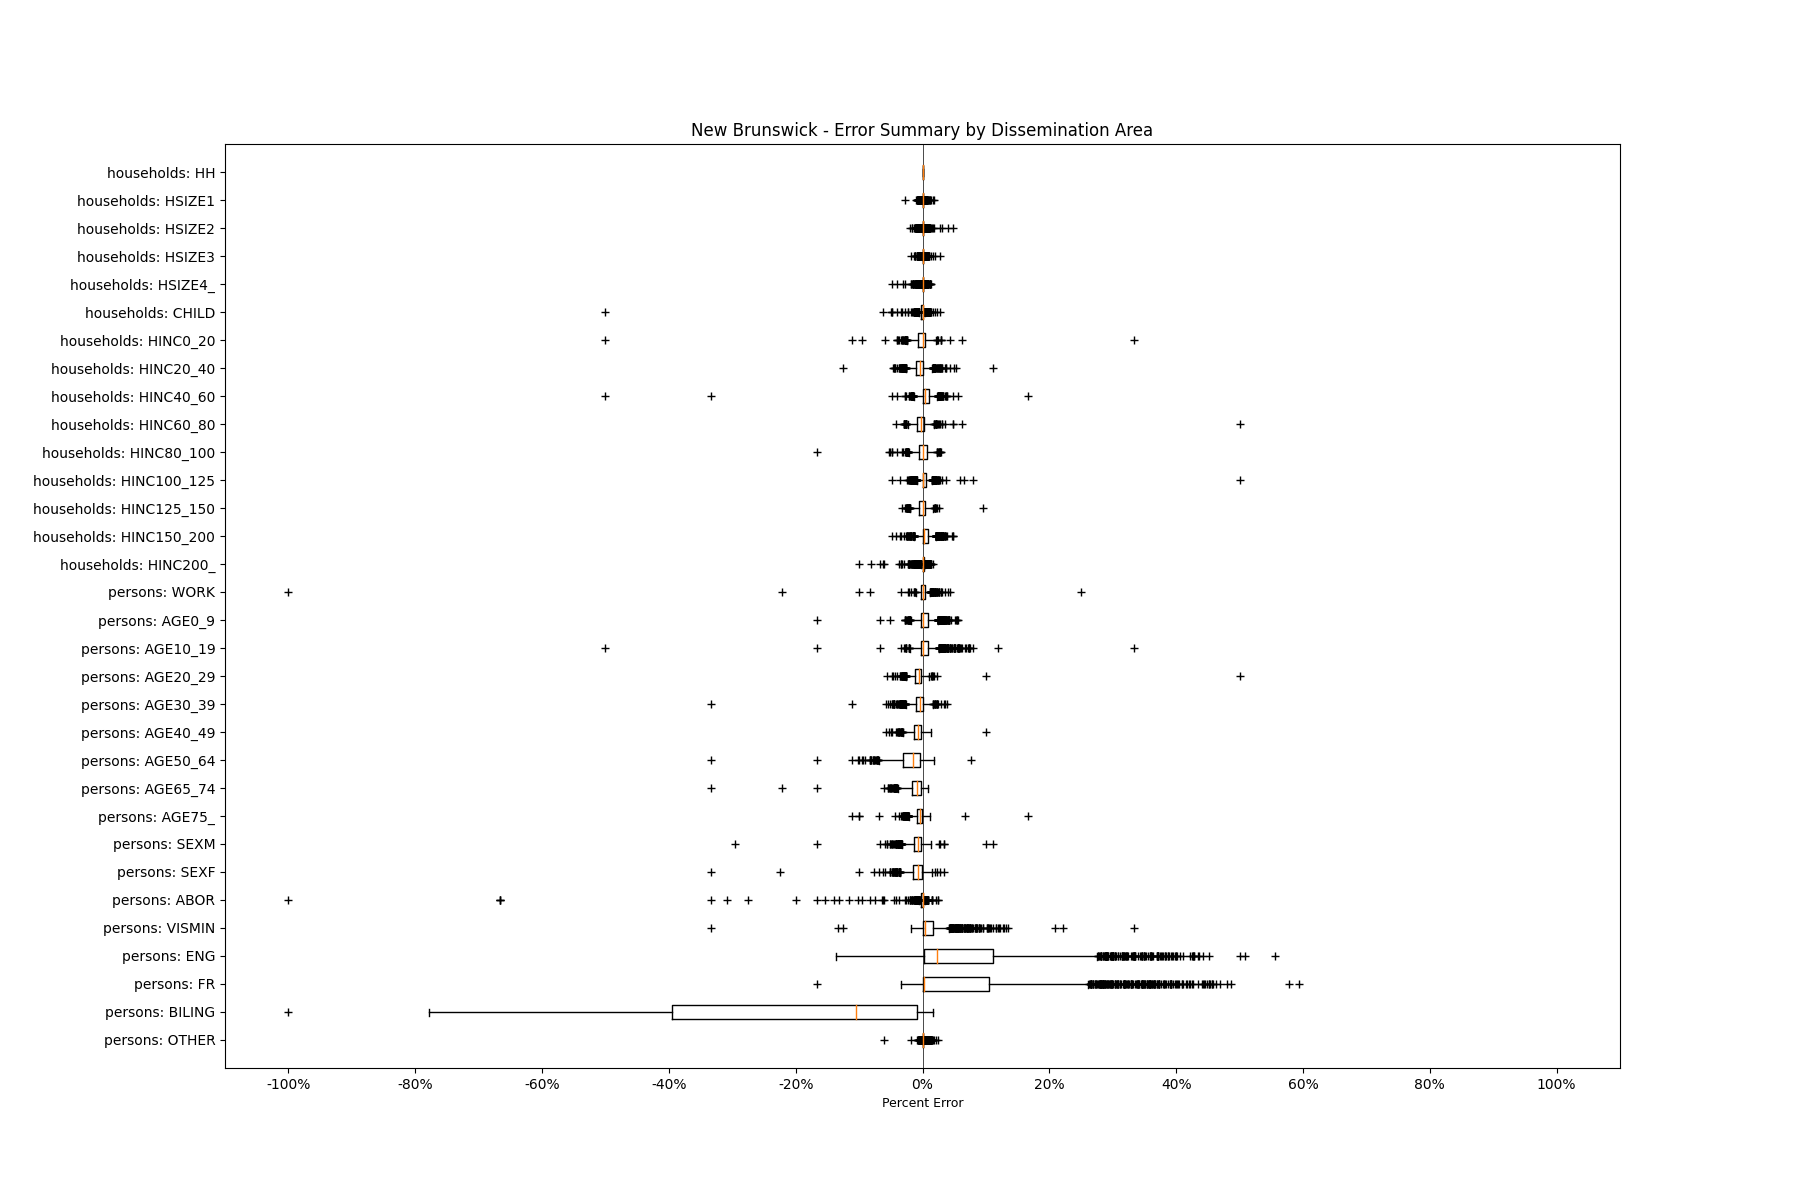
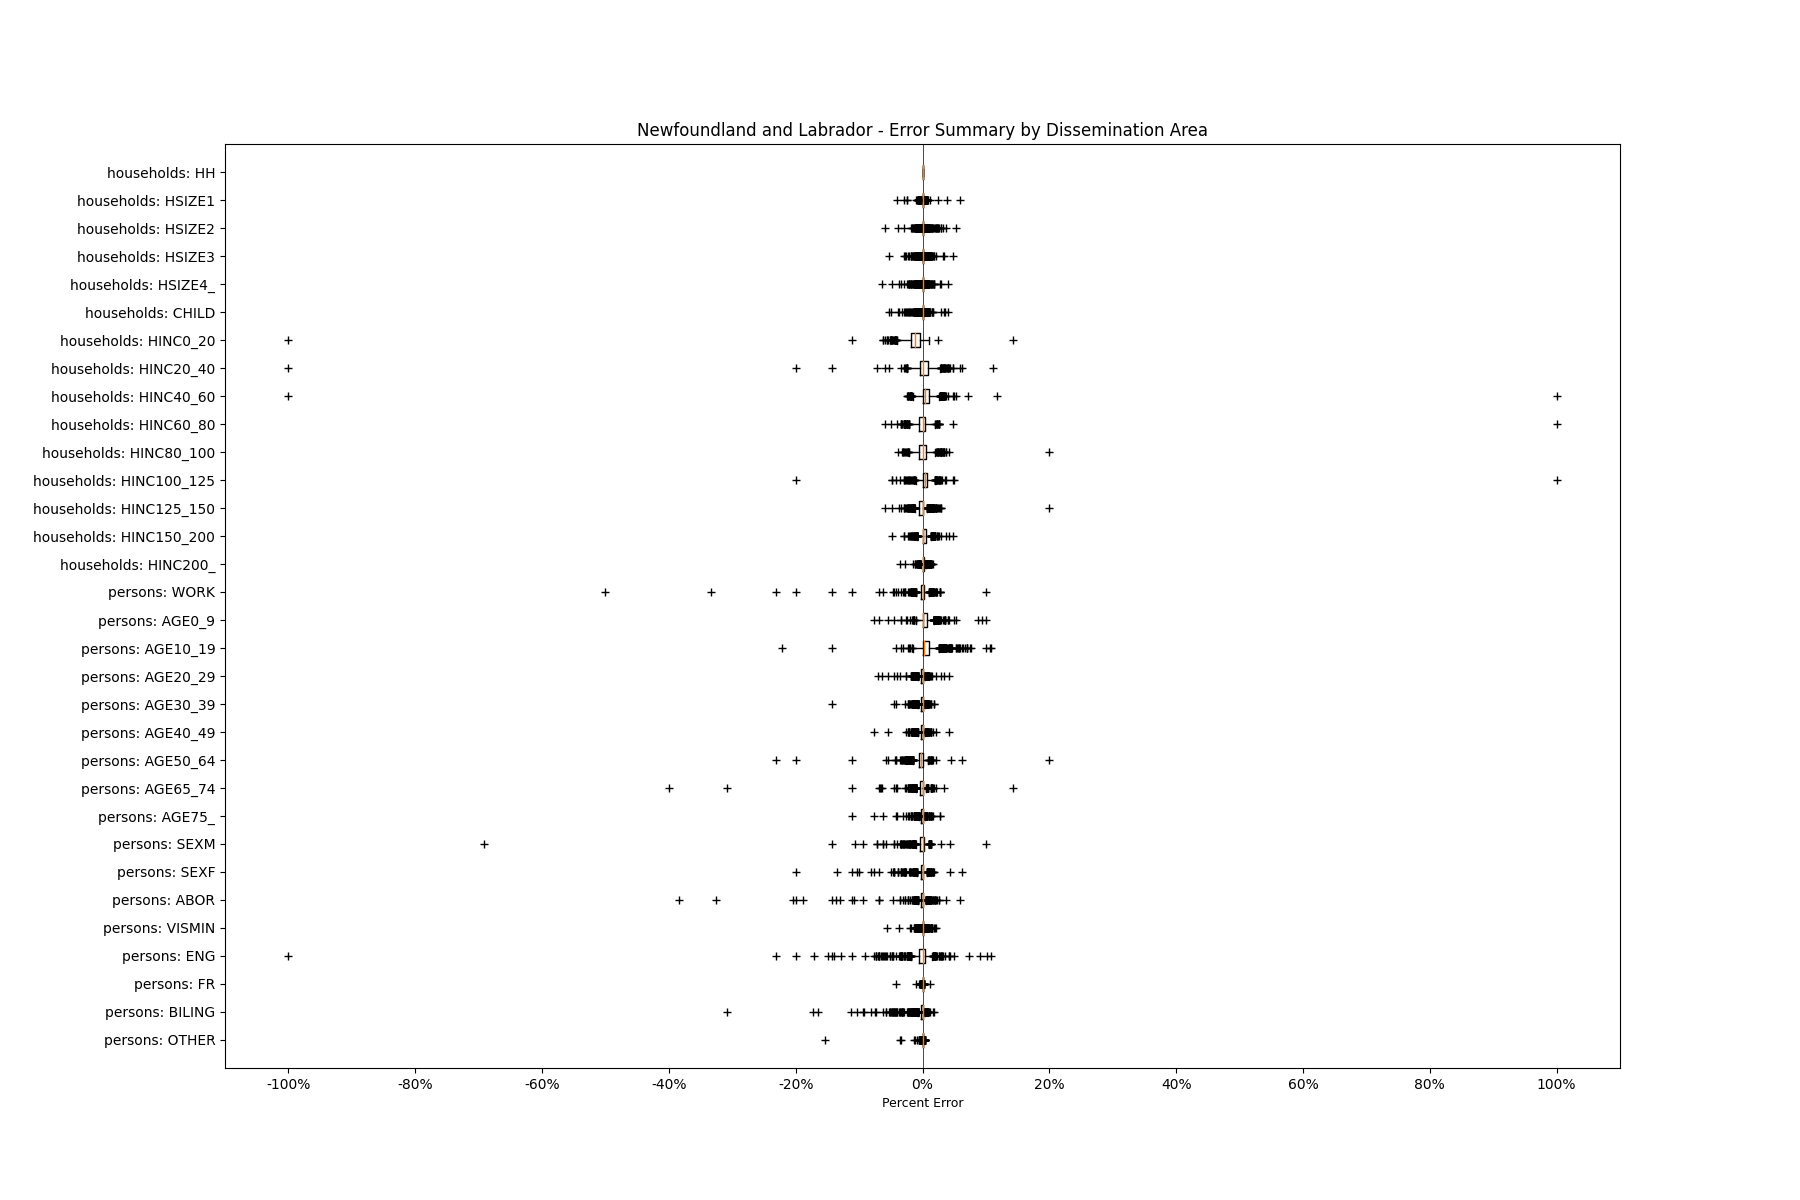
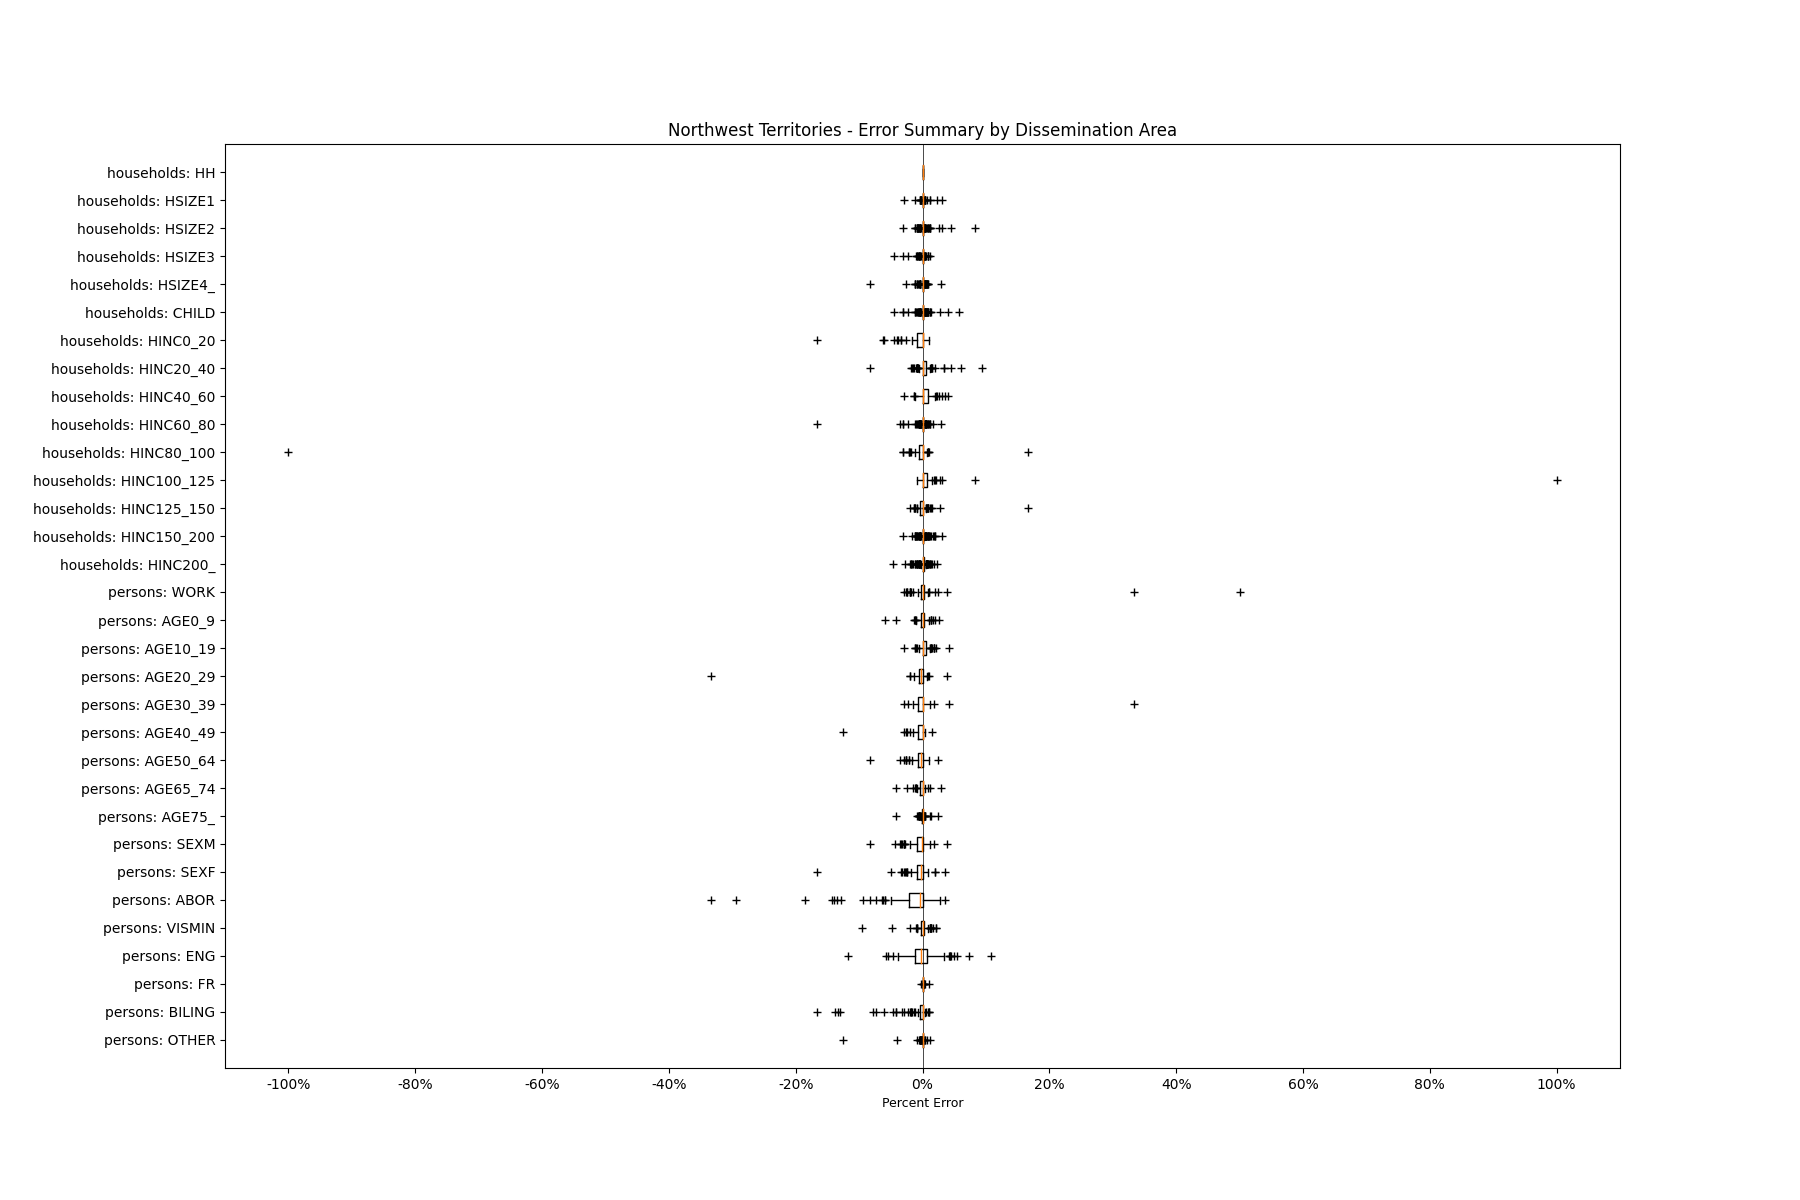
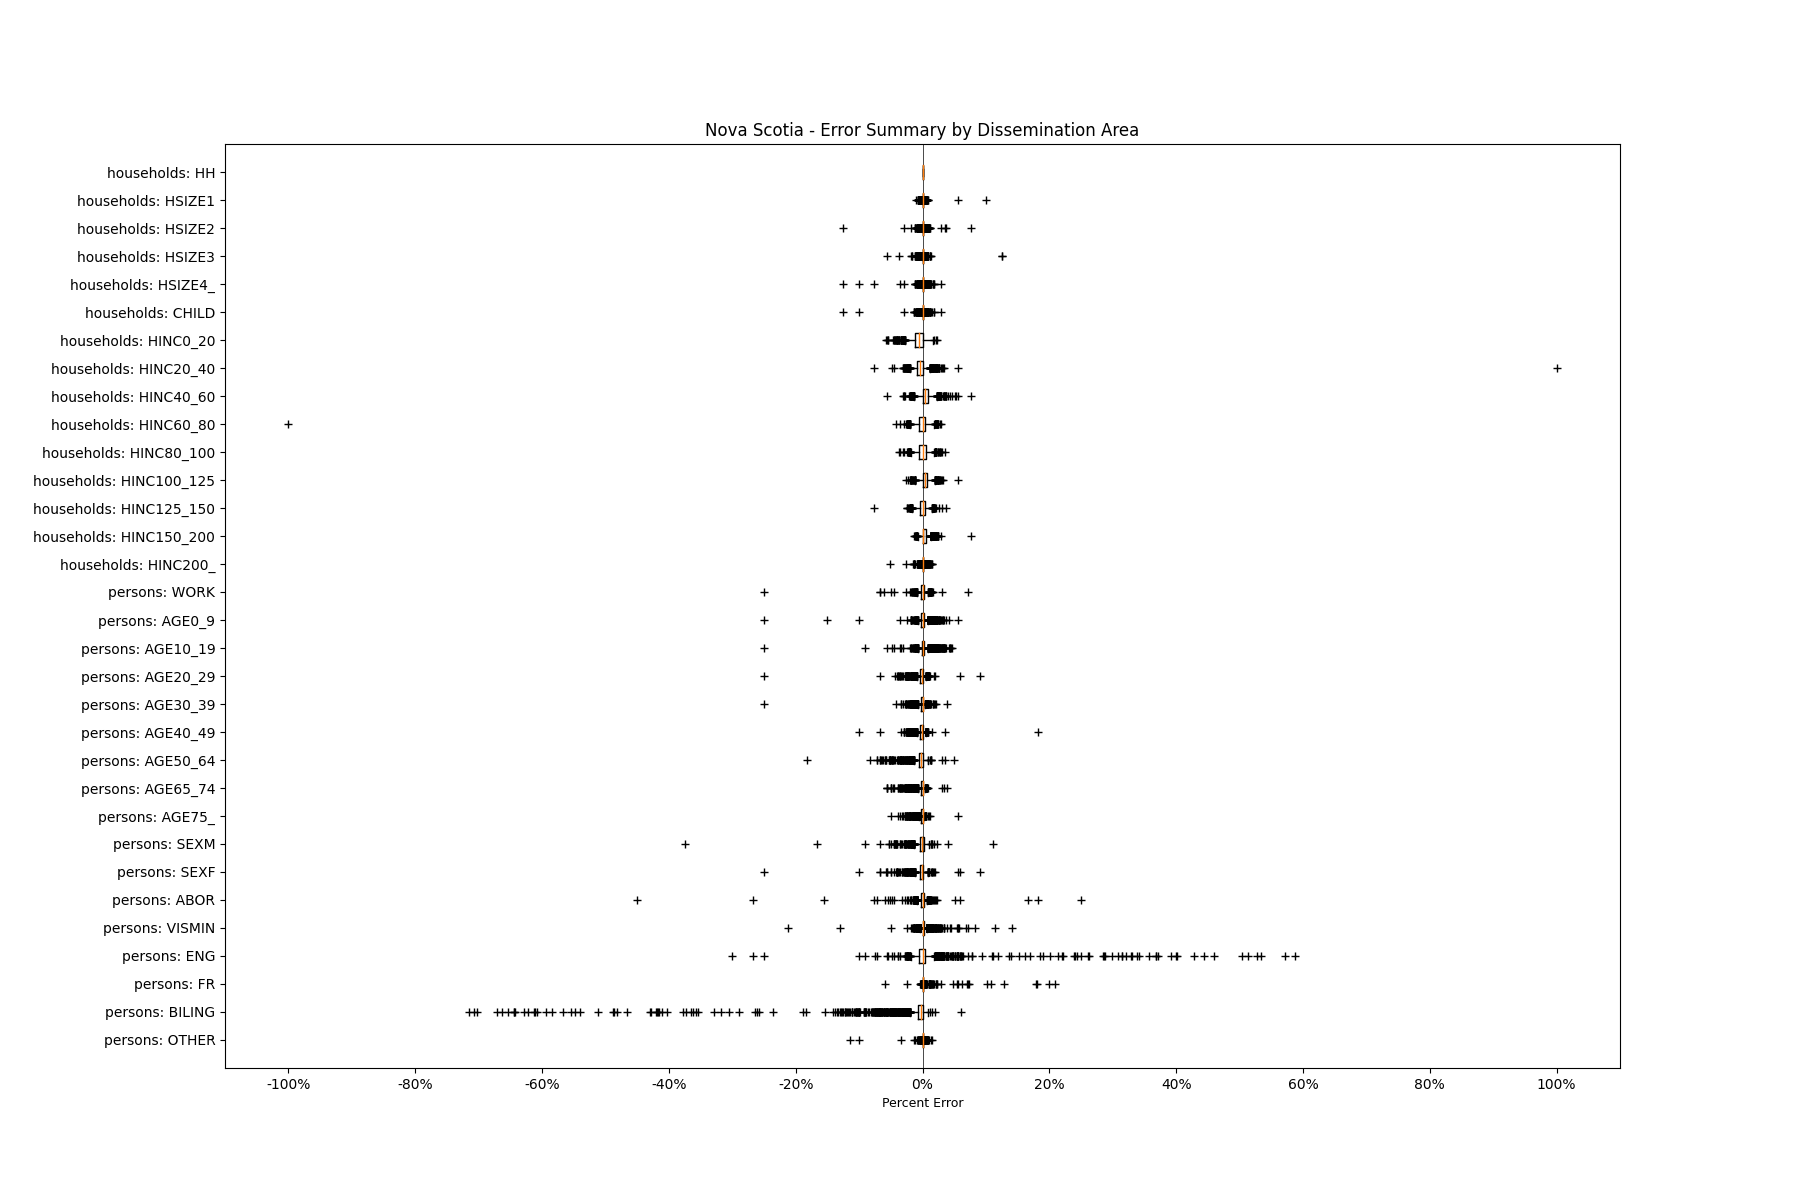
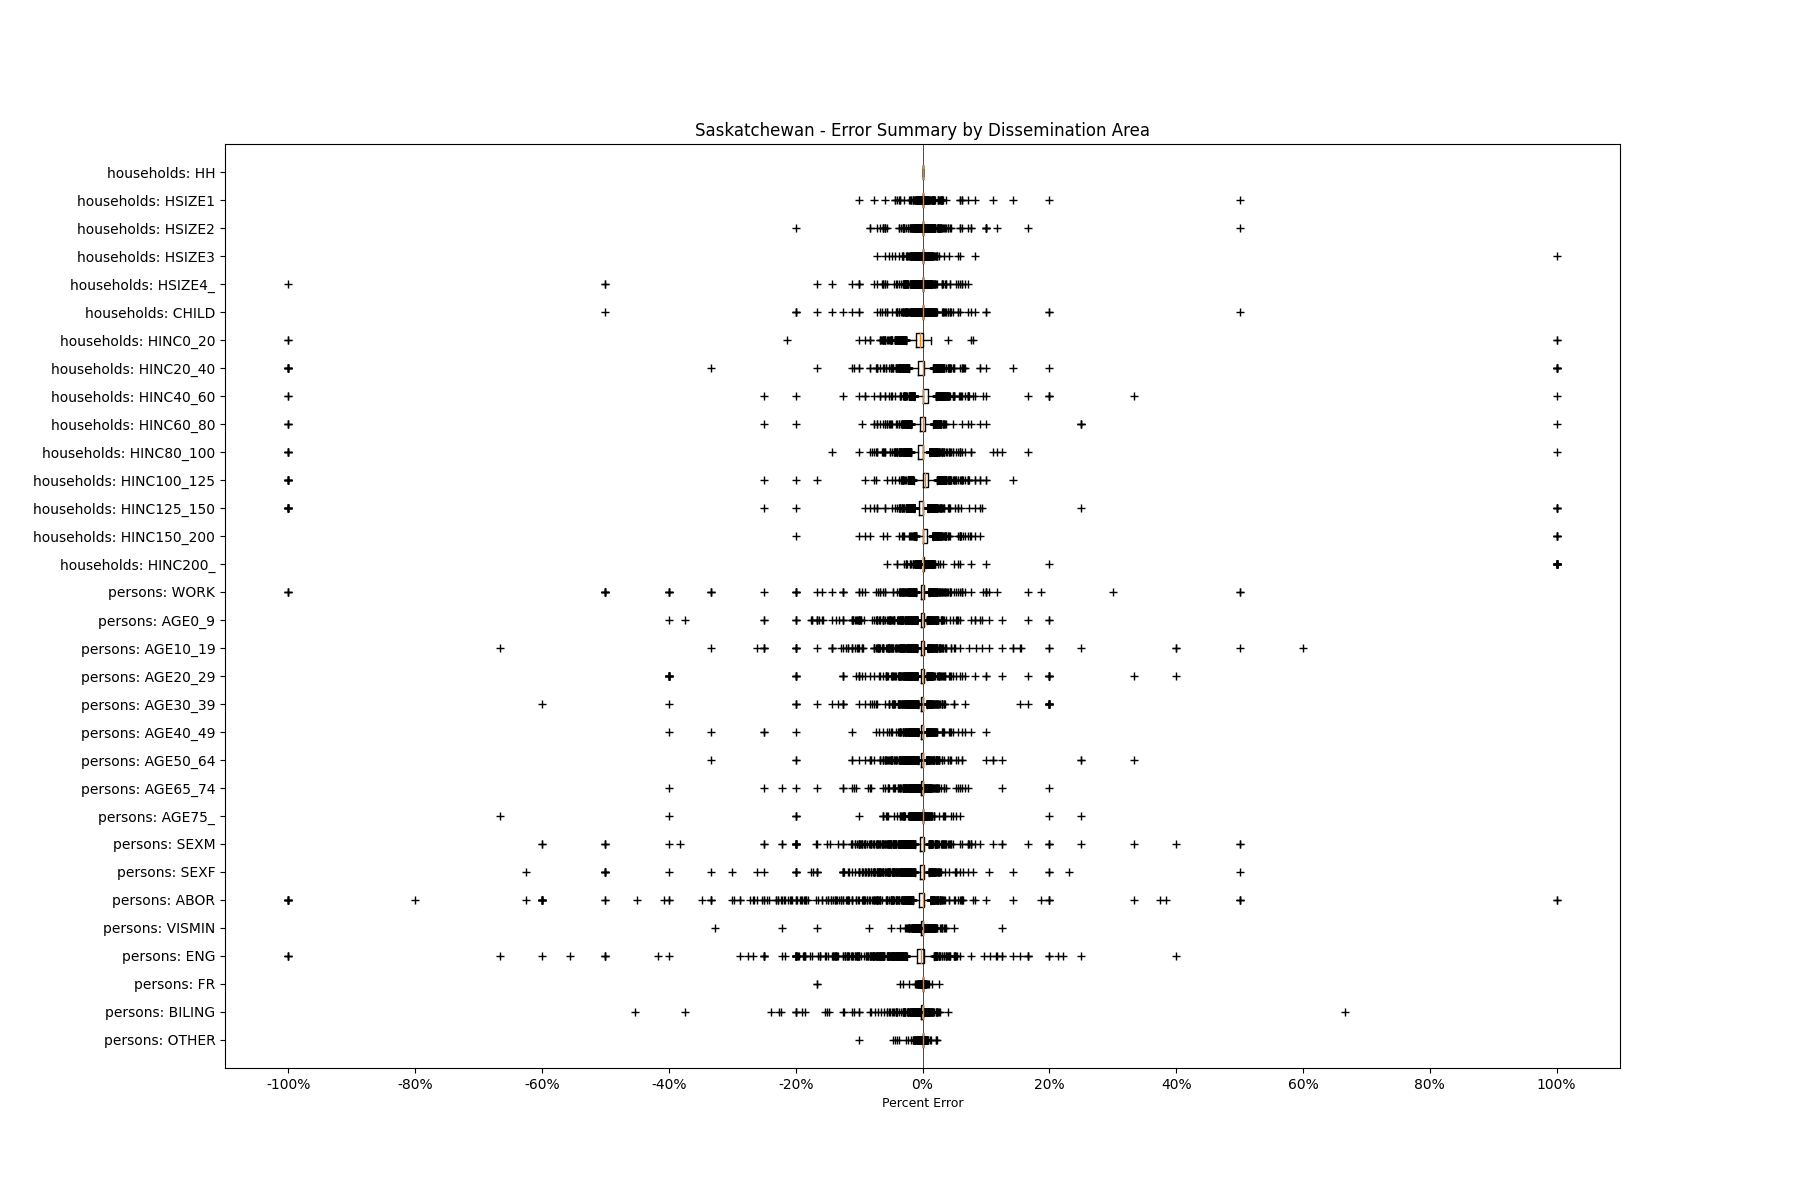
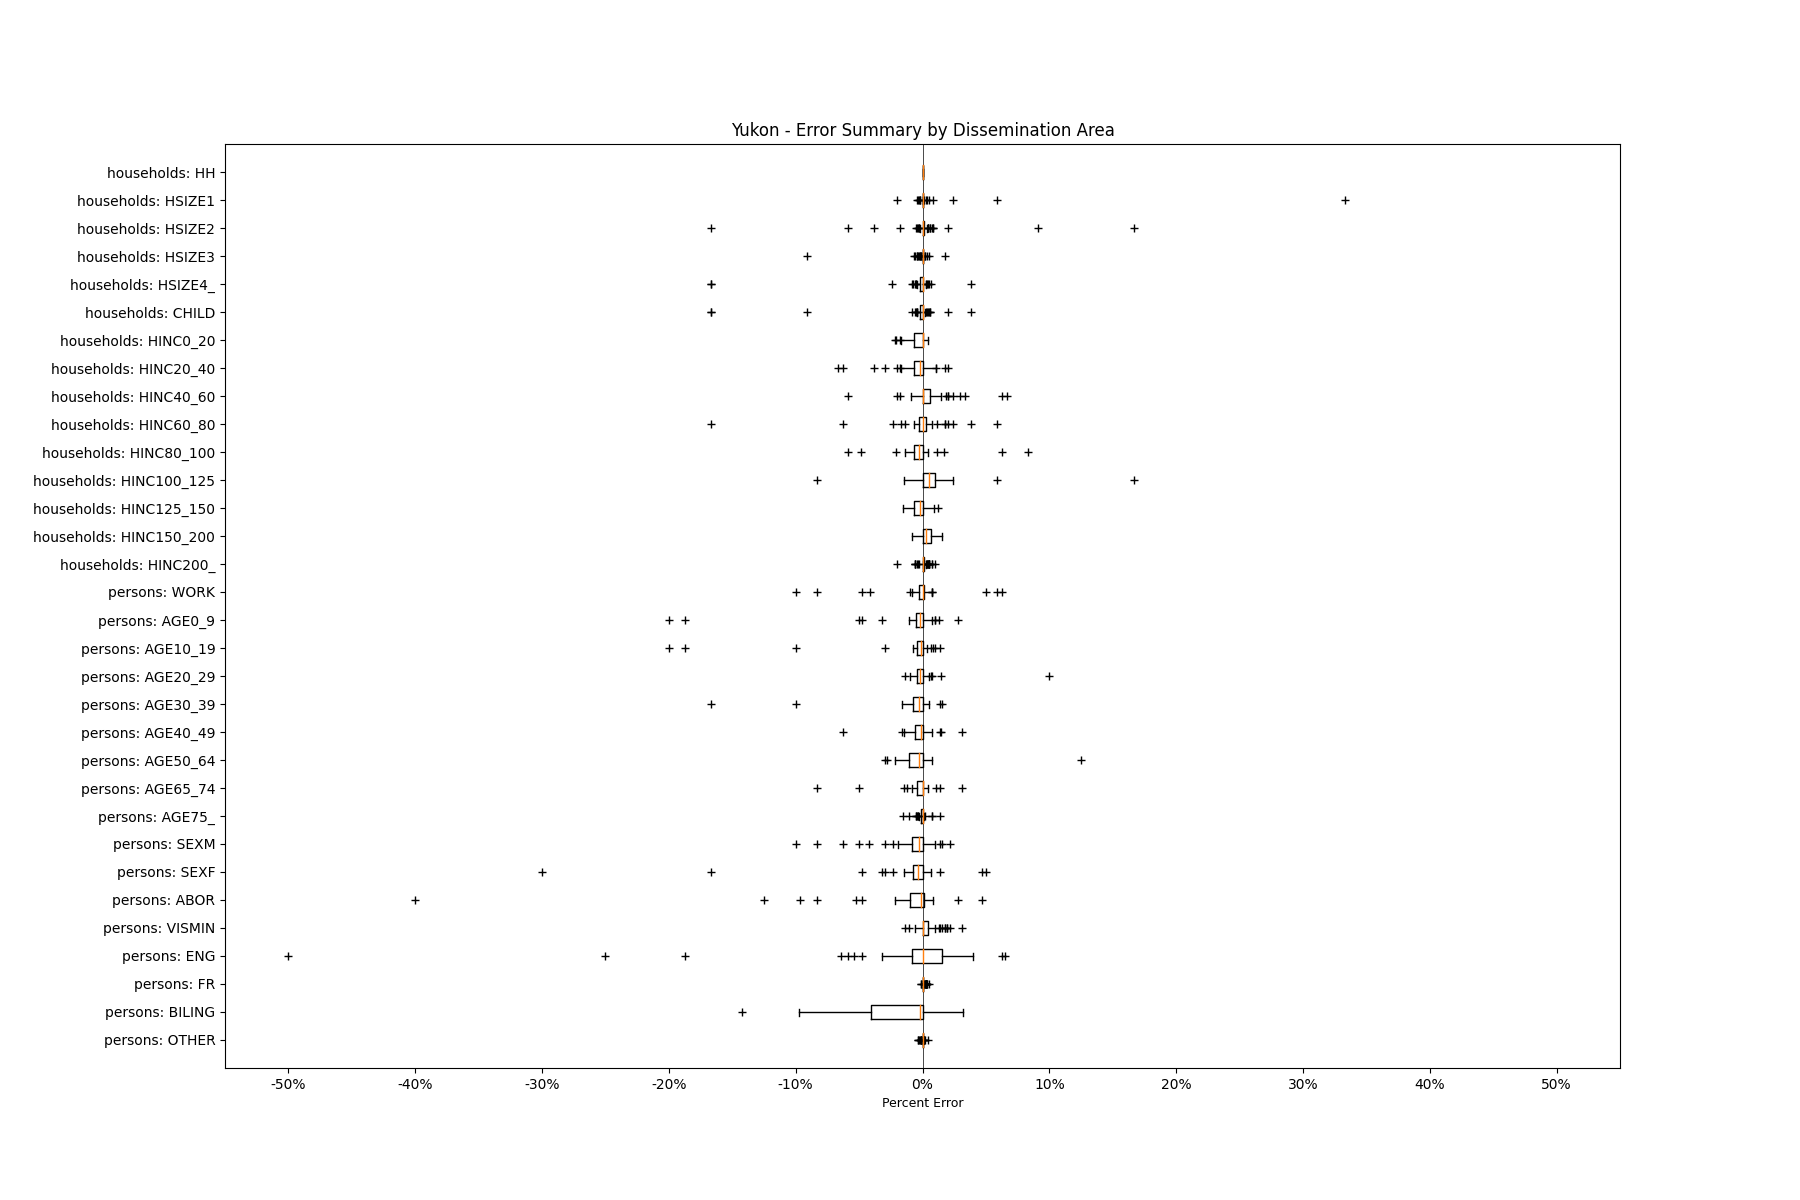
State Level Summary Validation Summaries
Alberta |
British Columbia |
Manitoba |
New Brunswick |
Newfoundland and Labrador |
Northwest Territories |
Nova Scotia |
Nunavut |
Ontario |
Prince Edward Island |
Quebec |
Saskatchewan |
Yukon
Updated 27 days ago