Placecast™ Airport Enplanements
Motionworks Placecast™ products provides insights for Places and Regions since 2019.
Airport Enplanements
Motionworks Placecast™ provides visits and enplanements at airport since 2019. These insights are produced with the Motionworks Population Intelligence Platform. Placecast™ is used for investigating visitation trends at locations through time.
The following document provides an overview of the validation of Motionworks Airport Enplanements. Motionworks measures visitation and enplanements at 302 airports. Airport visitation and enplanement estimates are scaled to BTS enplanements (BTS | Transtats Airports ). The figure below indicates the distribution of all Motionworks airports across the United States.
Airport Stats
| Top 25 Airports by BTS Enplanements | BTS Passenger Rank | Motionworks Monthly Passengers (Oct 2025) | Motionworks Monthly Passengers (Jul 2025) | BTS Monthly Passengers (Jul 2025) | Difference Ratio (%) | Motionworks Monthly Passengers (Oct 2024) | BTS Monthly Passengers (Oct 2024) |
|---|---|---|---|---|---|---|---|
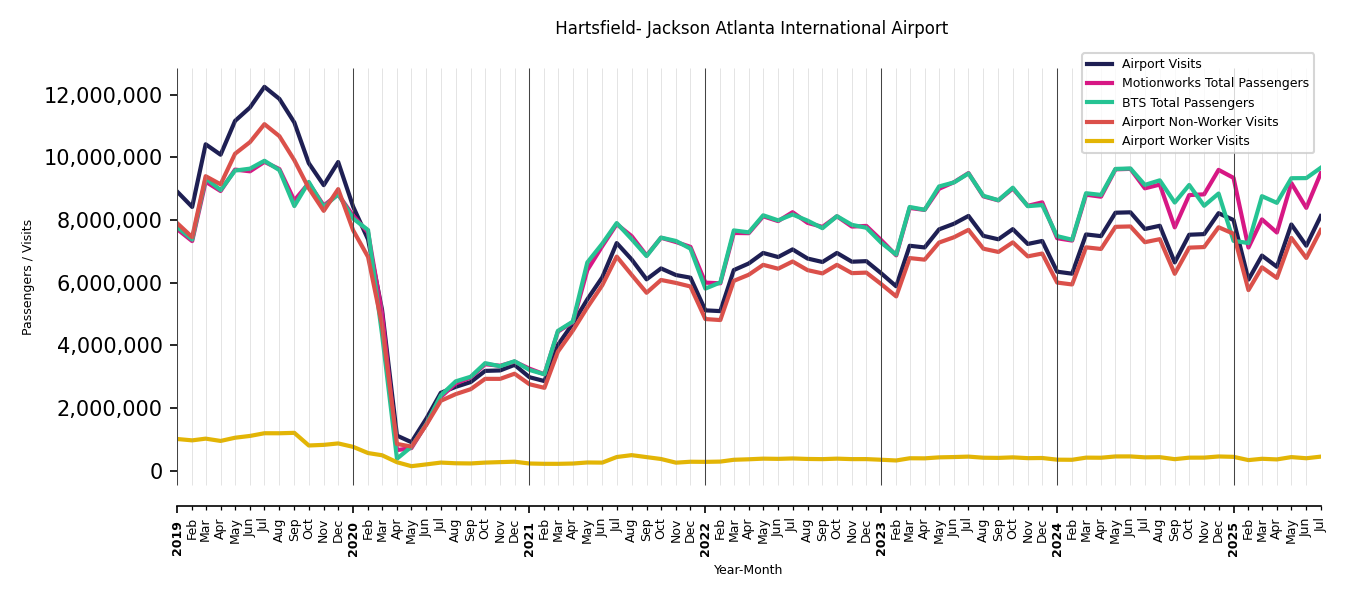
| Hartsfield- Jackson Atlanta International Airport | 1 / 302 | 10,118,074 | 9,494,197 | 9,669,069 | -1.8% | 8,798,383 | 9,120,902 |
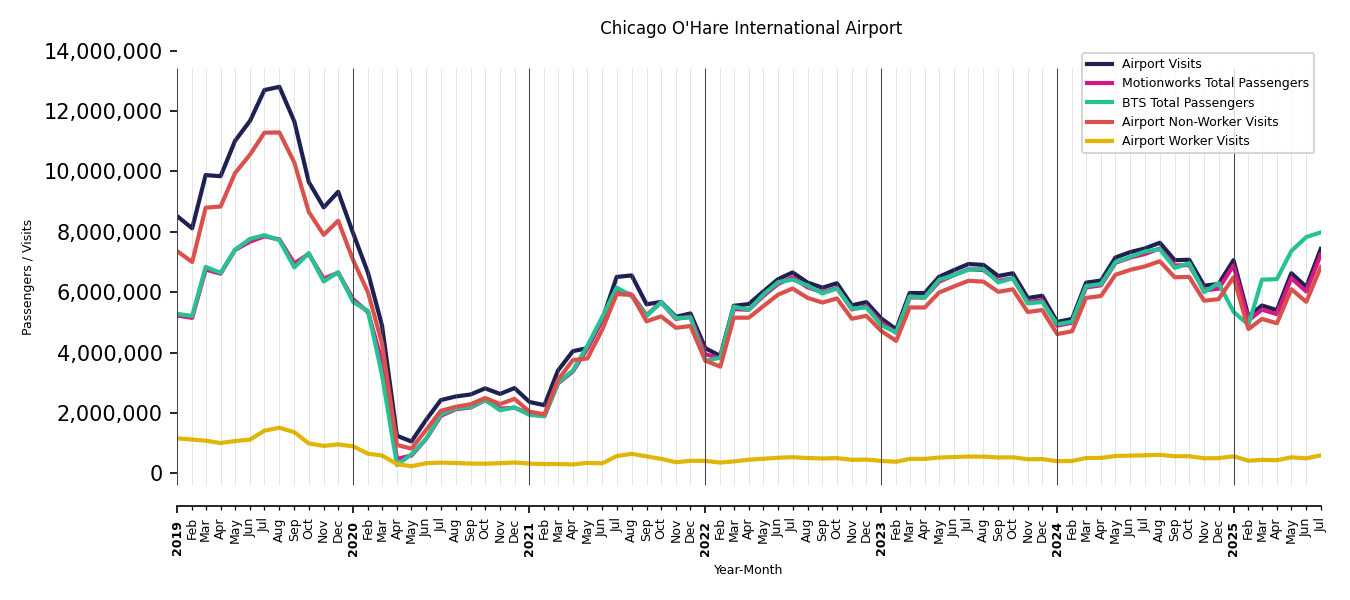
| Chicago O'Hare International Airport | 2 / 302 | 8,365,729 | 7,244,290 | 7,979,865 | -9.2% | 6,898,230 | 6,958,228 |
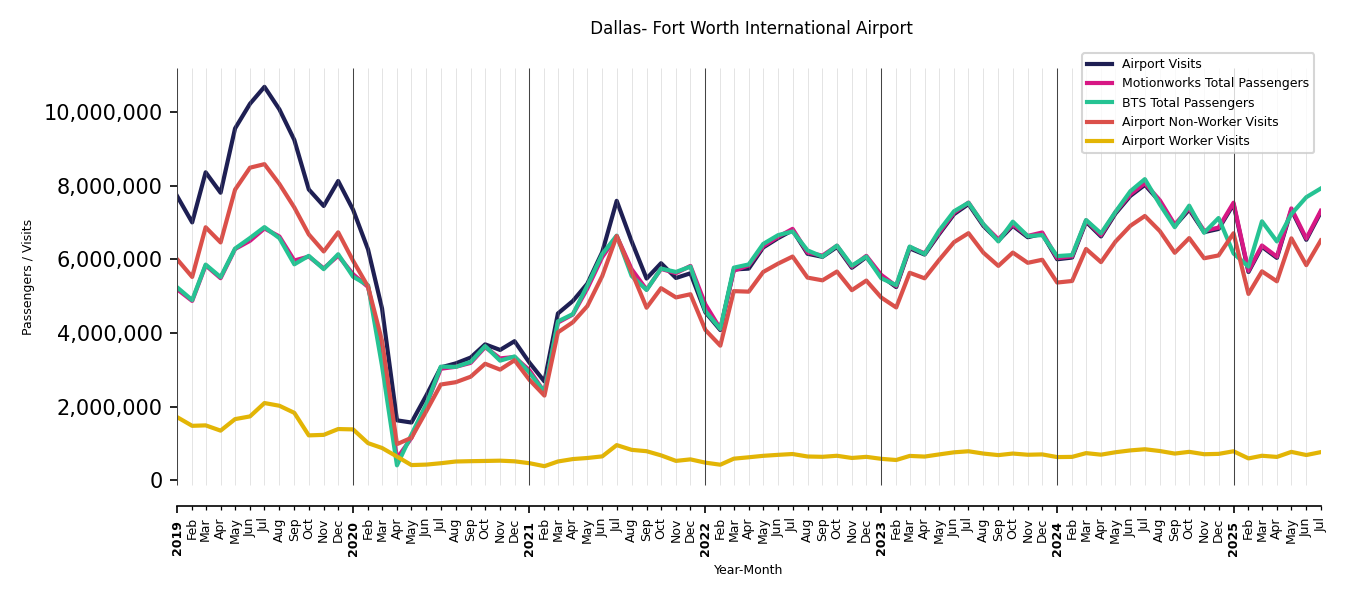
| Dallas- Fort Worth International Airport | 3 / 302 | 8,271,032 | 7,314,476 | 7,920,050 | -7.6% | 7,387,697 | 7,454,258 |
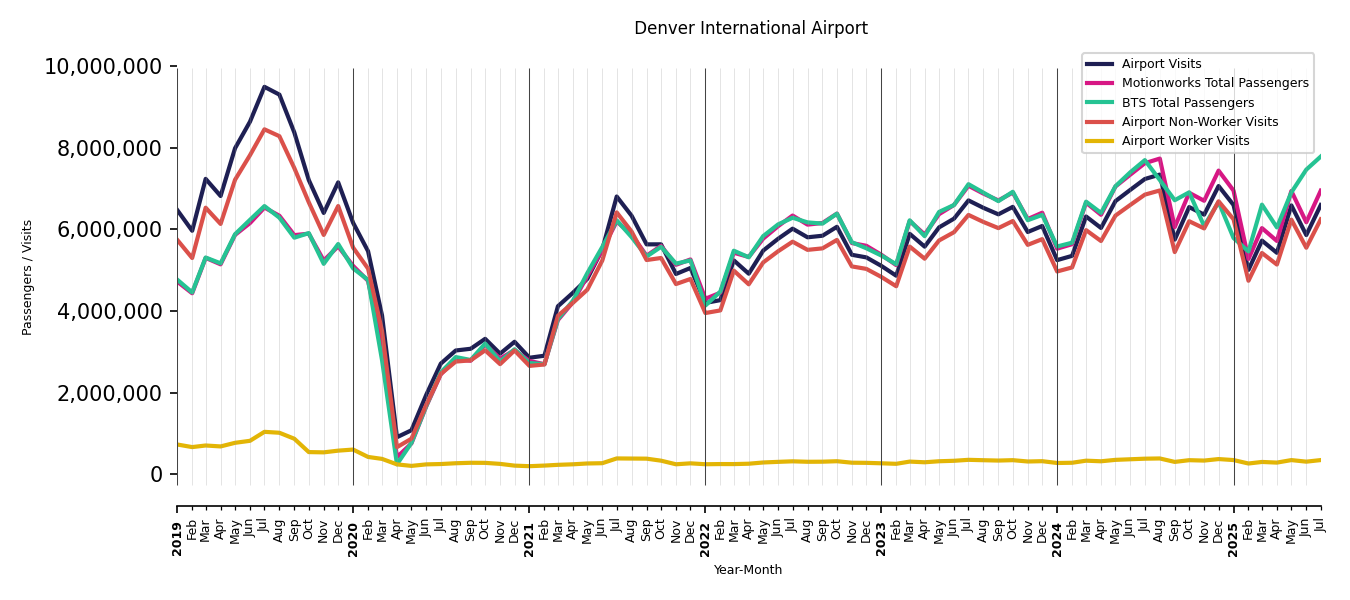
| Denver International Airport | 4 / 302 | 8,073,694 | 6,950,935 | 7,786,510 | -10.7% | 6,898,582 | 6,909,908 |
| Los Angeles International Airport | 5 / 302 | 7,306,908 | 6,506,556 | 7,015,697 | -7.3% | 6,283,969 | 6,422,490 |
| John F Kennedy International Airport | 6 / 302 | 6,732,266 | 5,996,712 | 5,917,167 | 1.3% | 5,316,094 | 5,408,133 |
| Seattle - Tacoma International Airport | 7 / 302 | 5,429,951 | 4,471,473 | 5,354,872 | -16.5% | 4,705,183 | 4,259,237 |
| San Francisco International Airport | 8 / 302 | 5,272,199 | 4,740,092 | 5,031,329 | -5.8% | 4,448,515 | 4,503,580 |
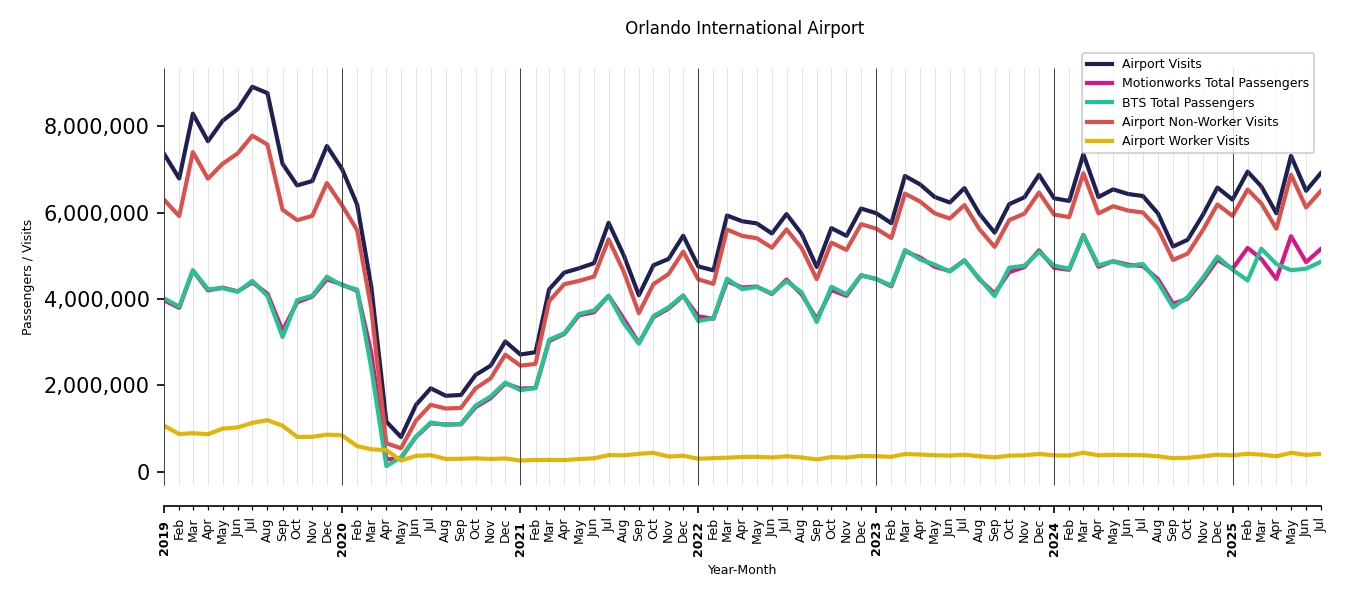
| Orlando International Airport | 9 / 302 | 5,073,138 | 5,157,184 | 4,863,109 | 6.0% | 4,007,005 | 4,043,464 |
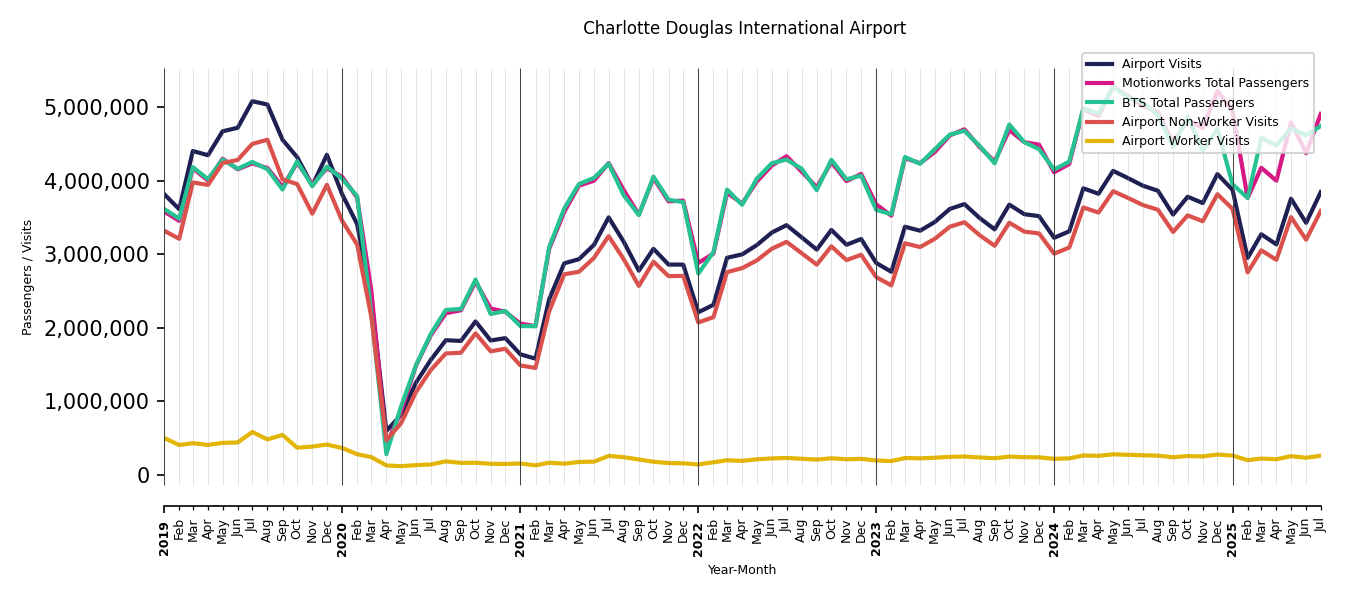
| Charlotte Douglas International Airport | 10 / 302 | 5,027,439 | 4,911,680 | 4,747,596 | 3.5% | 4,830,939 | 4,870,816 |
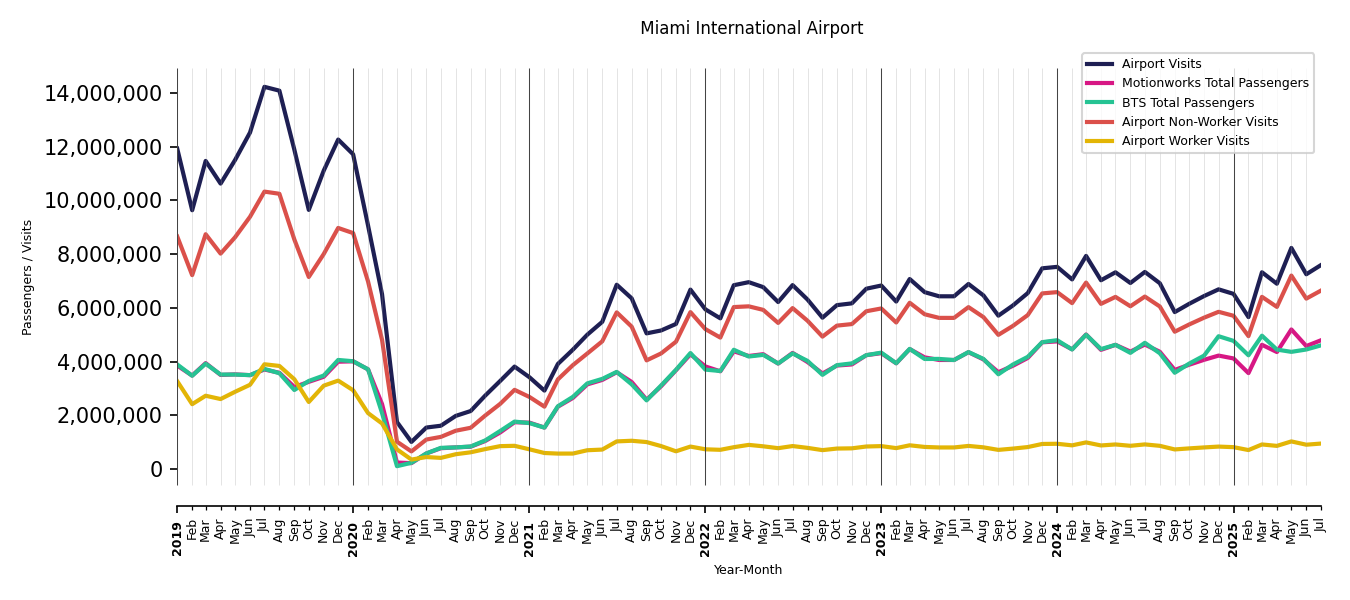
| Miami International Airport | 11 / 302 | 4,798,543 | 4,790,558 | 4,602,186 | 4.1% | 3,883,585 | 3,925,583 |
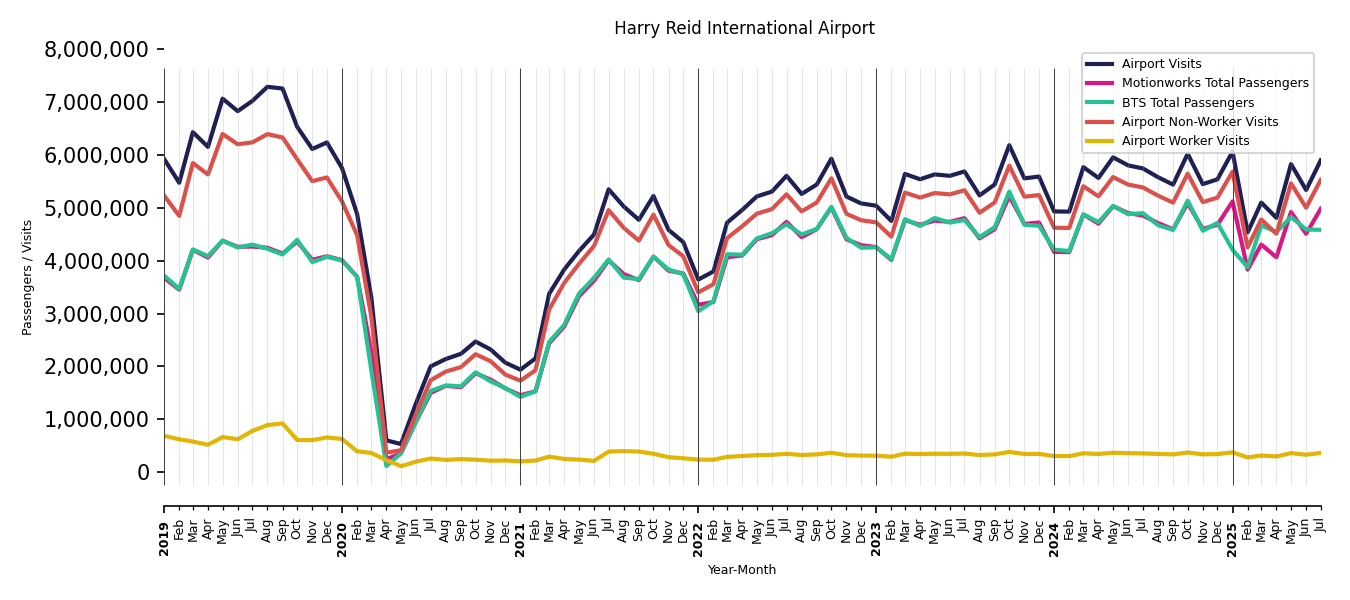
| Harry Reid International Airport | 12 / 302 | 5,068,897 | 4,979,466 | 4,581,337 | 8.7% | 5,083,105 | 5,133,305 |
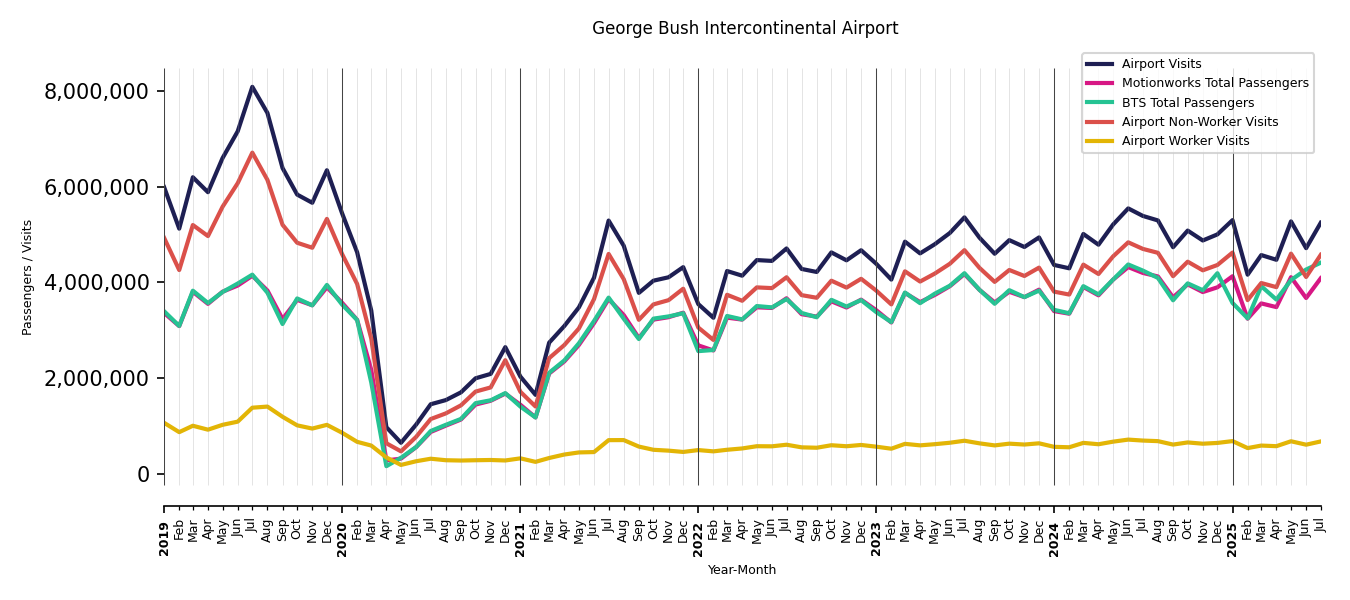
| George Bush Intercontinental Airport | 13 / 302 | 4,598,223 | 4,082,636 | 4,408,382 | -7.4% | 3,955,235 | 3,976,120 |
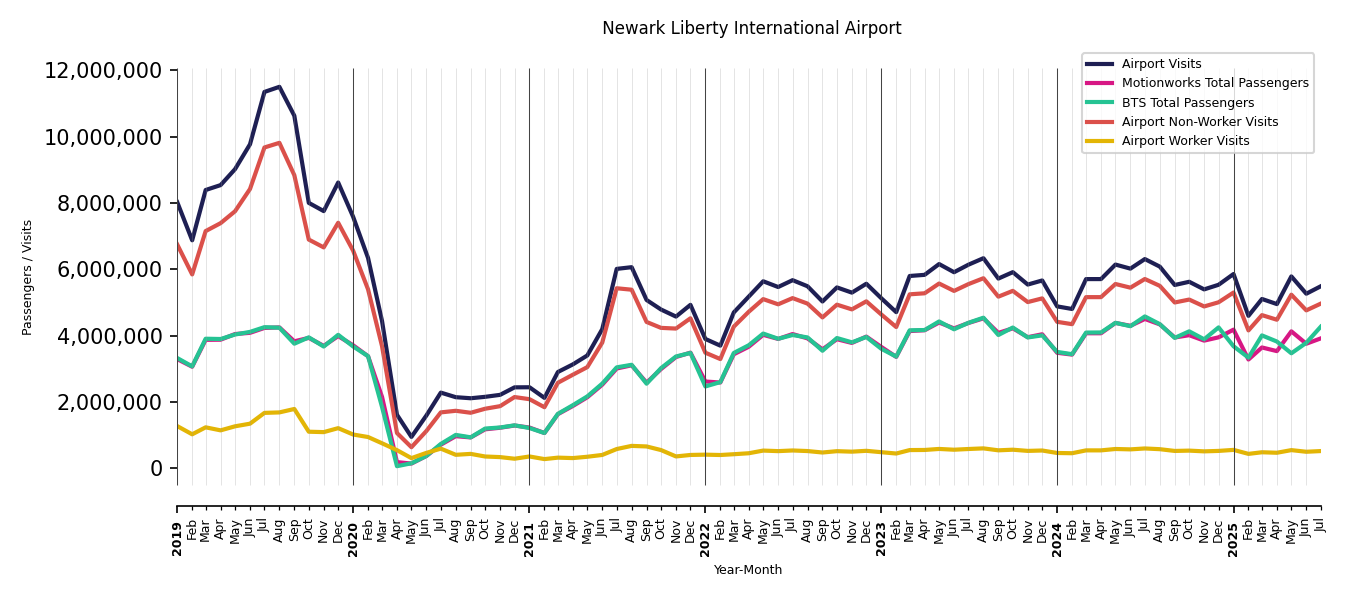
| Newark Liberty International Airport | 14 / 302 | 4,238,800 | 3,918,200 | 4,270,615 | -8.3% | 4,014,918 | 4,131,337 |
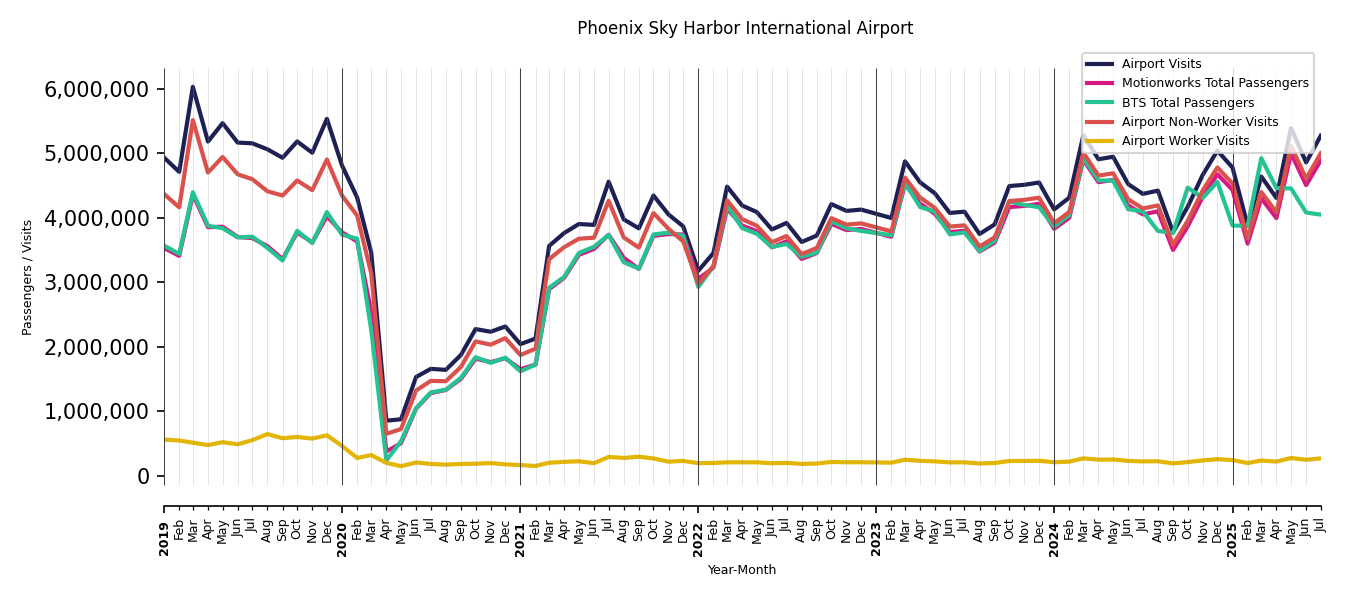
| Phoenix Sky Harbor International Airport | 15 / 302 | 4,618,123 | 4,890,215 | 4,049,606 | 20.8% | 3,867,184 | 4,467,980 |
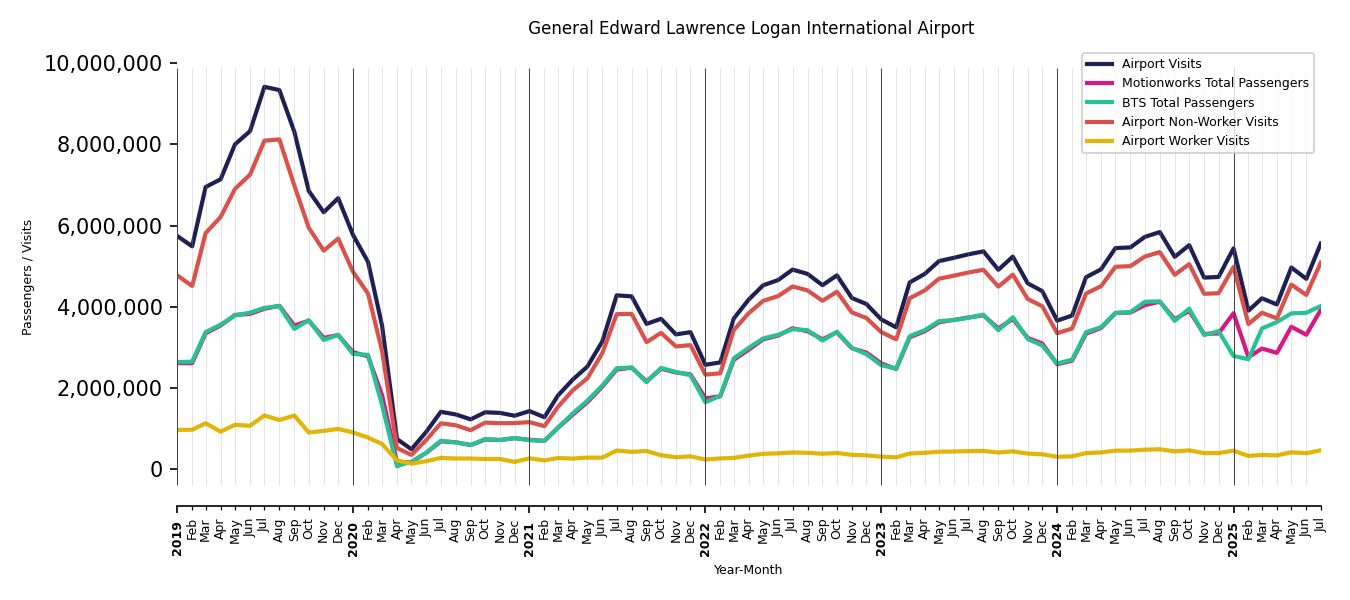
| General Edward Lawrence Logan International Airport | 16 / 302 | 4,186,070 | 3,924,498 | 4,018,292 | -2.3% | 3,897,037 | 3,954,915 |
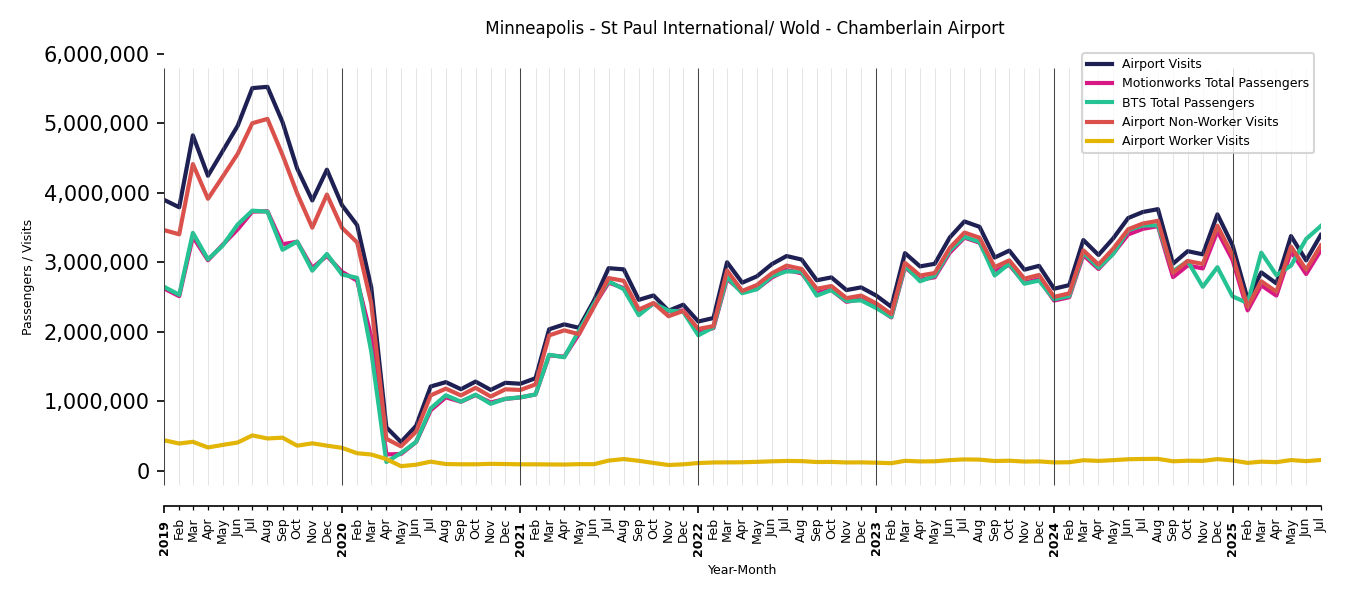
| Minneapolis - St Paul International/ Wold - Chamberlain Airport | 17 / 302 | 3,616,905 | 3,171,940 | 3,521,818 | -9.9% | 2,954,465 | 3,016,969 |
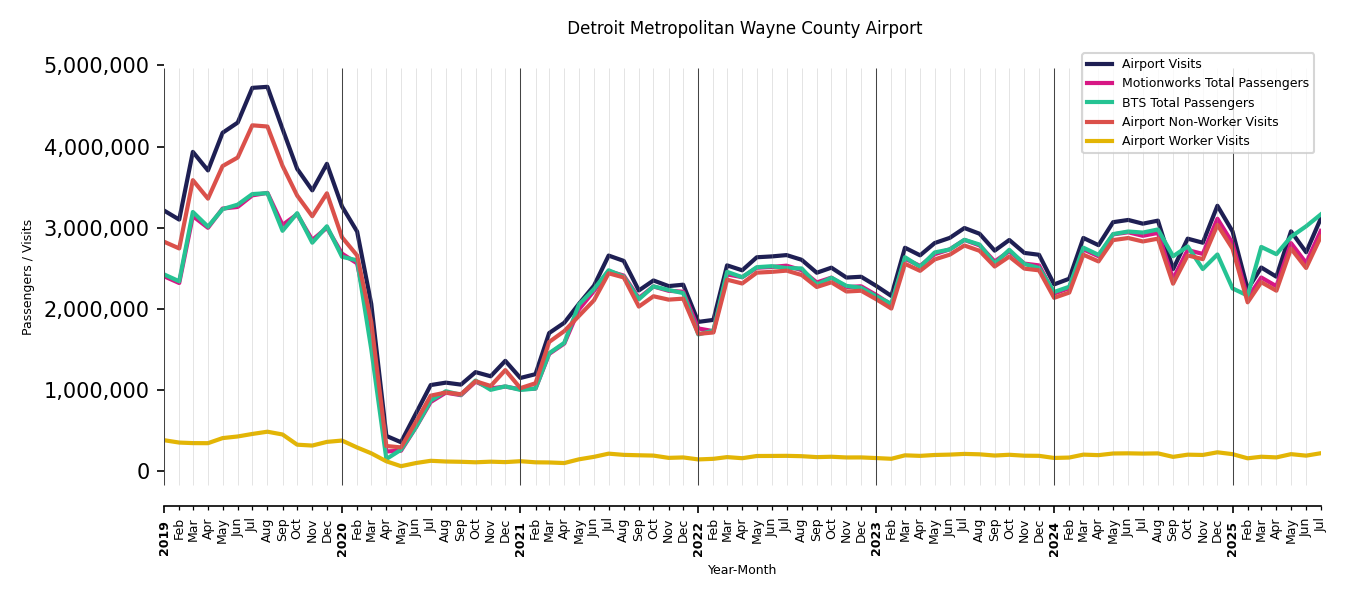
| Detroit Metropolitan Wayne County Airport | 18 / 302 | 3,279,546 | 2,961,319 | 3,164,844 | -6.4% | 2,726,583 | 2,771,014 |
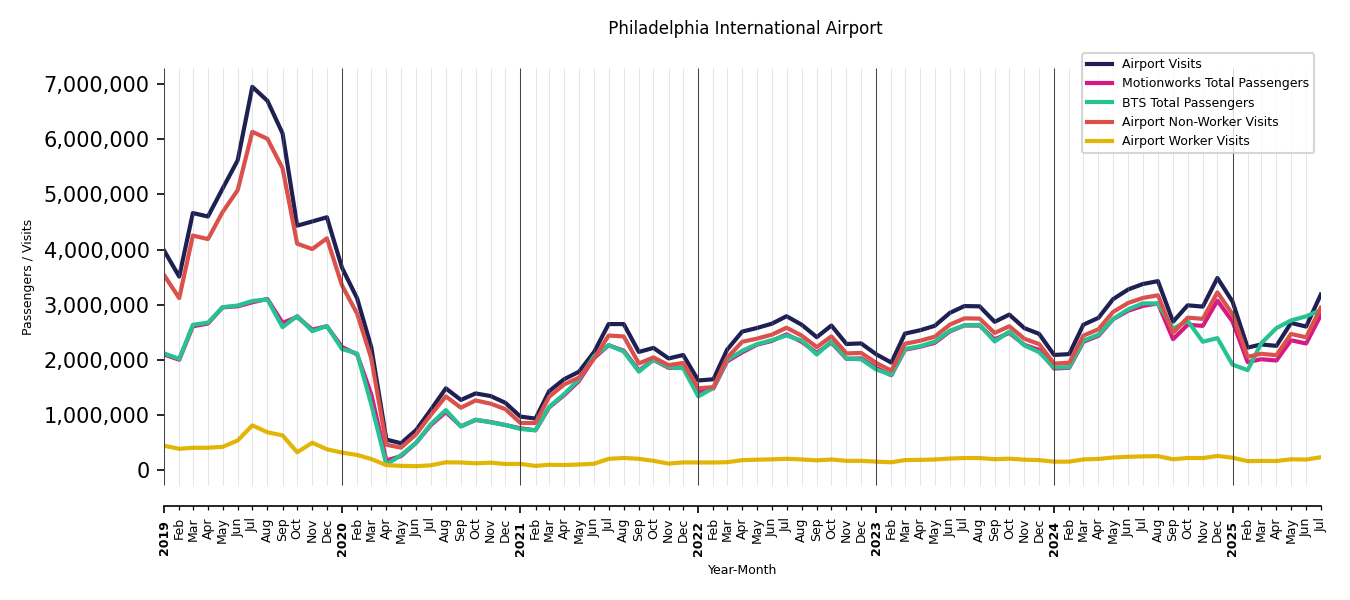
| Philadelphia International Airport | 19 / 302 | 3,024,221 | 2,809,348 | 2,903,951 | -3.3% | 2,638,947 | 2,707,972 |
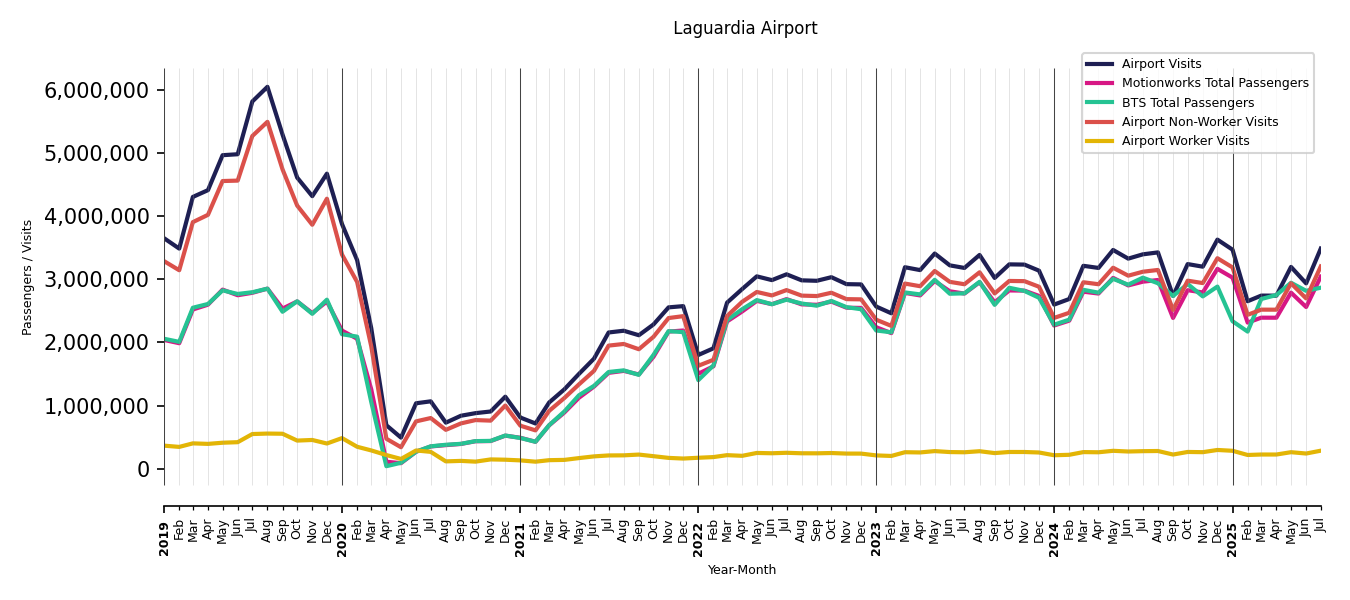
| Laguardia Airport | 20 / 302 | 3,122,394 | 3,043,445 | 2,868,743 | 6.1% | 2,829,454 | 2,927,592 |
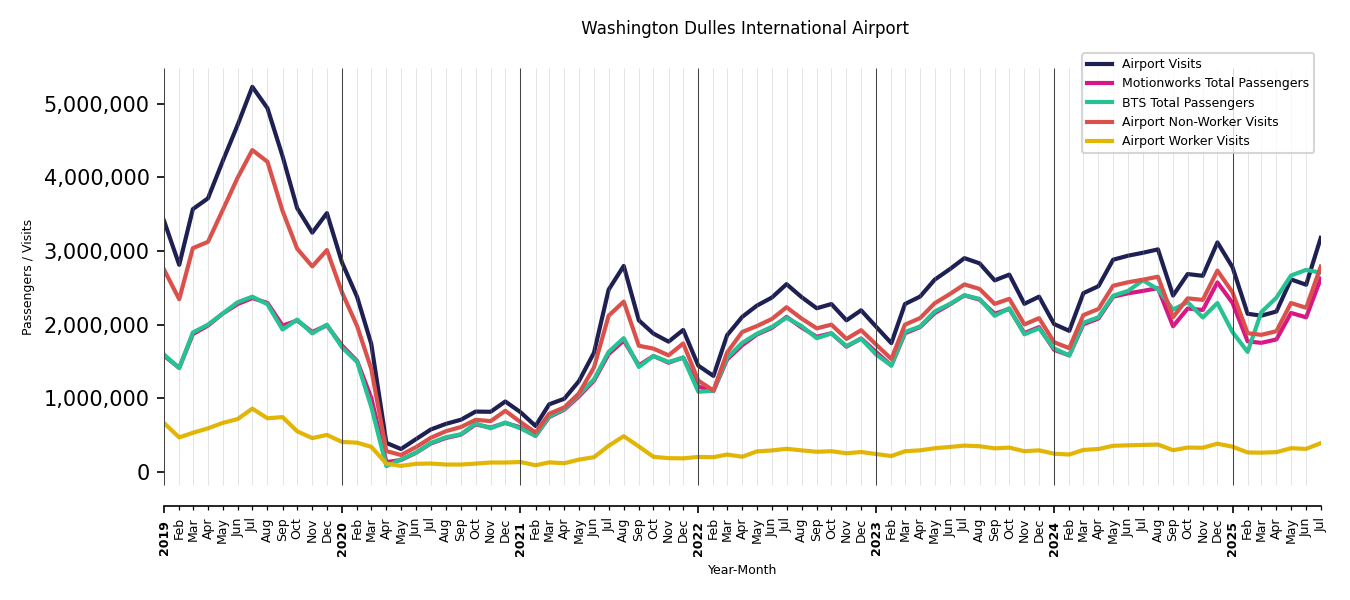
| Washington Dulles International Airport | 21 / 302 | 2,892,601 | 2,624,378 | 2,703,973 | -2.9% | 2,218,686 | 2,304,542 |
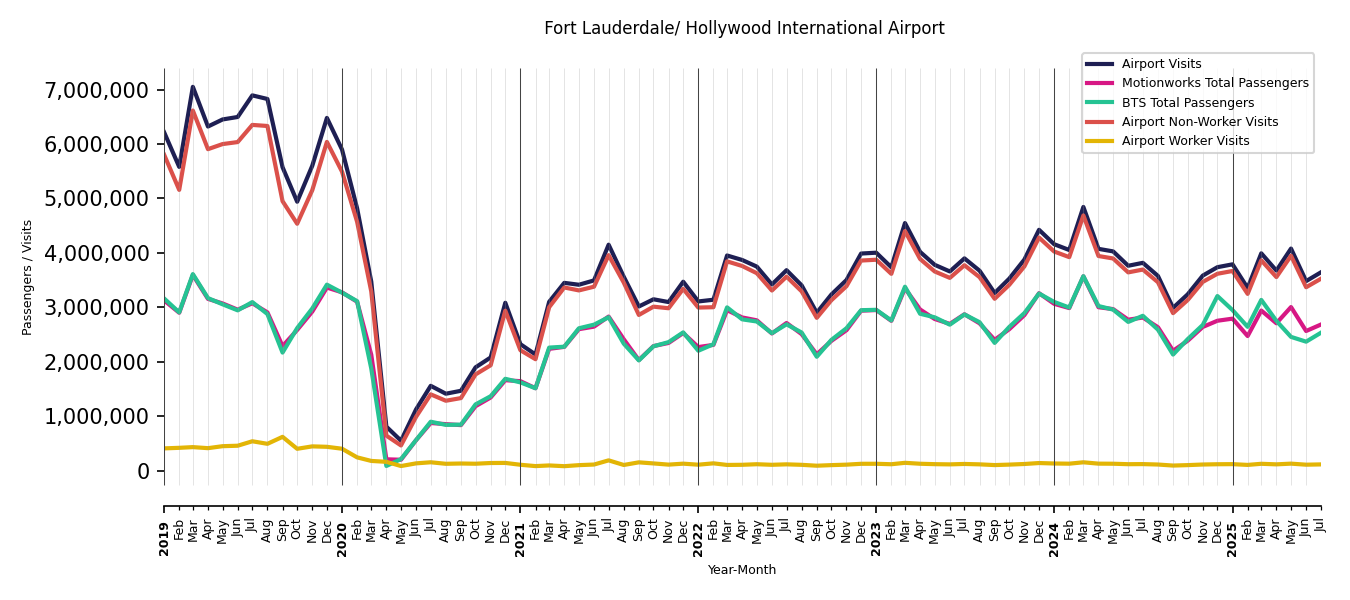
| Fort Lauderdale/ Hollywood International Airport | 22 / 302 | 2,741,687 | 2,684,040 | 2,532,744 | 6.0% | 2,387,653 | 2,417,033 |
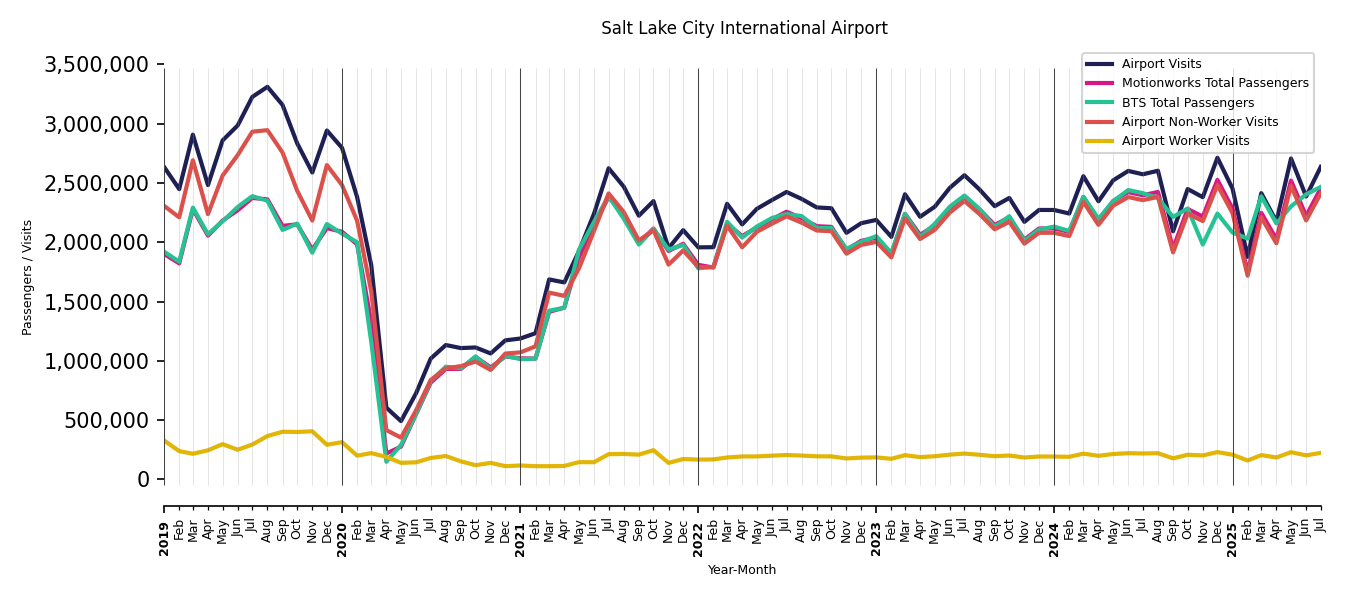
| Salt Lake City International Airport | 23 / 302 | 2,584,887 | 2,454,224 | 2,466,301 | -0.5% | 2,280,300 | 2,284,649 |
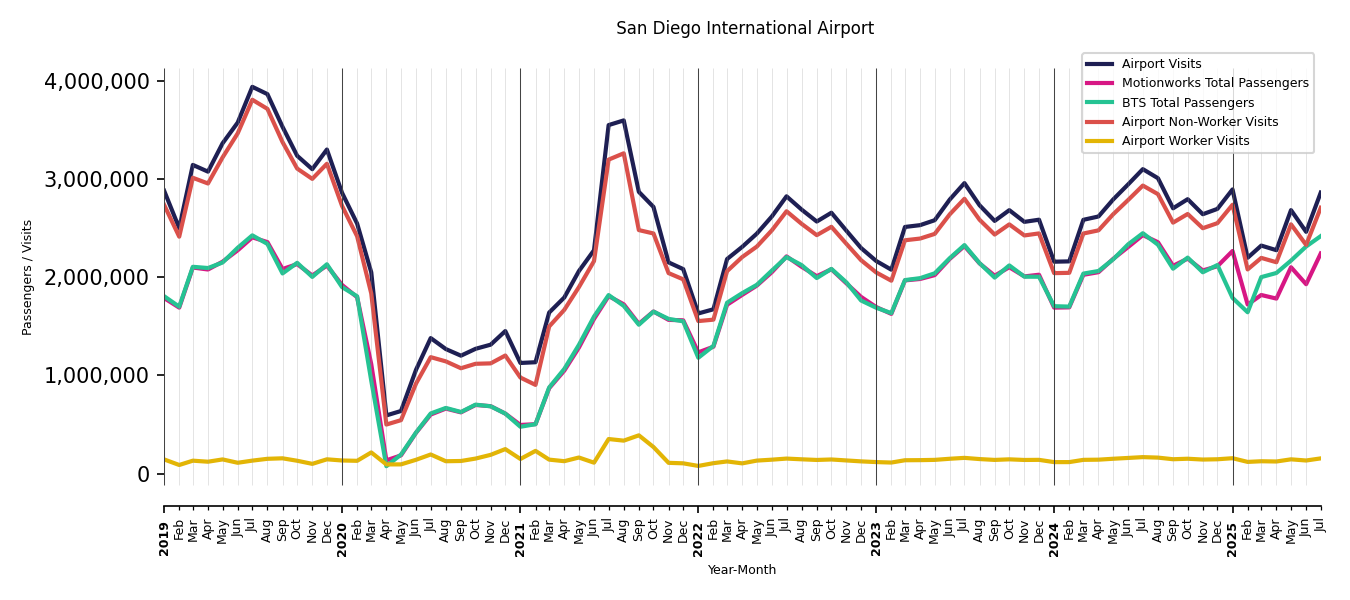
| San Diego International Airport | 24 / 302 | 2,508,417 | 2,243,408 | 2,420,322 | -7.3% | 2,190,771 | 2,201,229 |
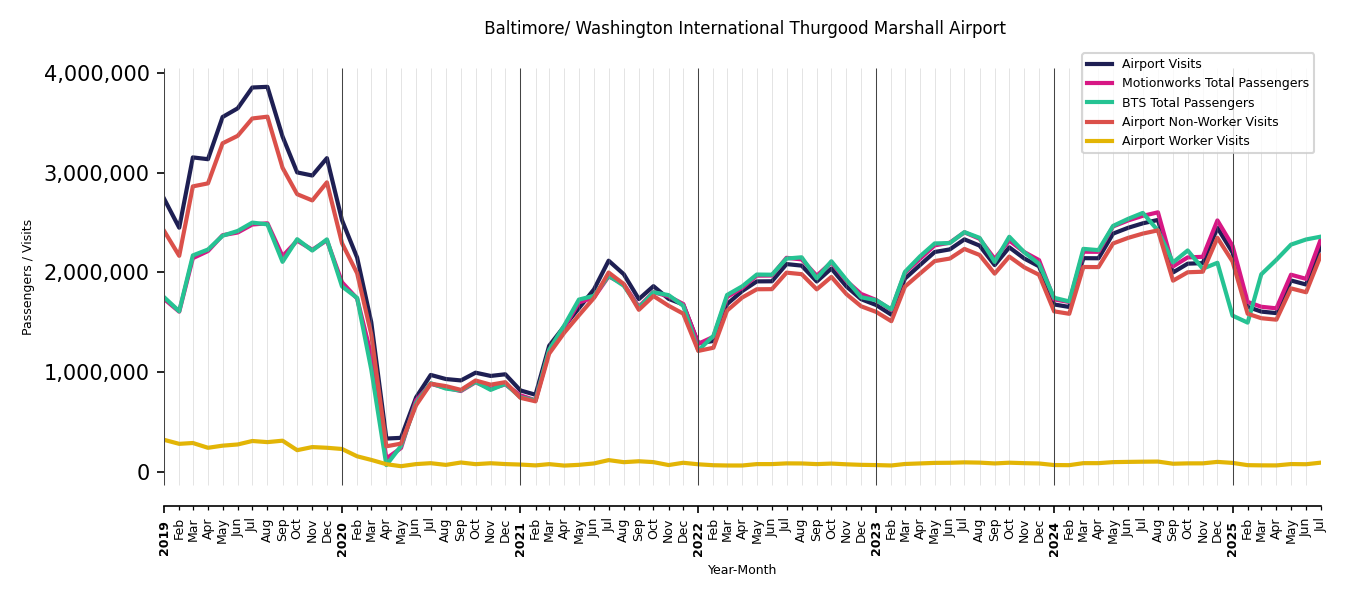
| Baltimore/ Washington International Thurgood Marshall Airport | 25 / 302 | 2,490,496 | 2,330,467 | 2,357,359 | -1.1% | 2,149,653 | 2,219,023 |
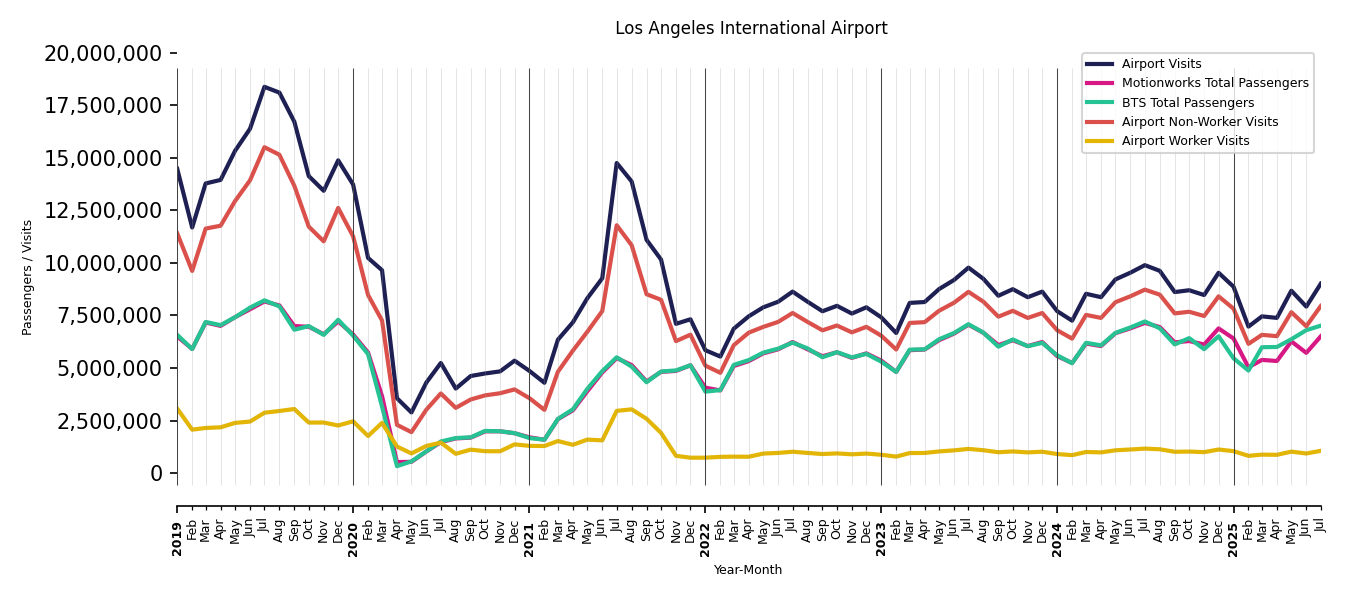
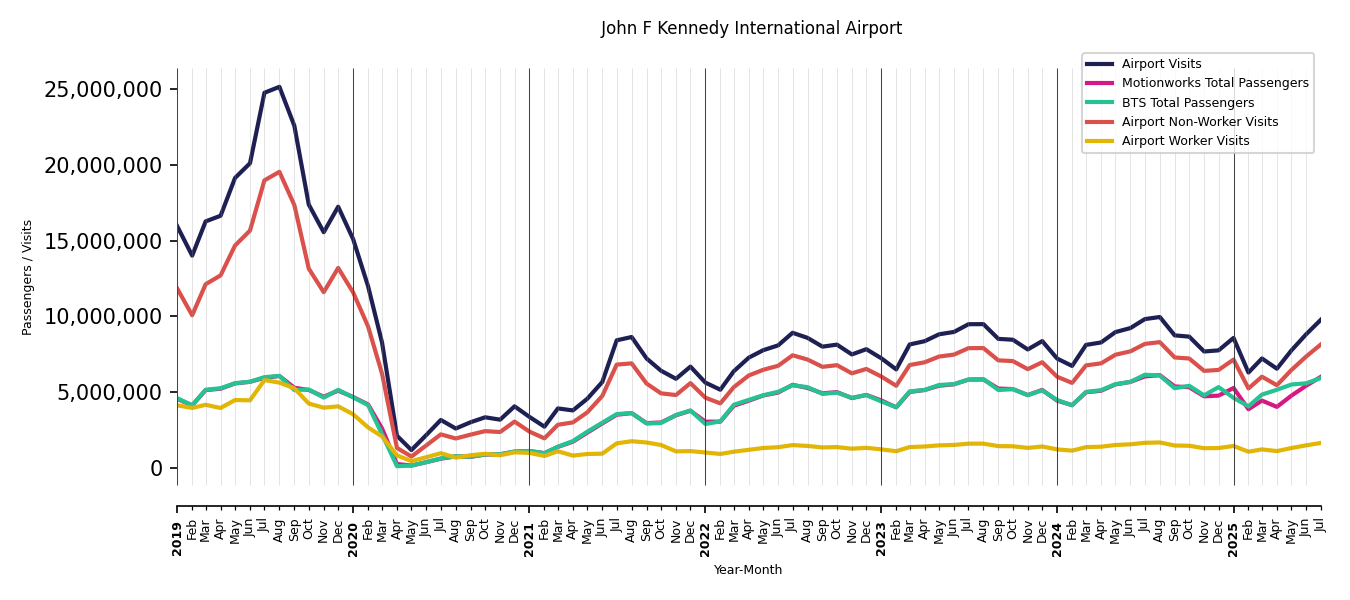
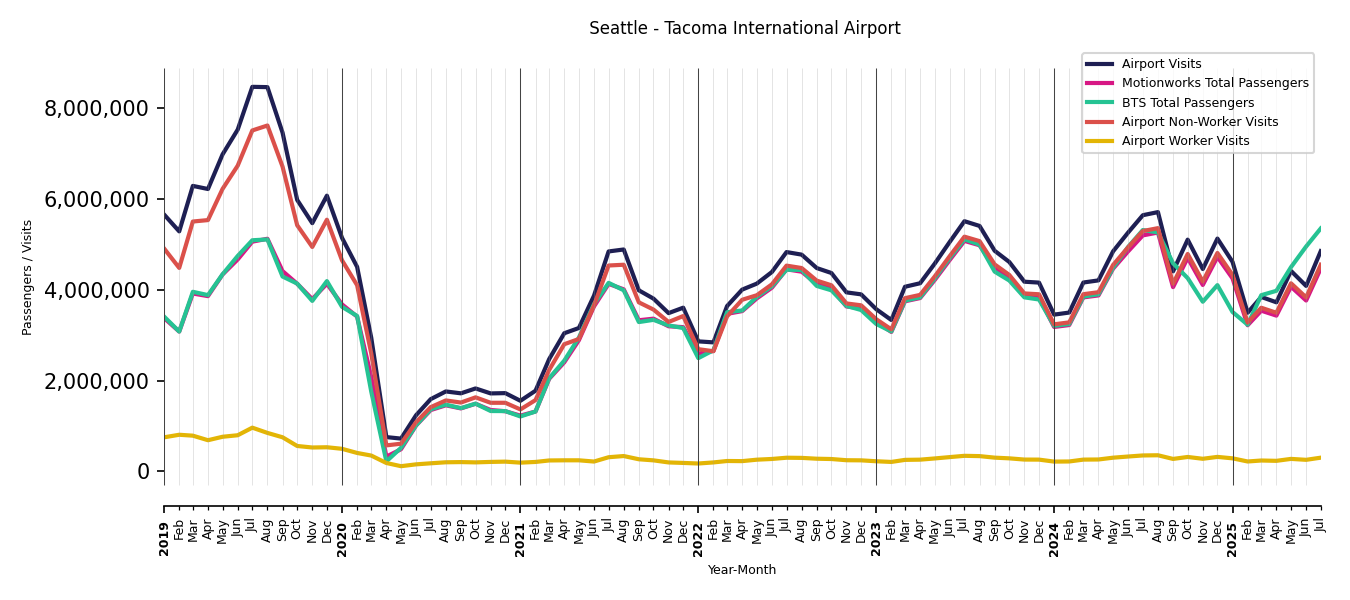
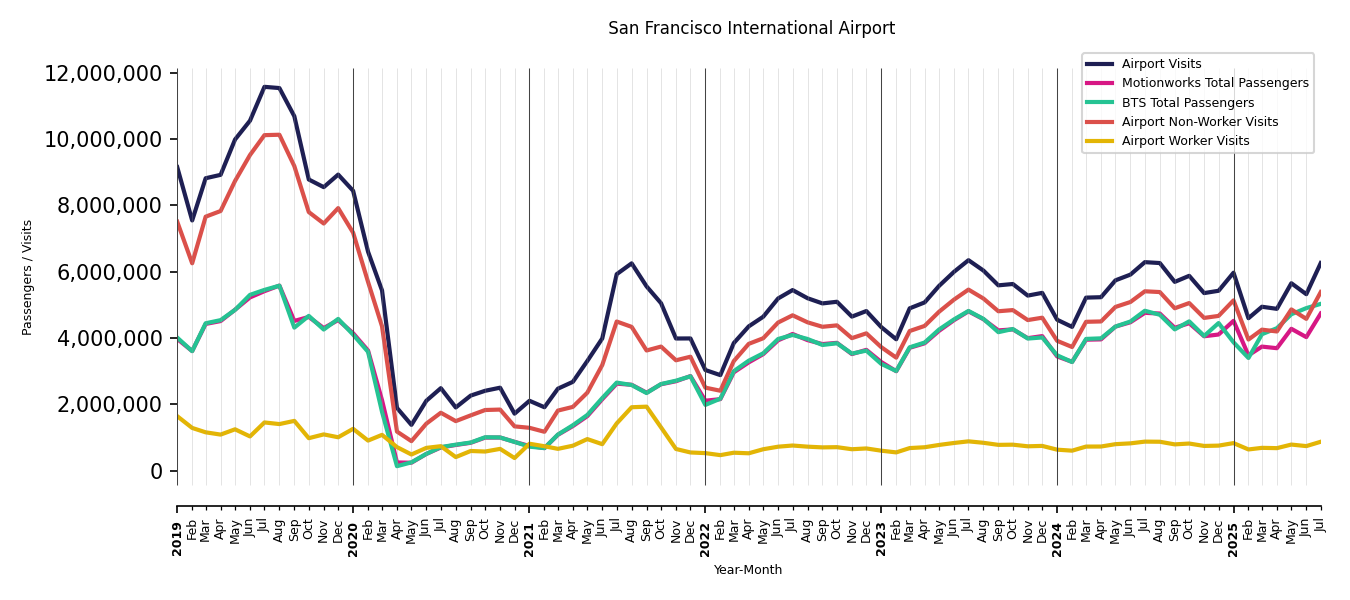
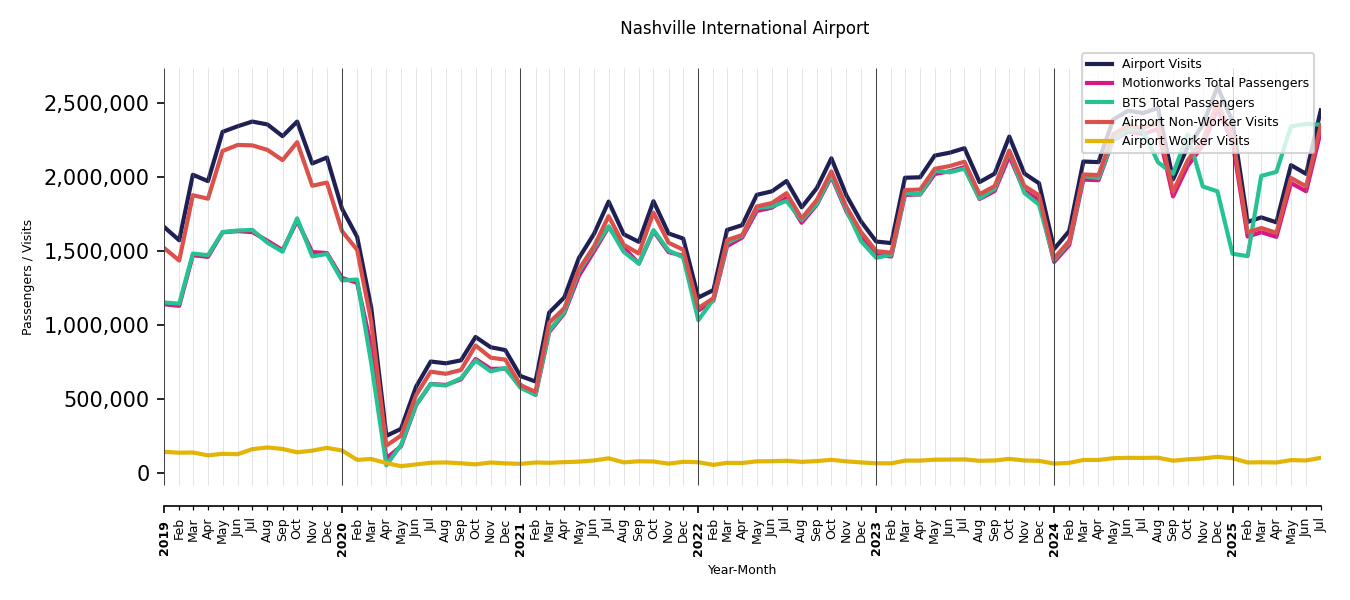
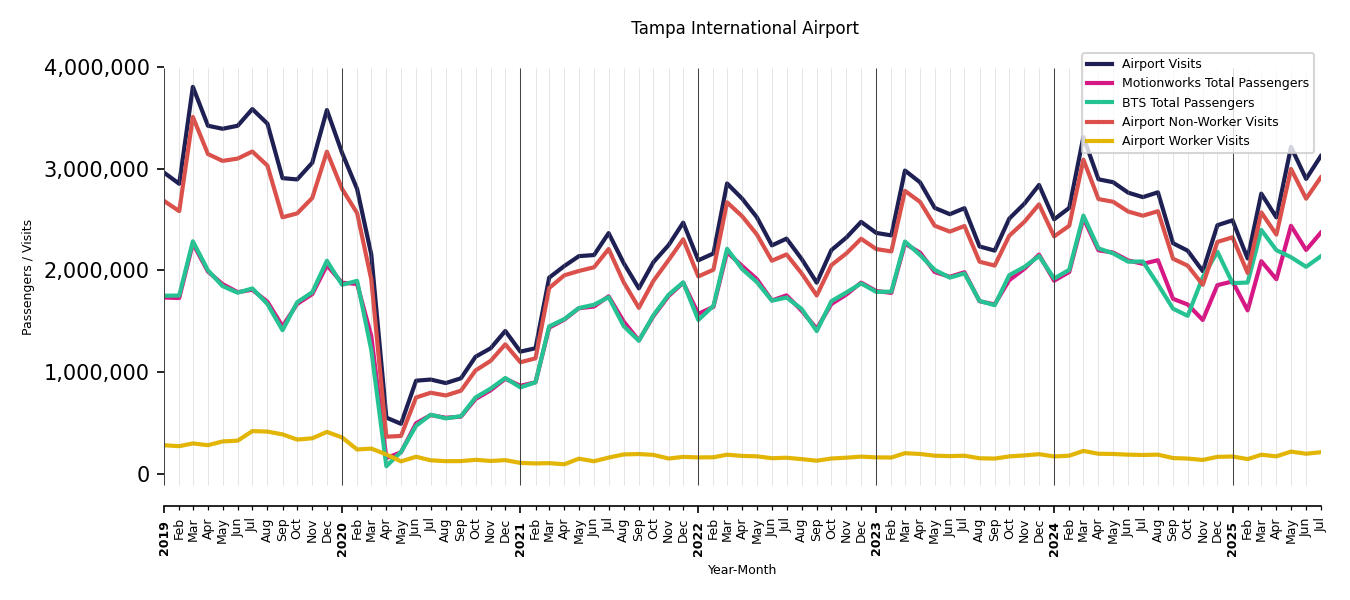
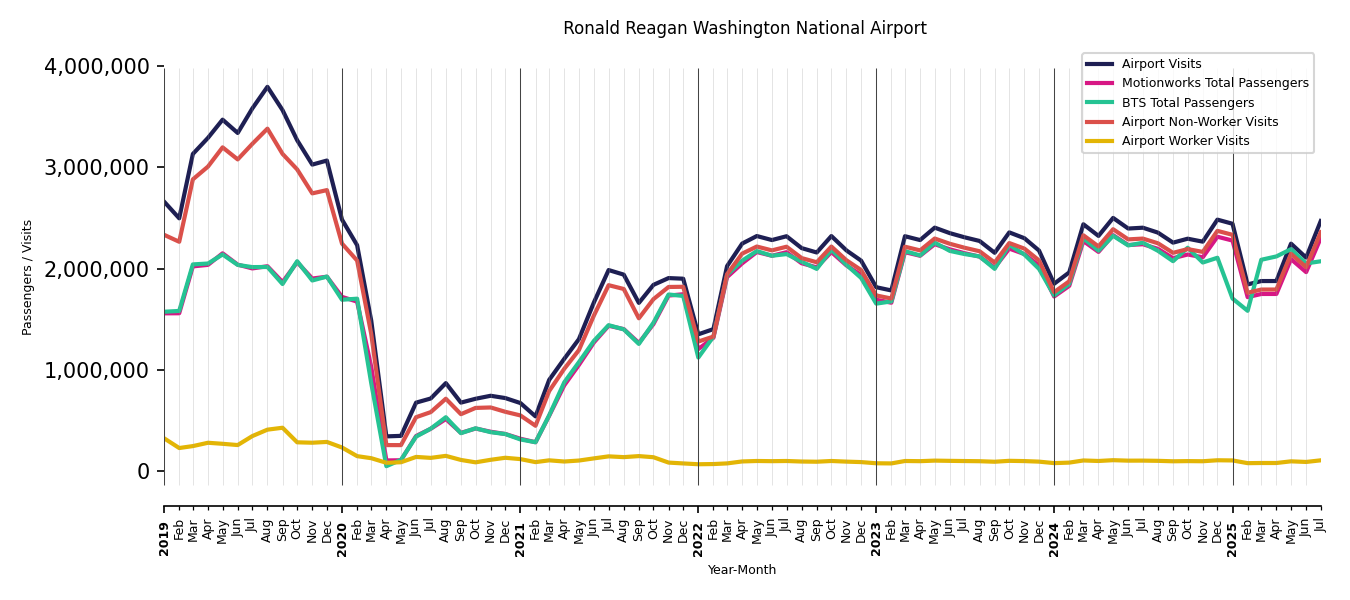
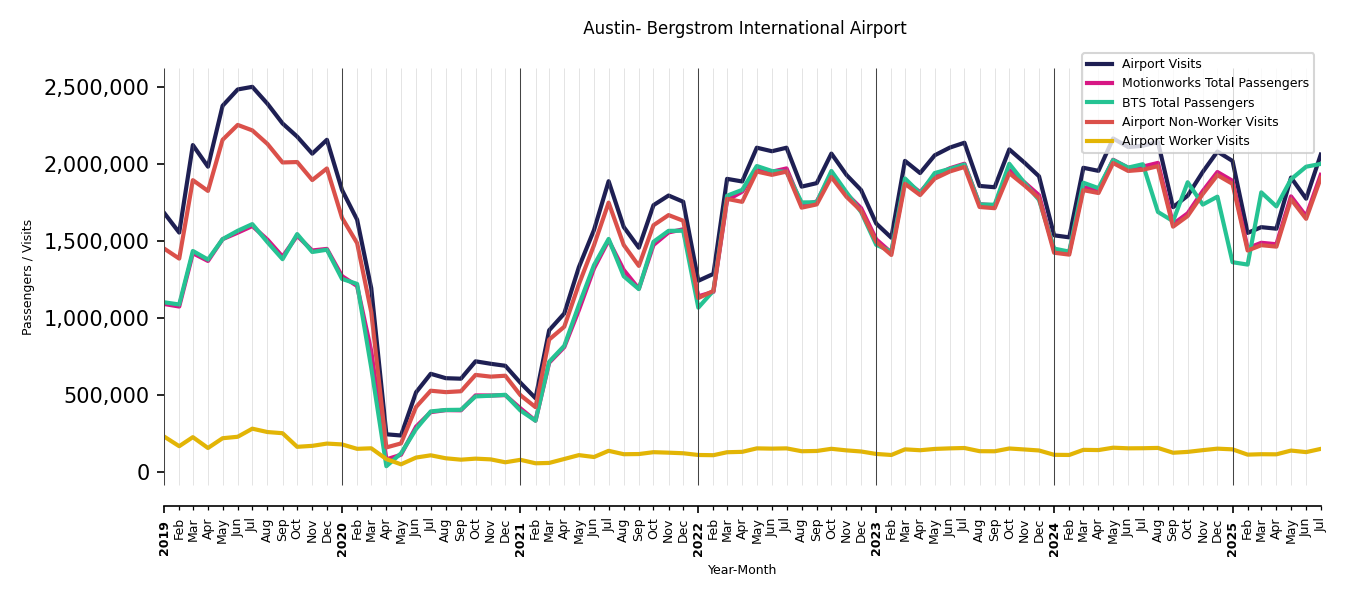
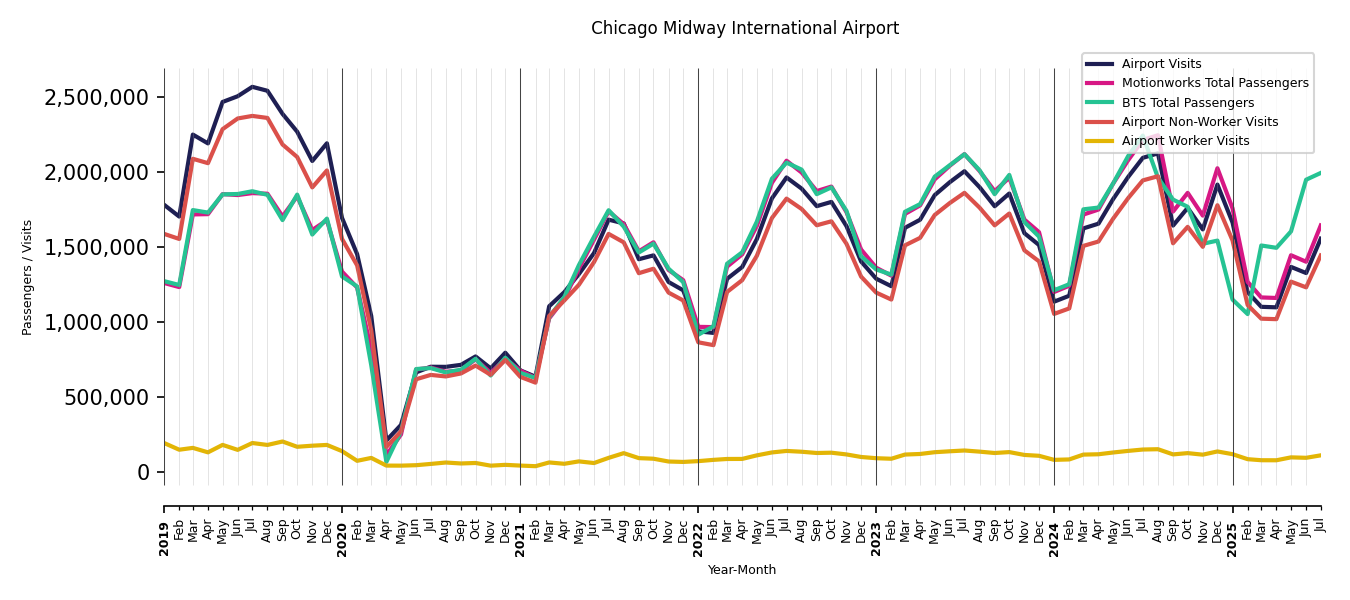
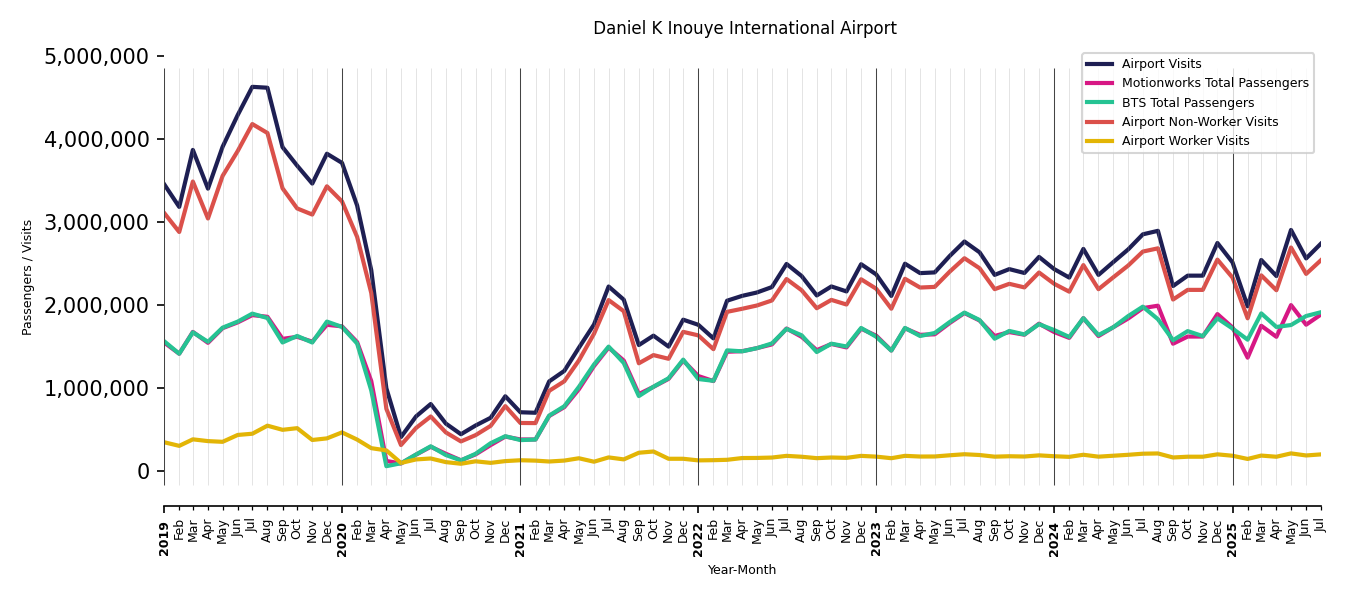
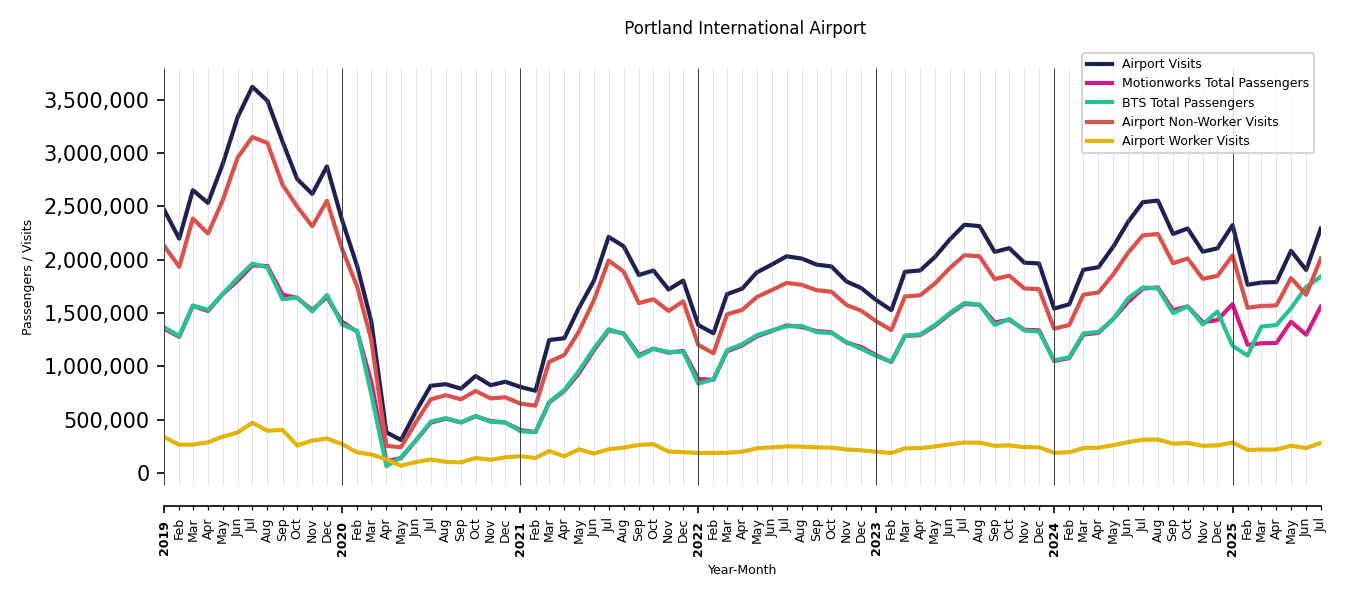
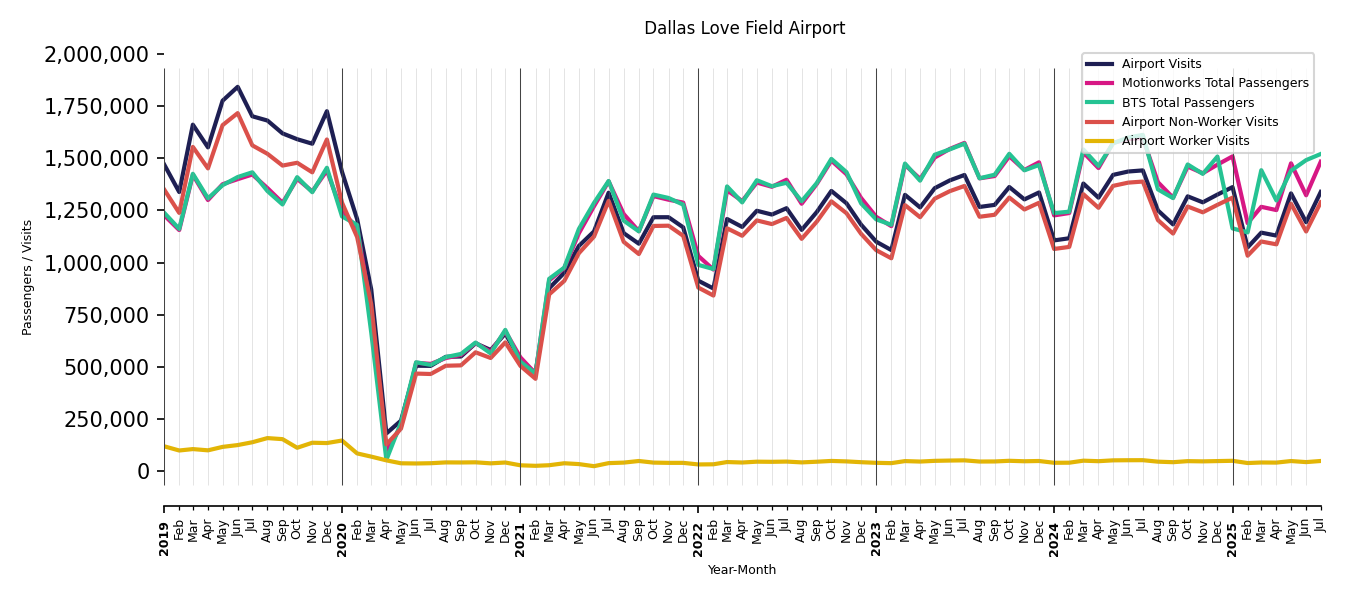
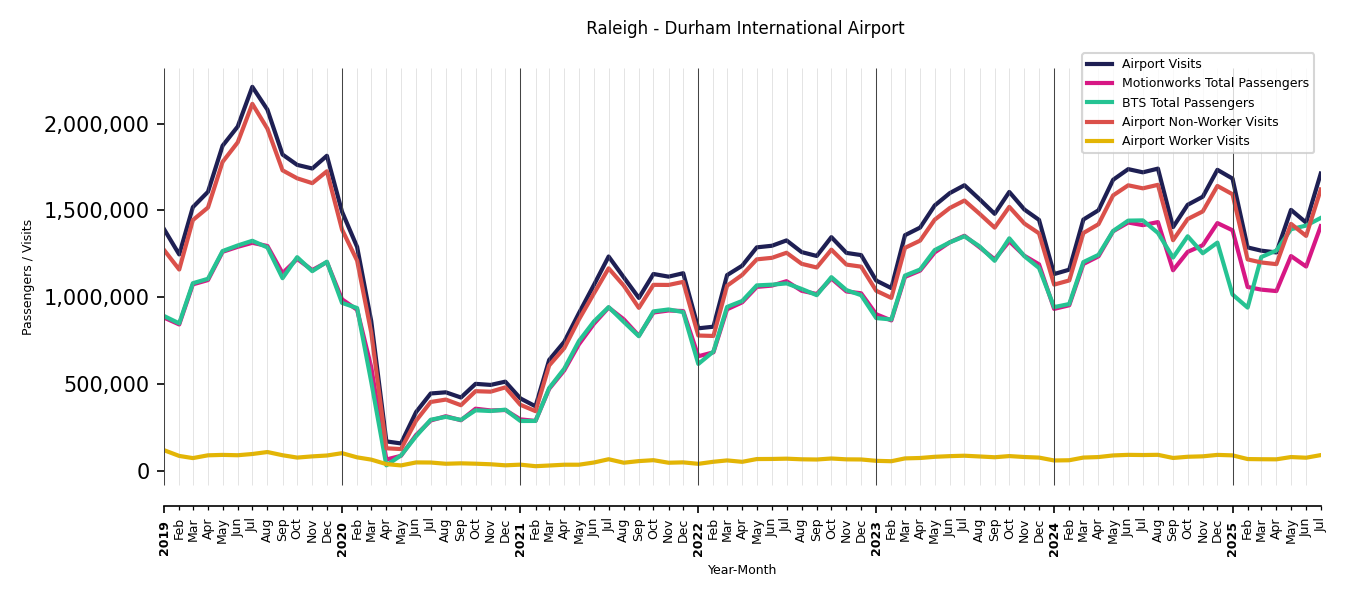
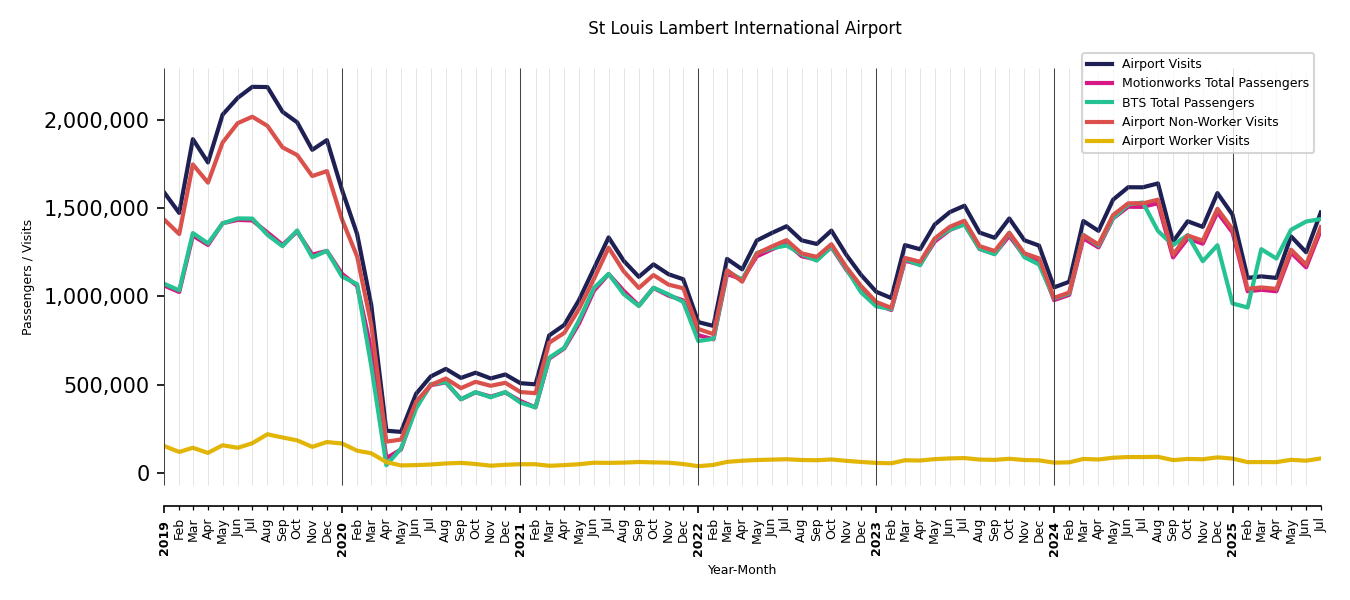
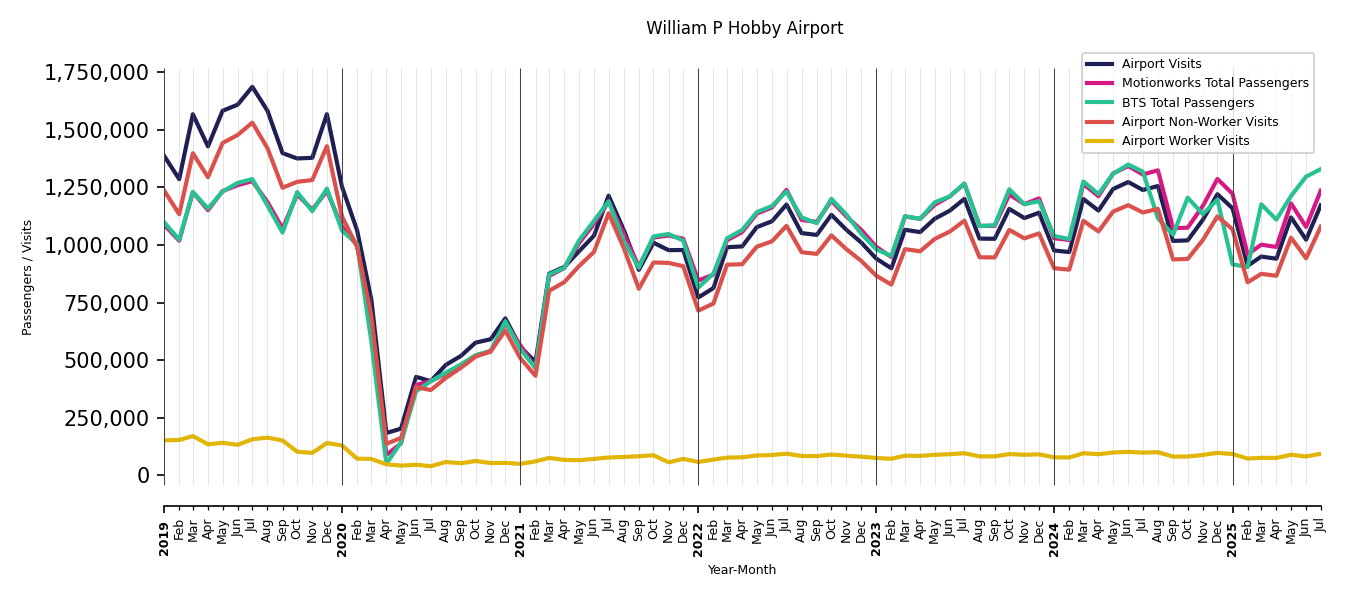
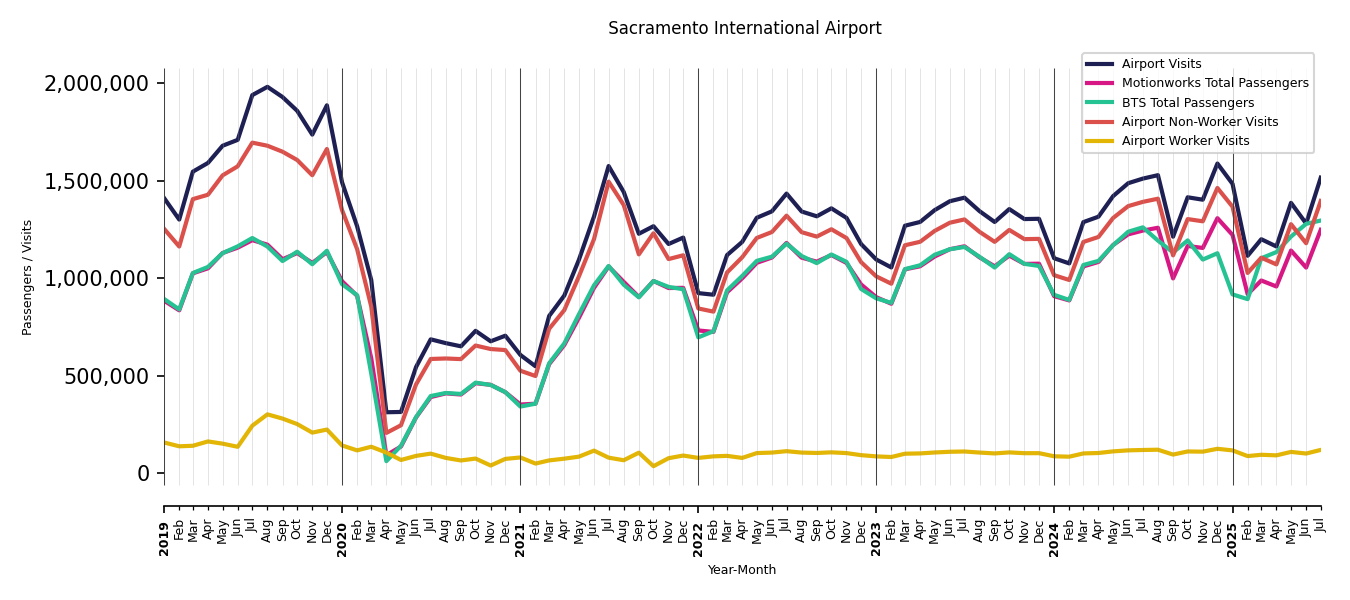
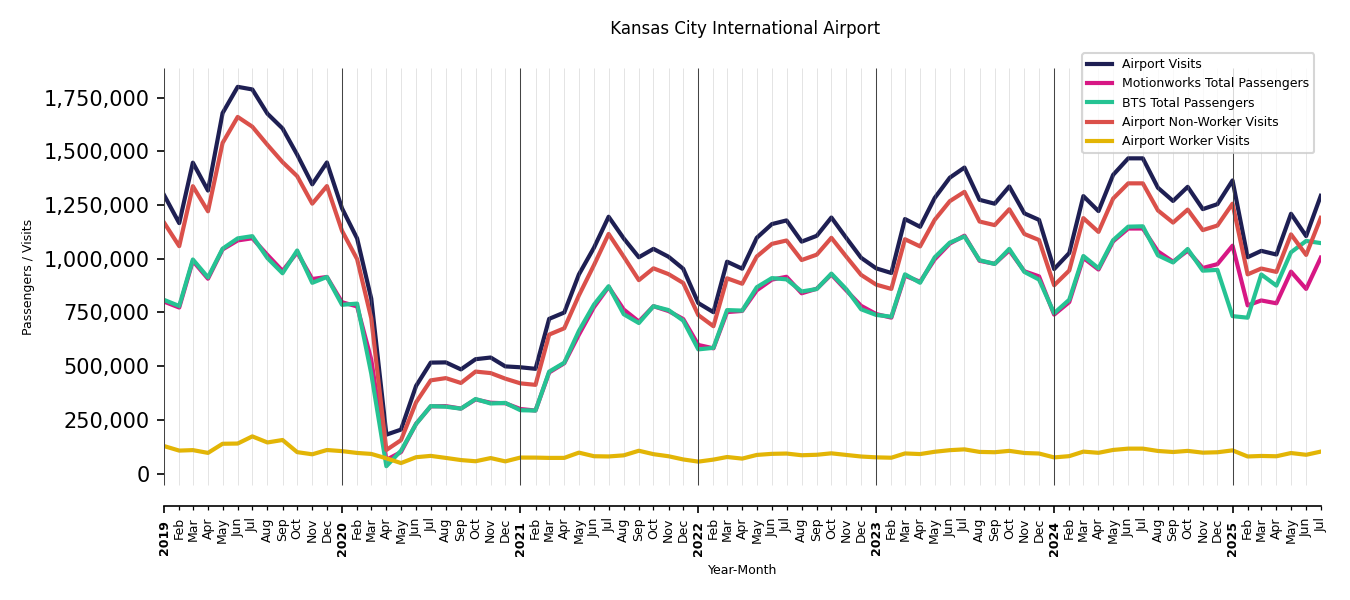
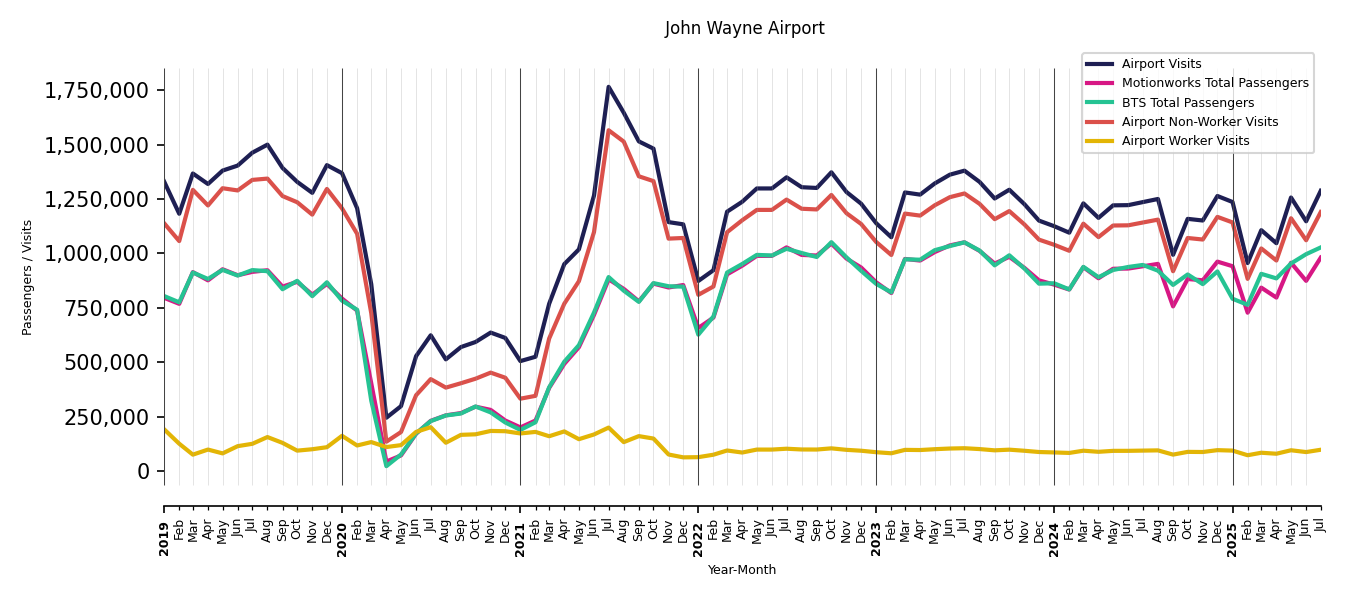
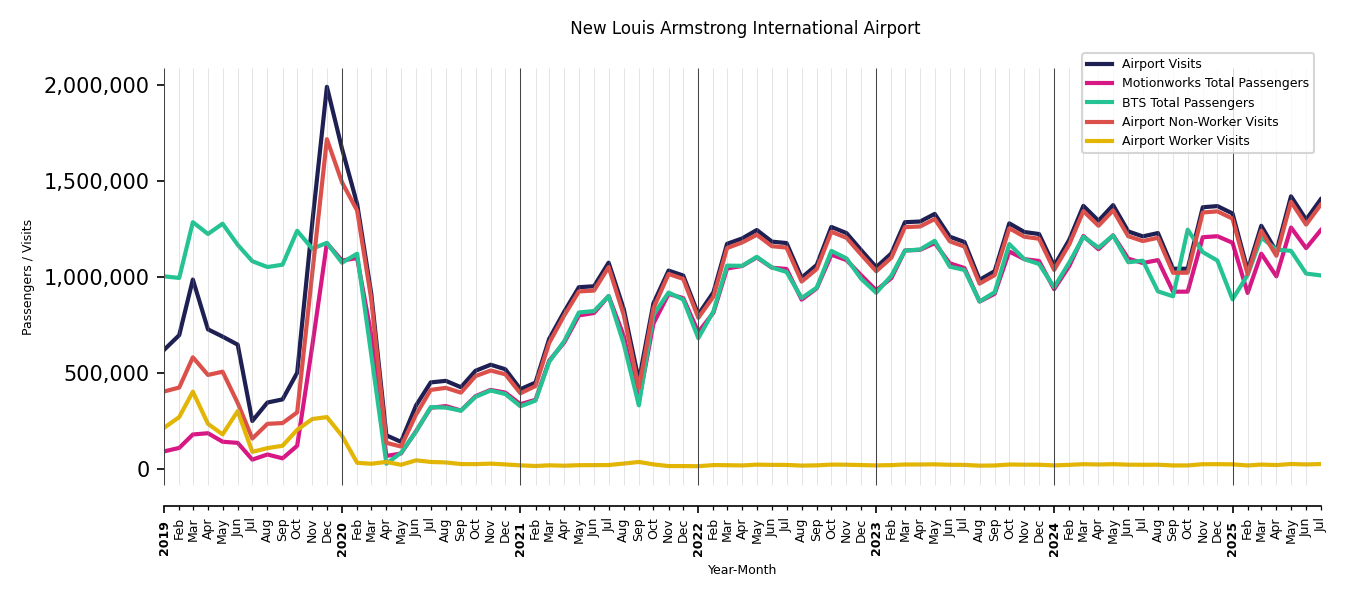
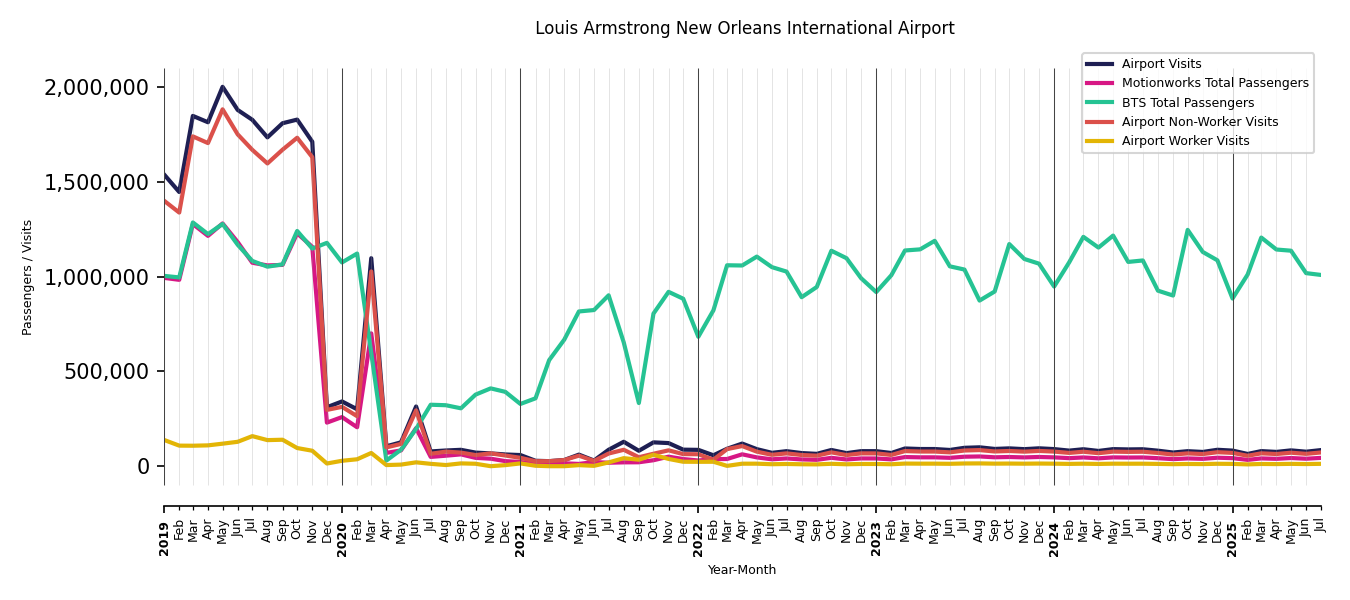
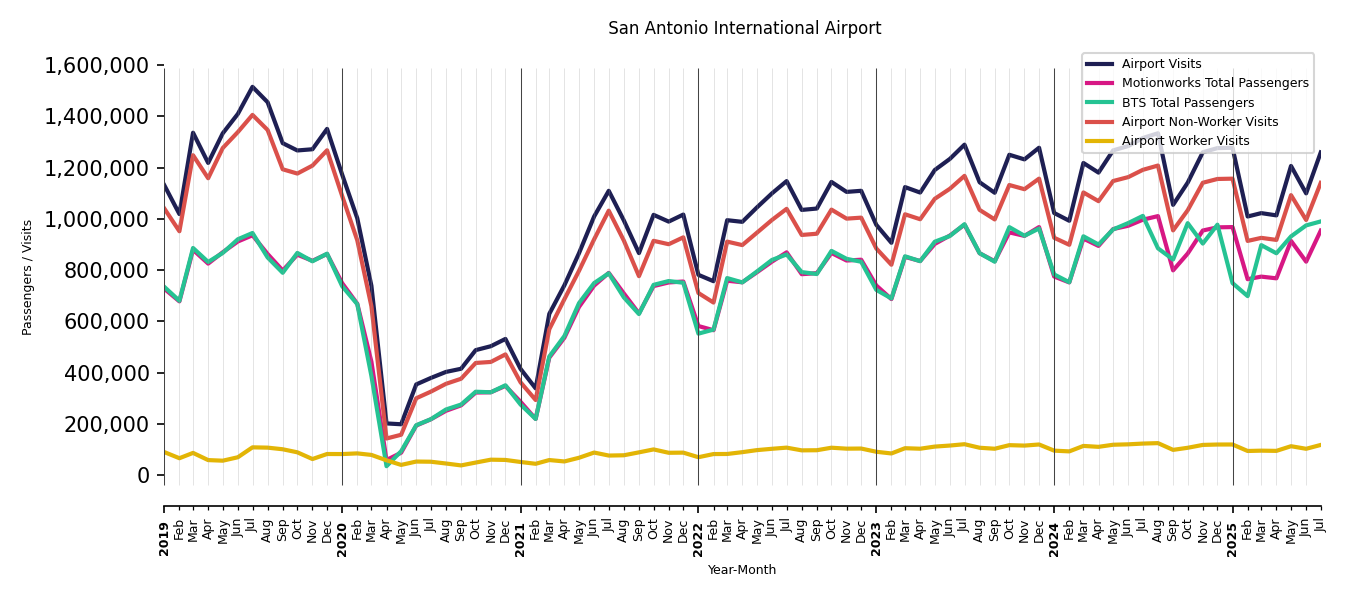
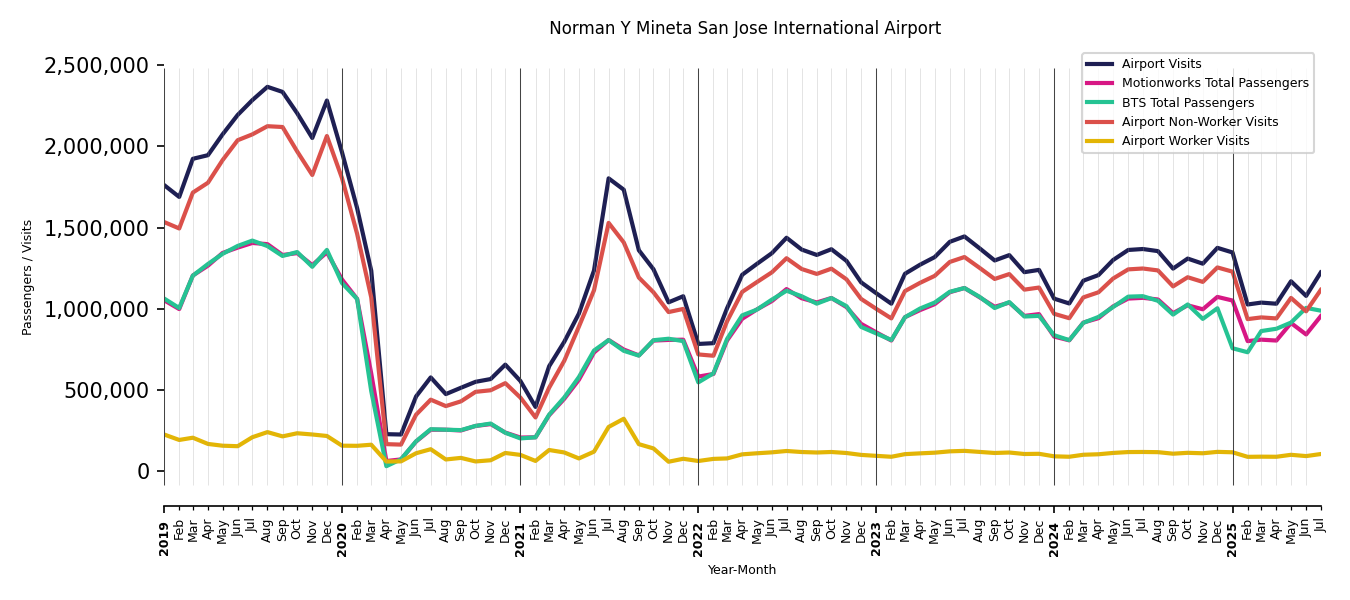
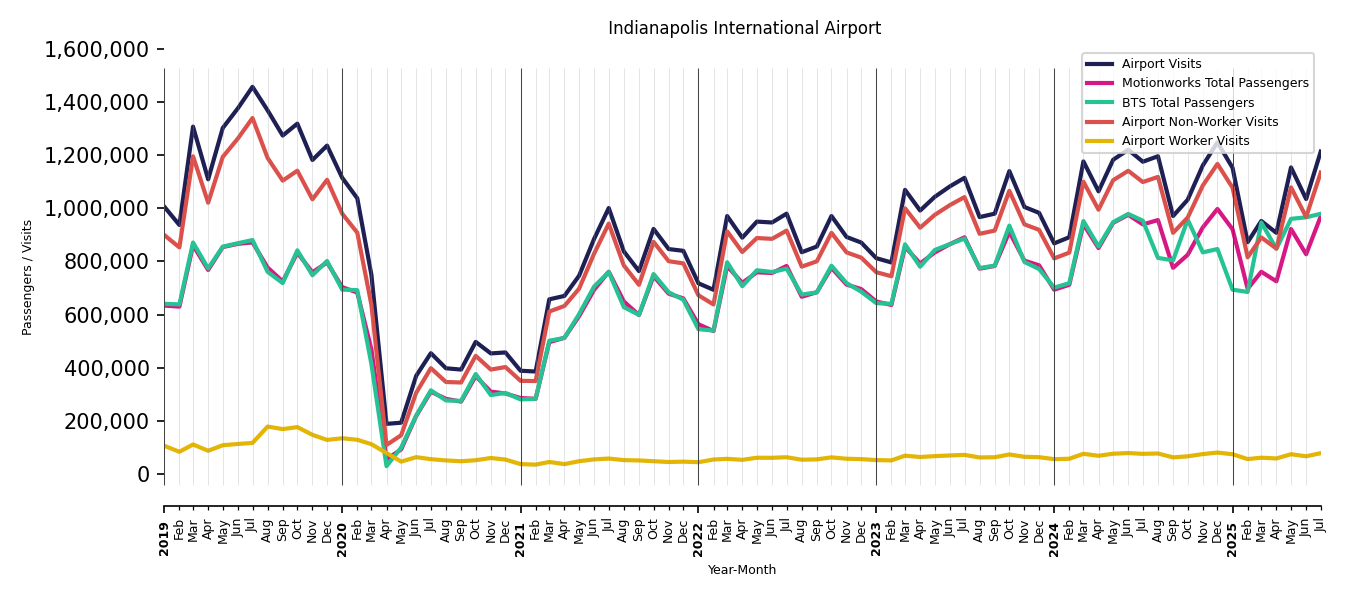
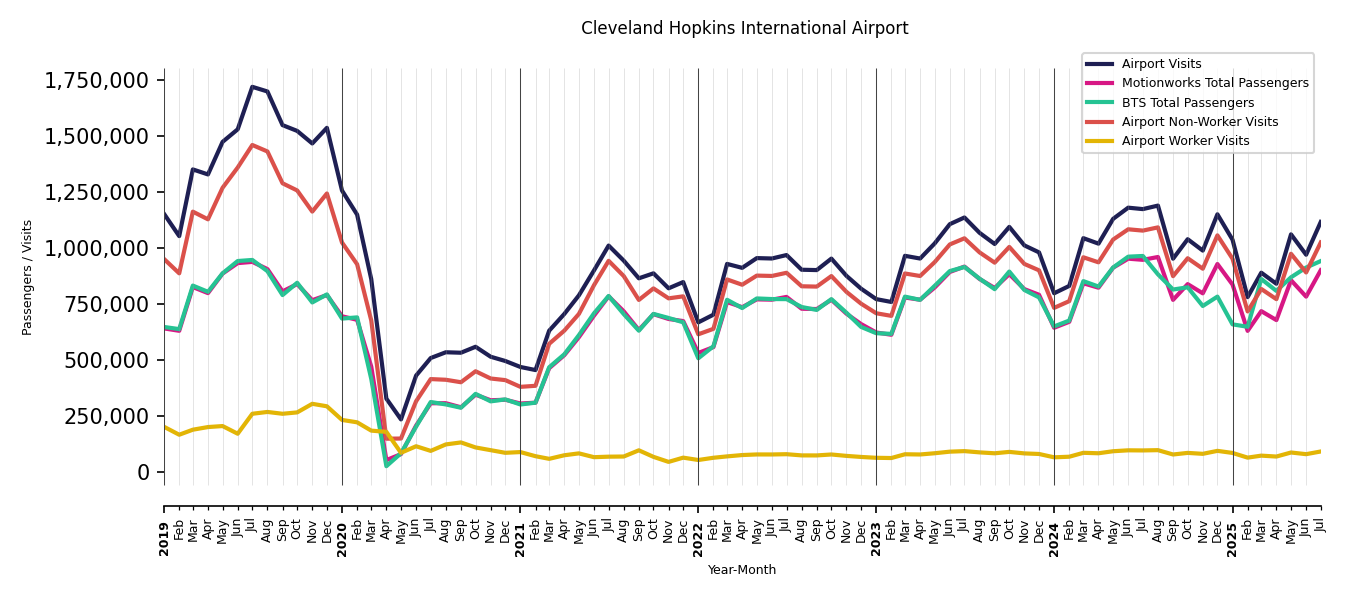
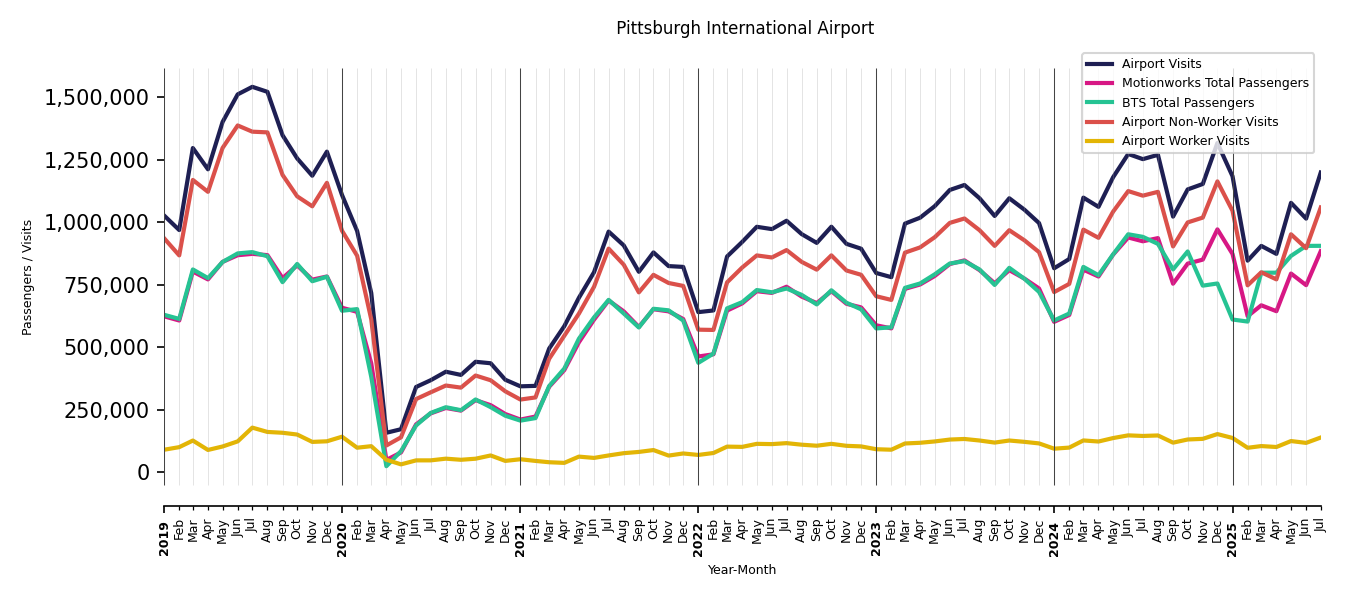
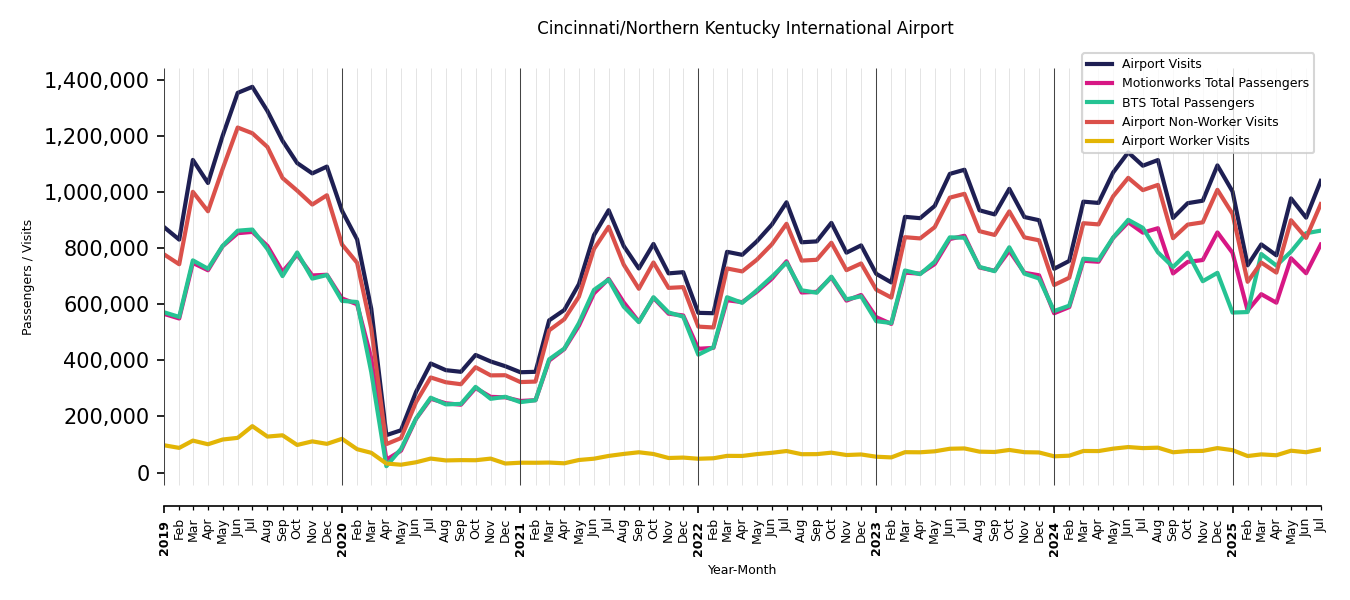
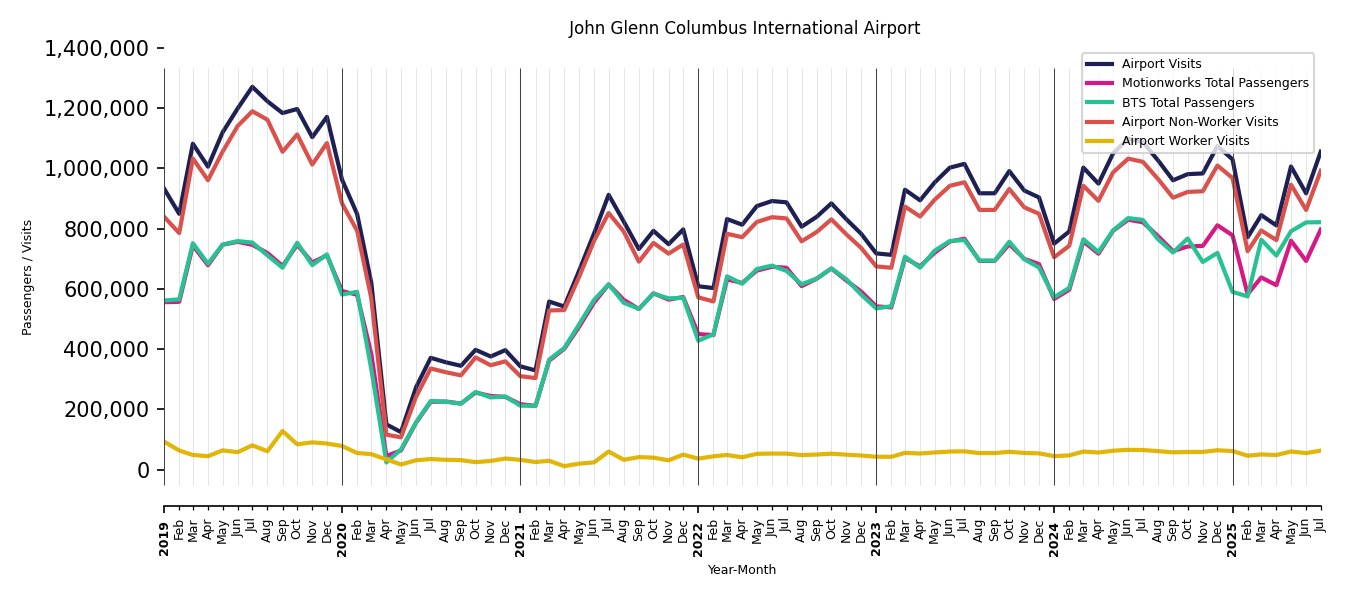
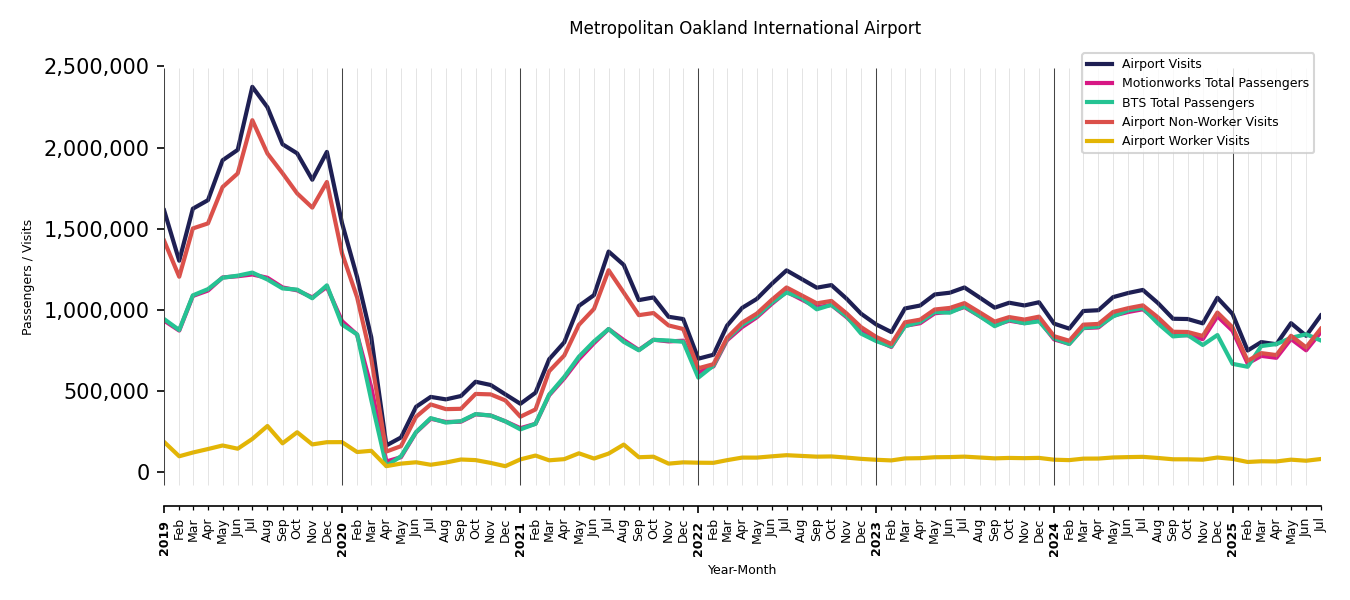
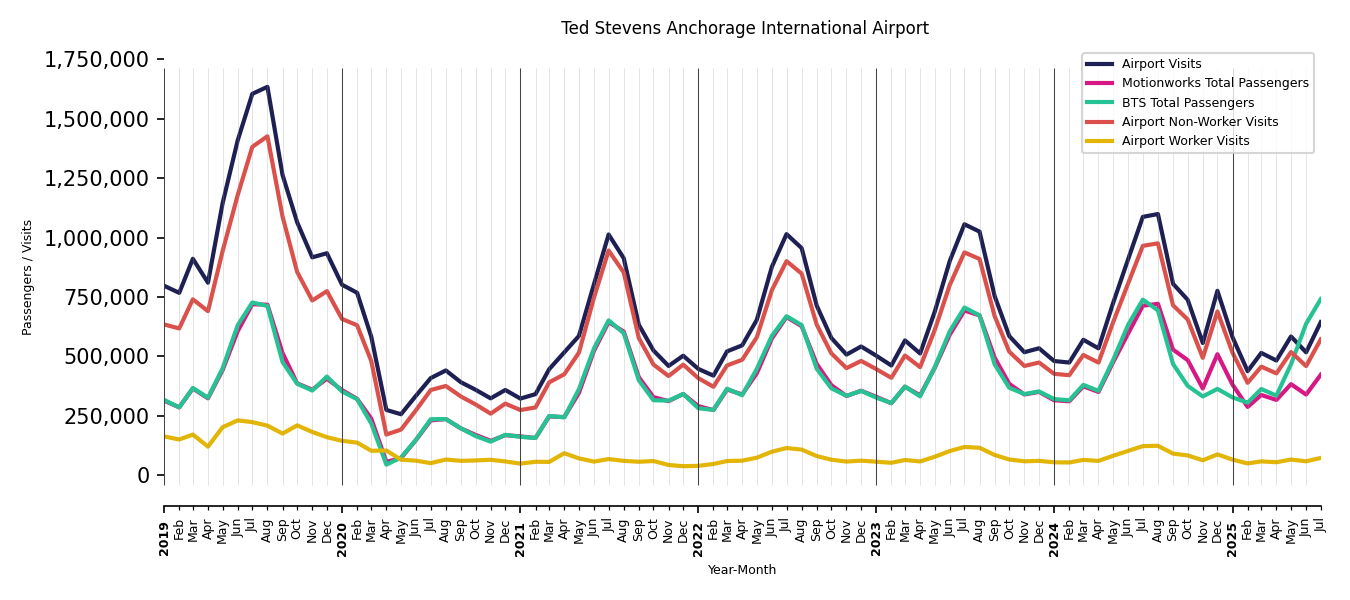
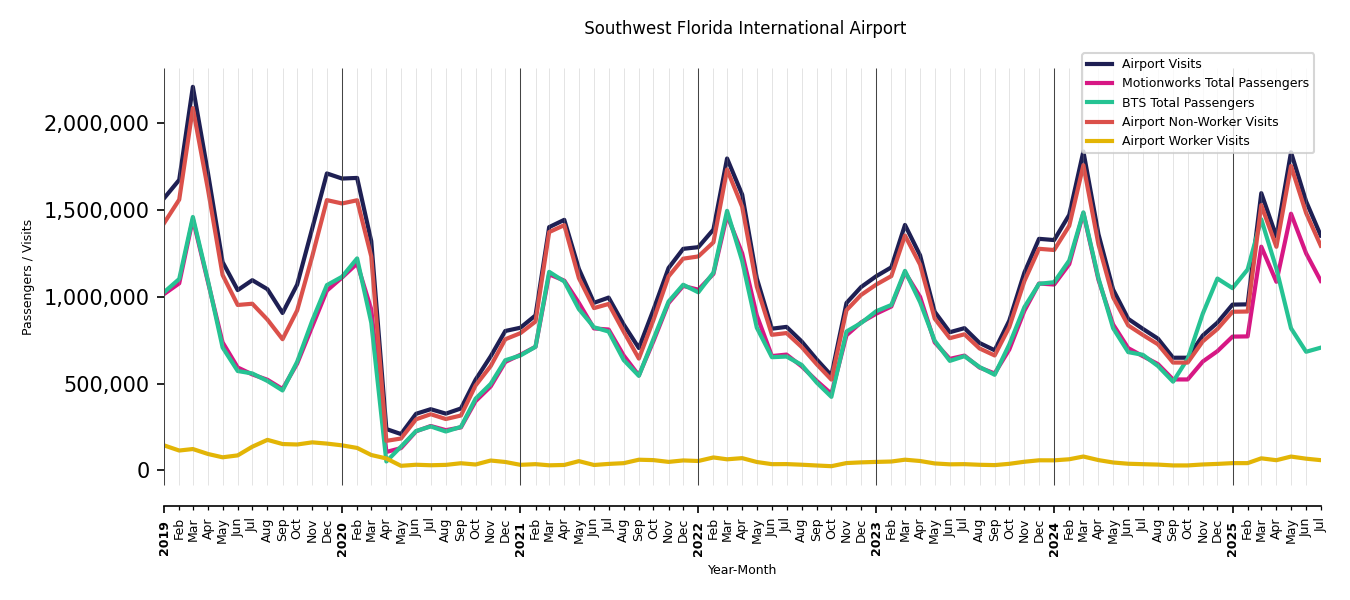
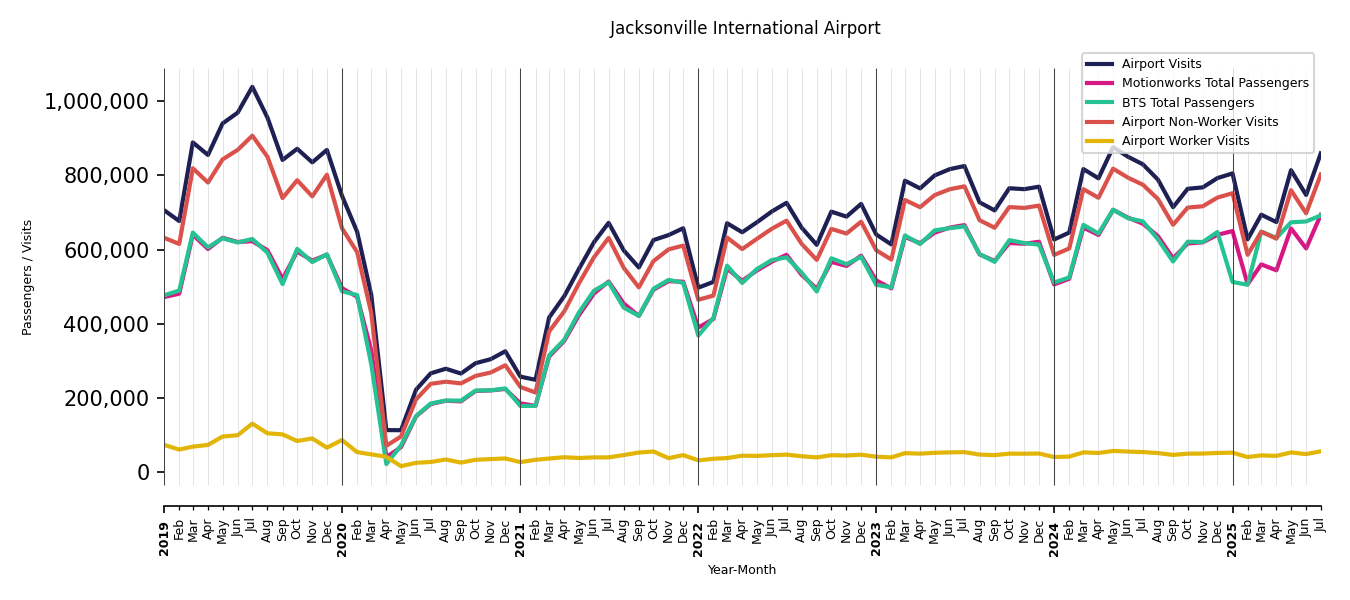
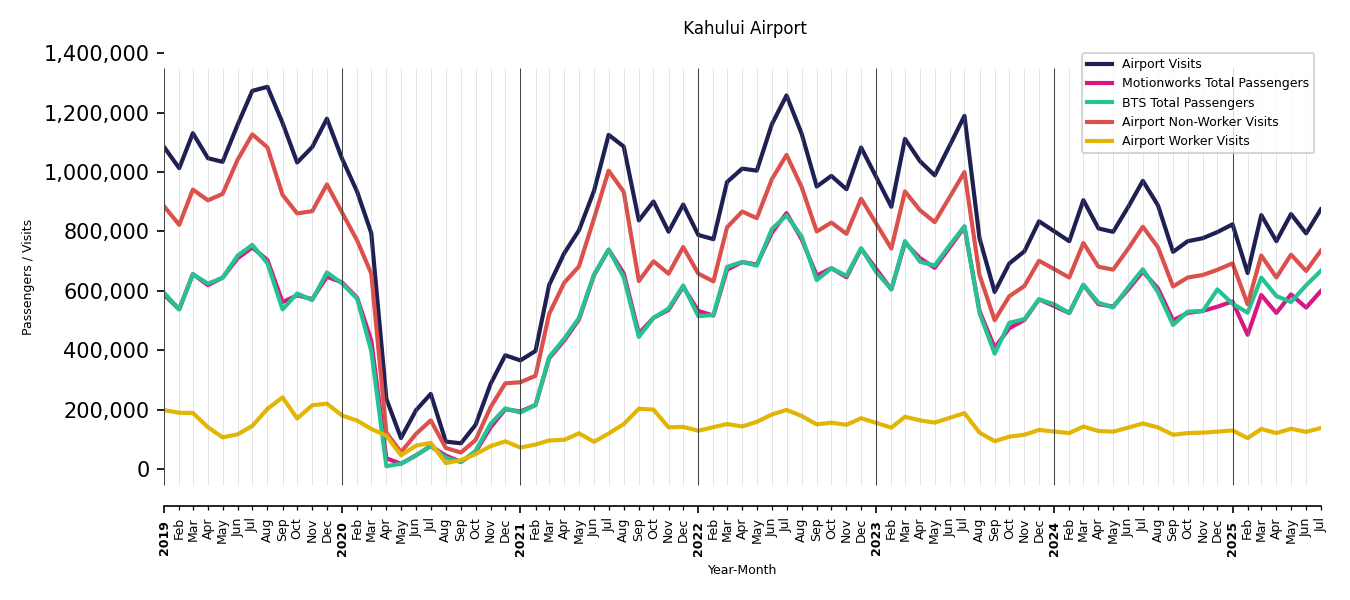
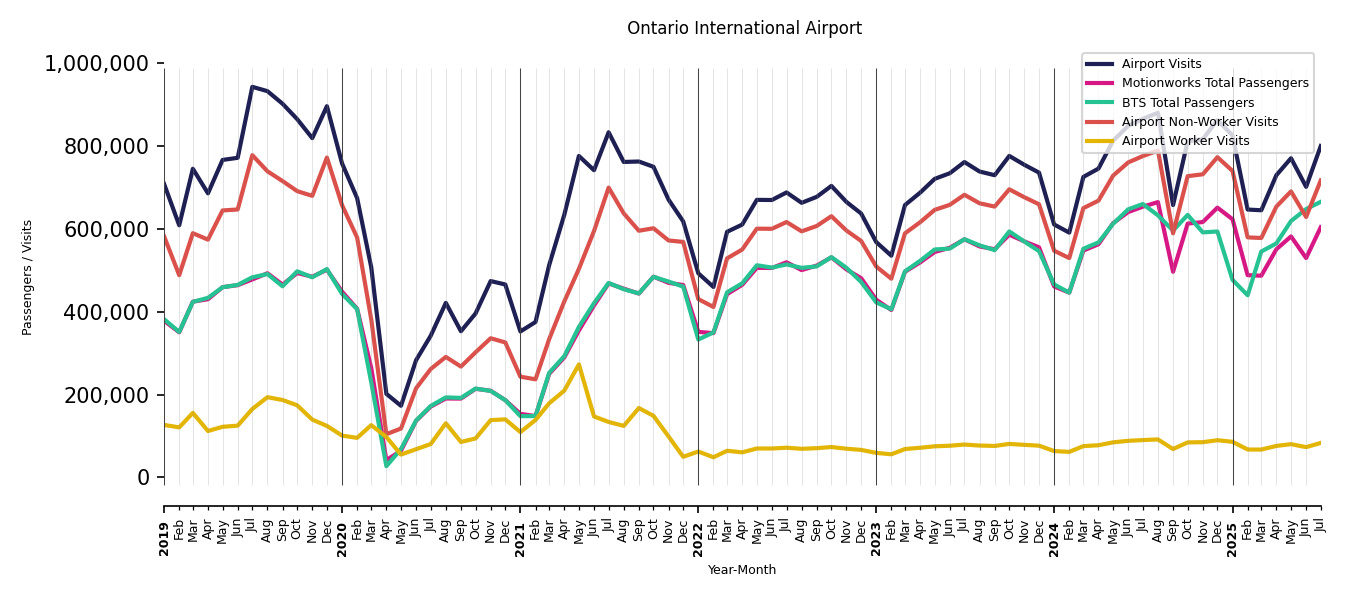
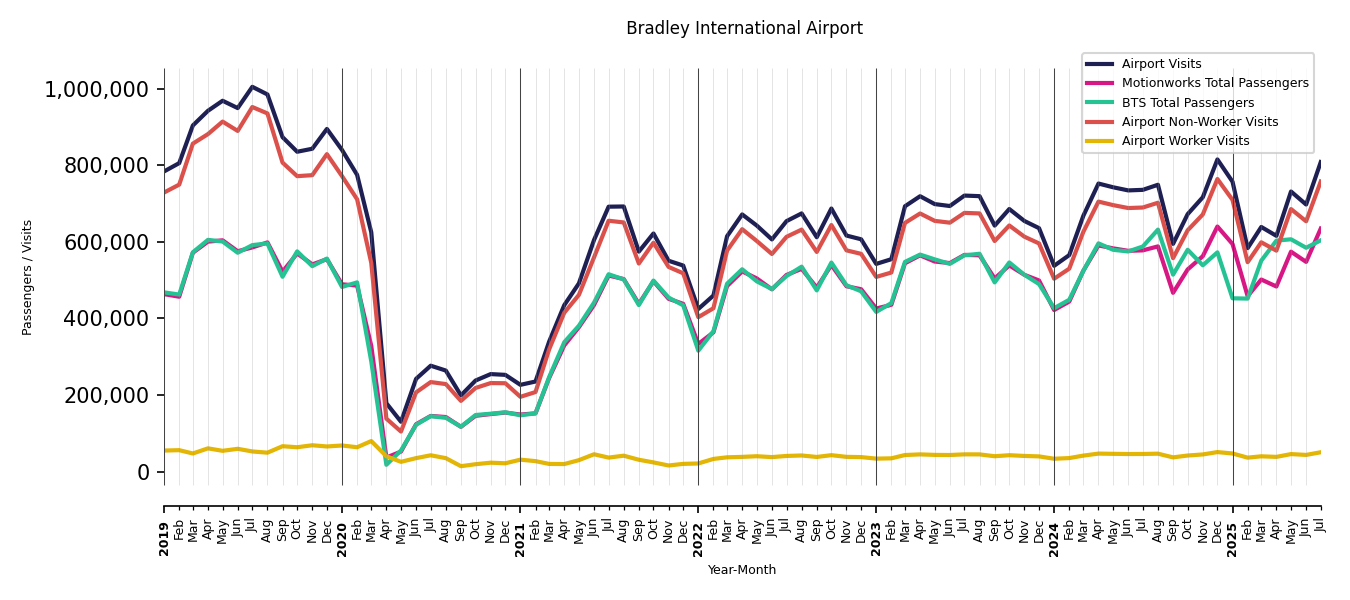
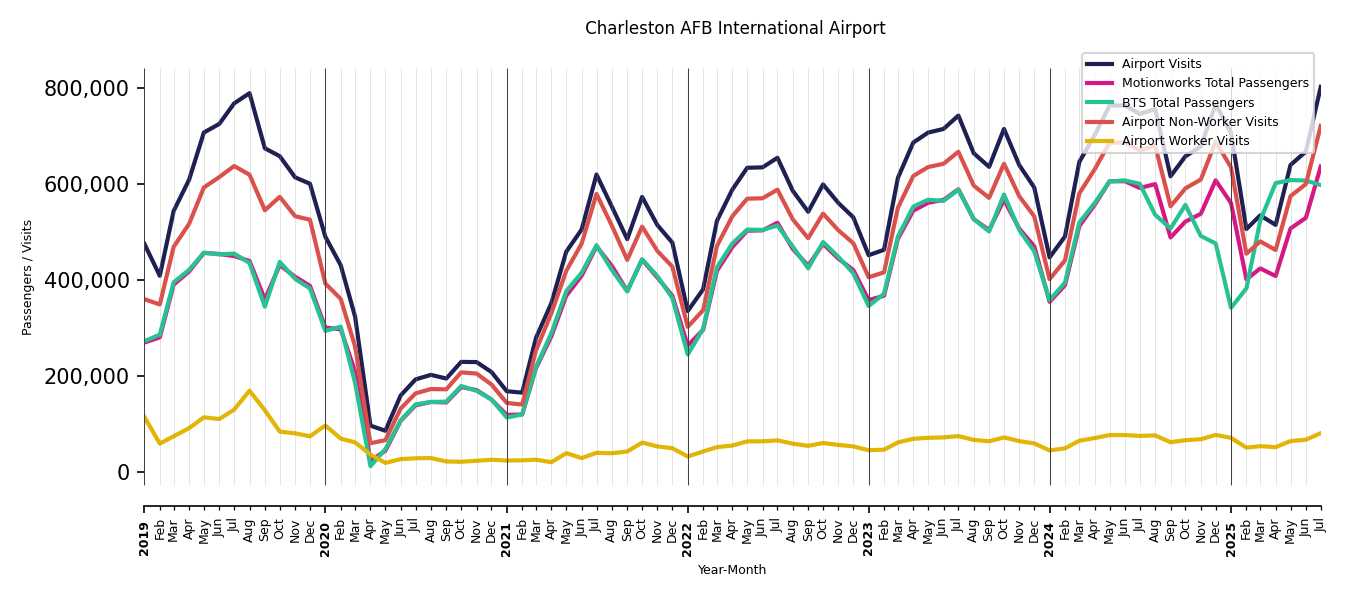
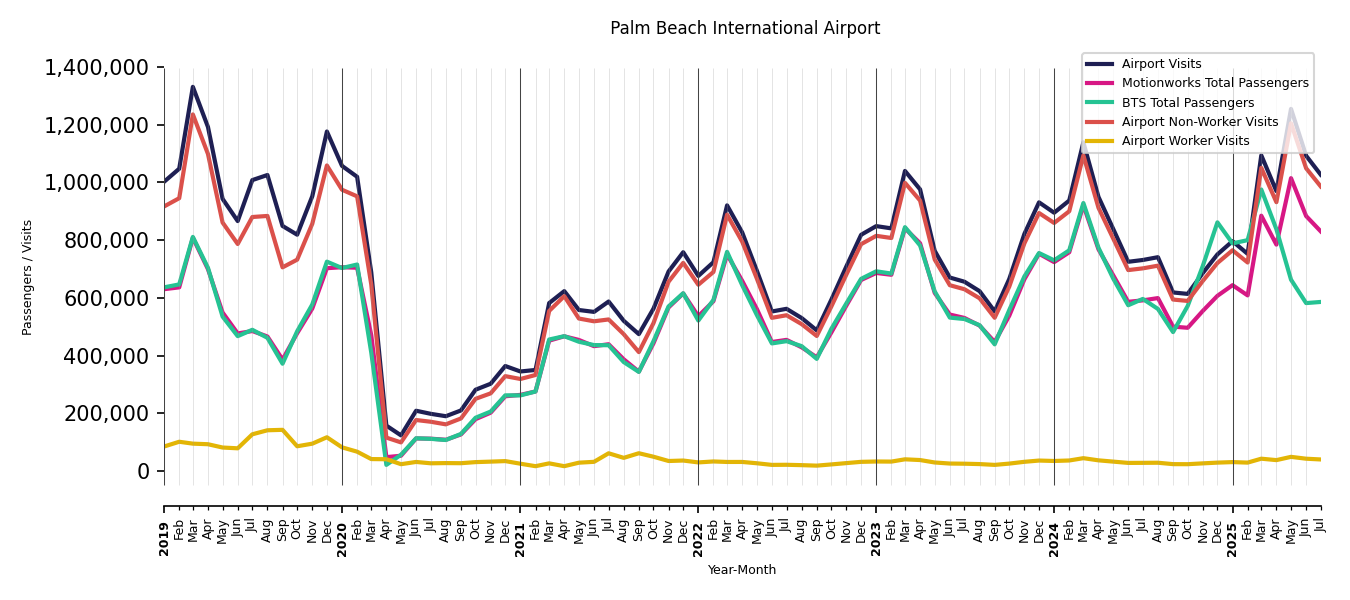
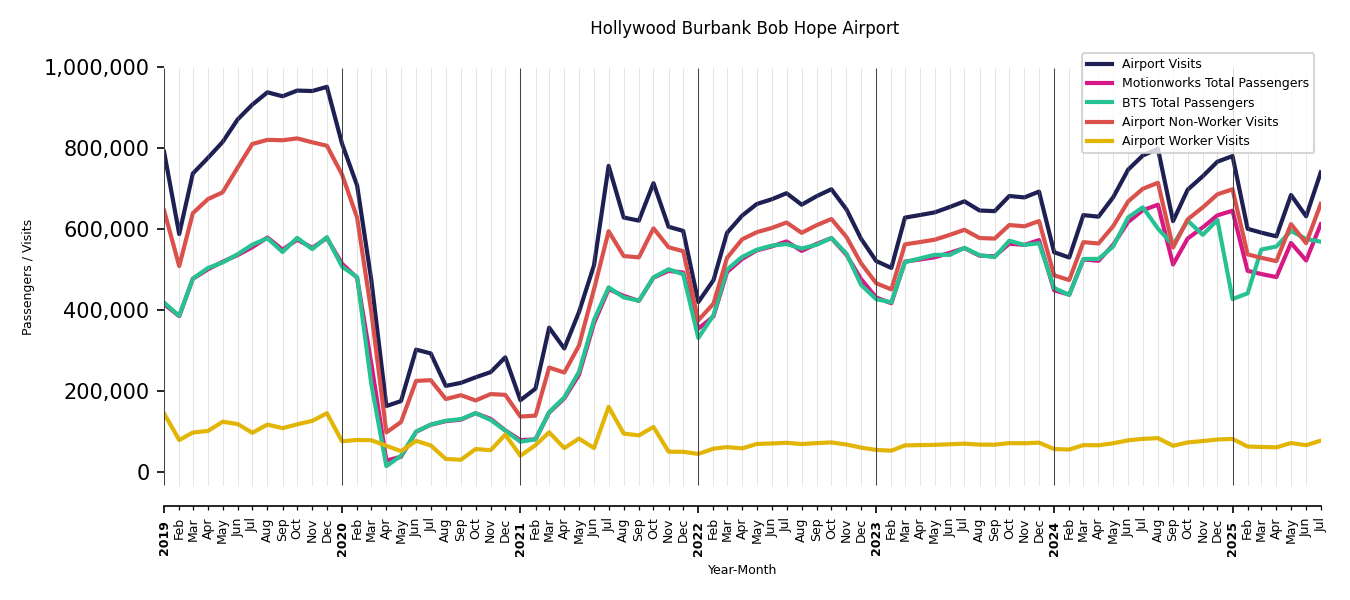
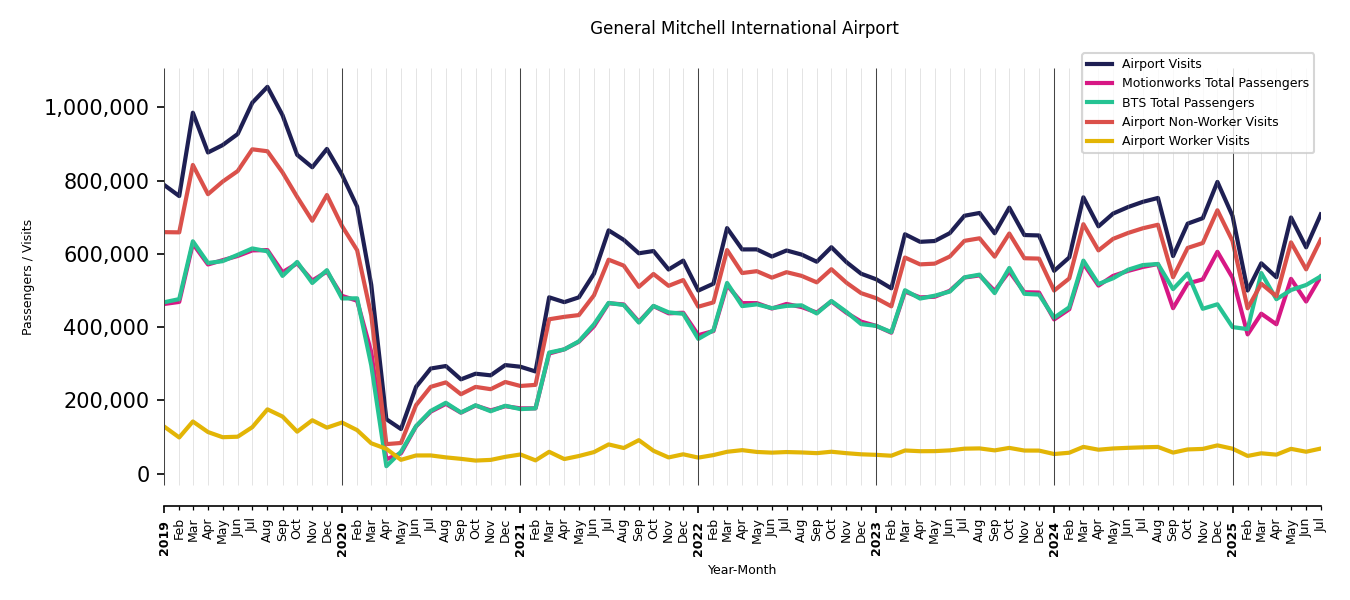
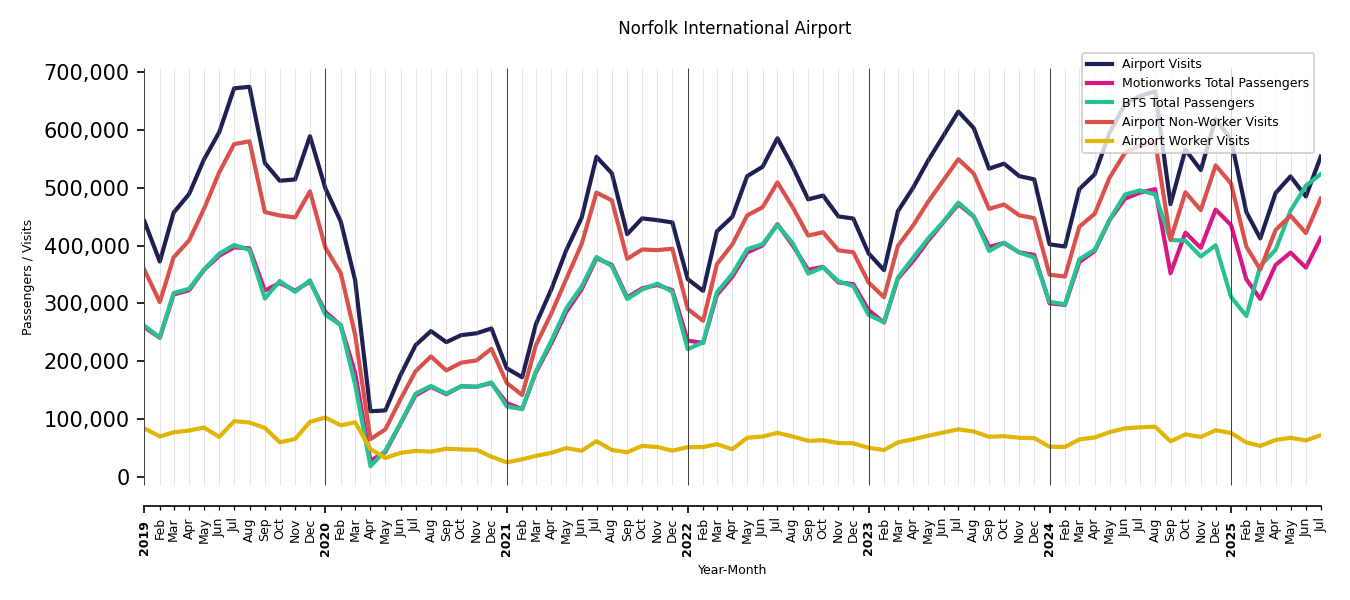
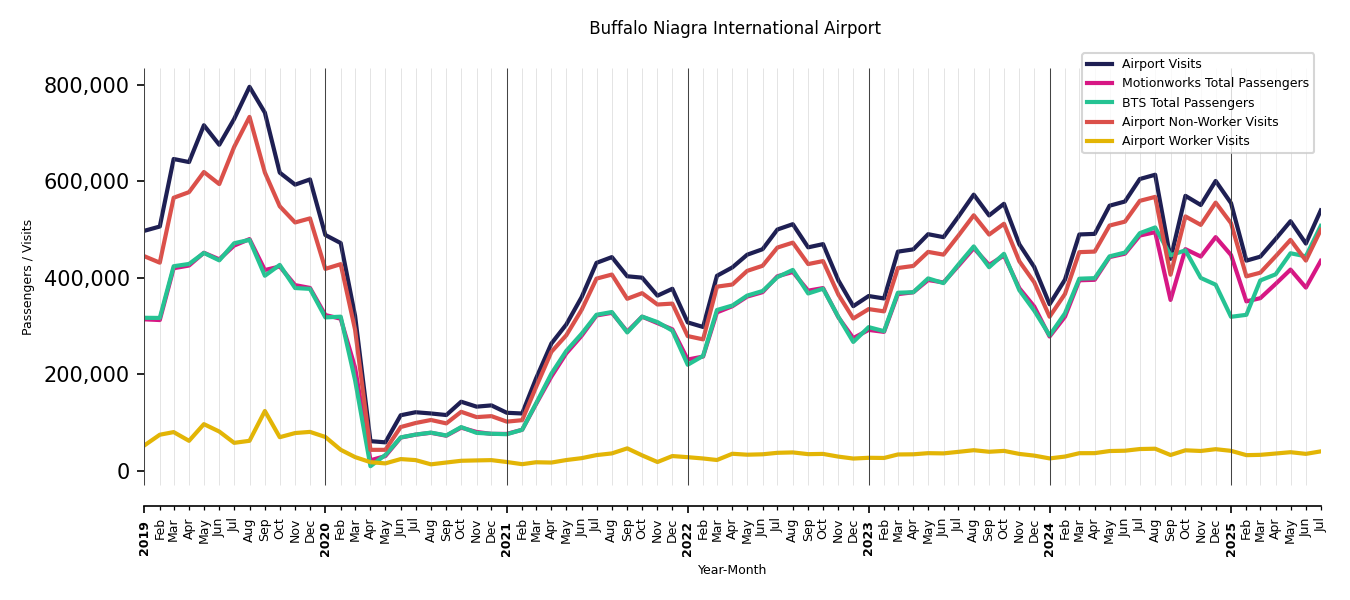
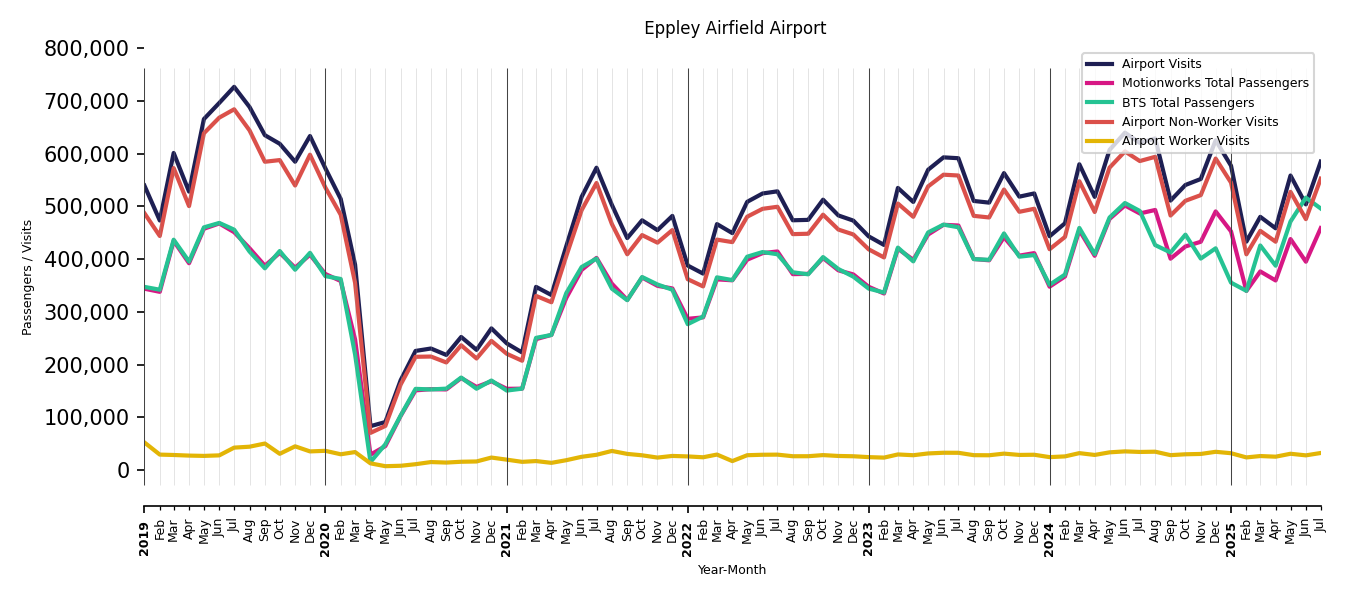
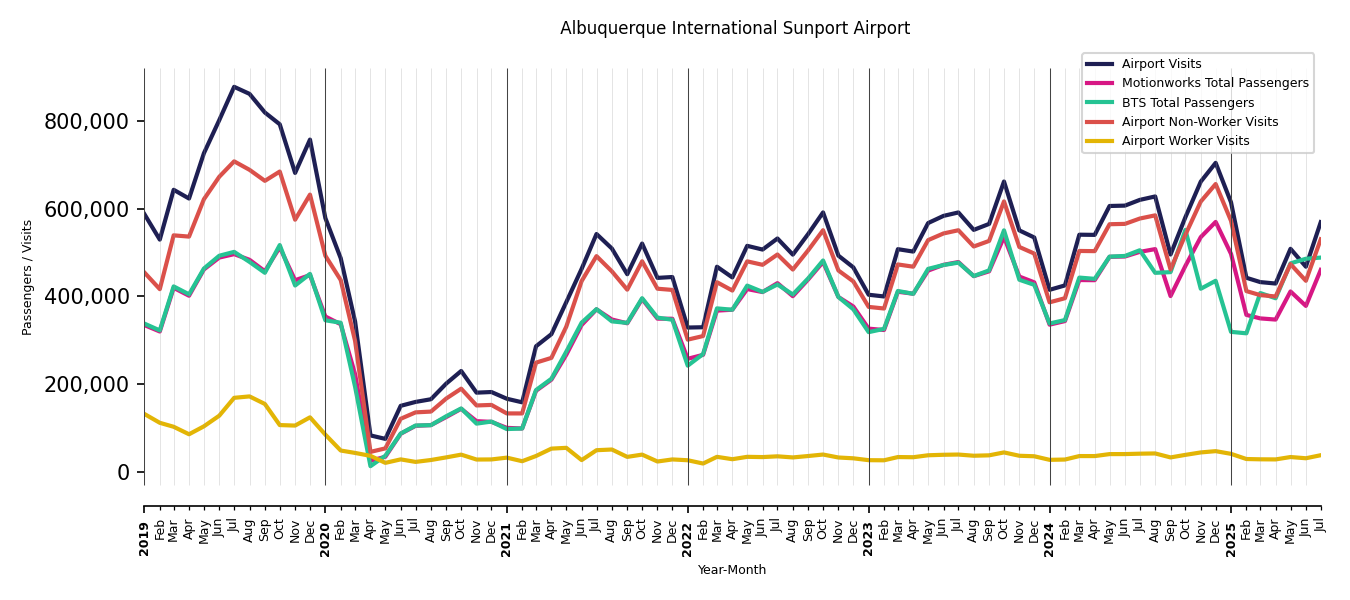
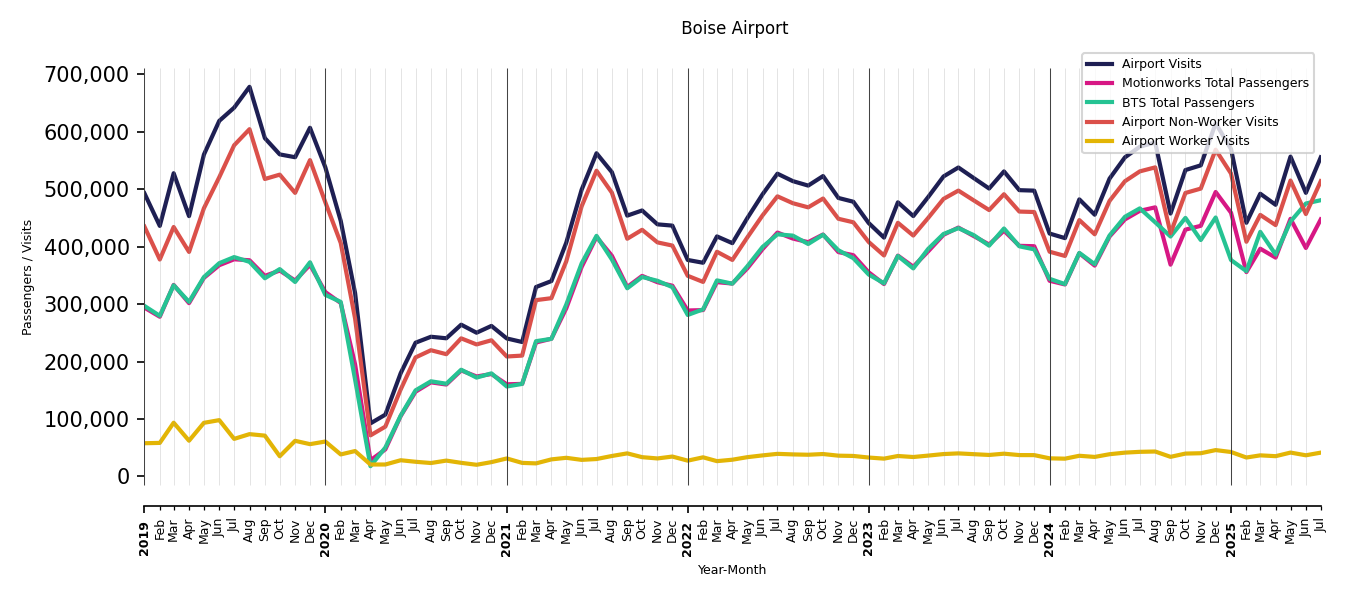
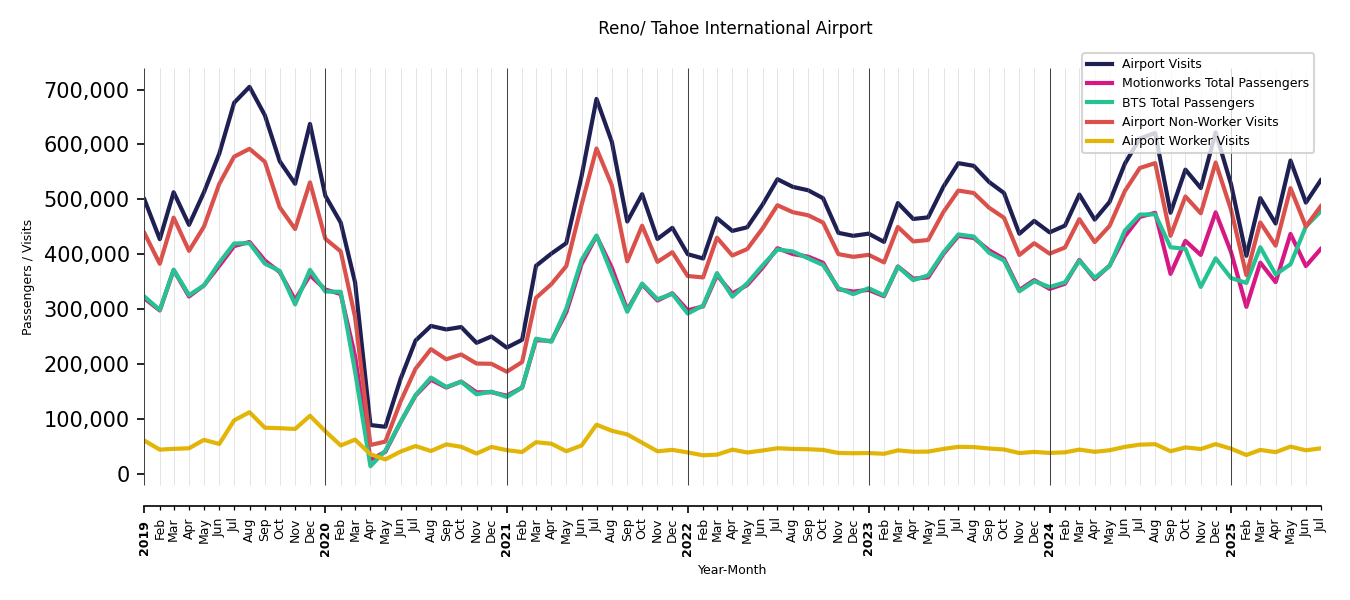
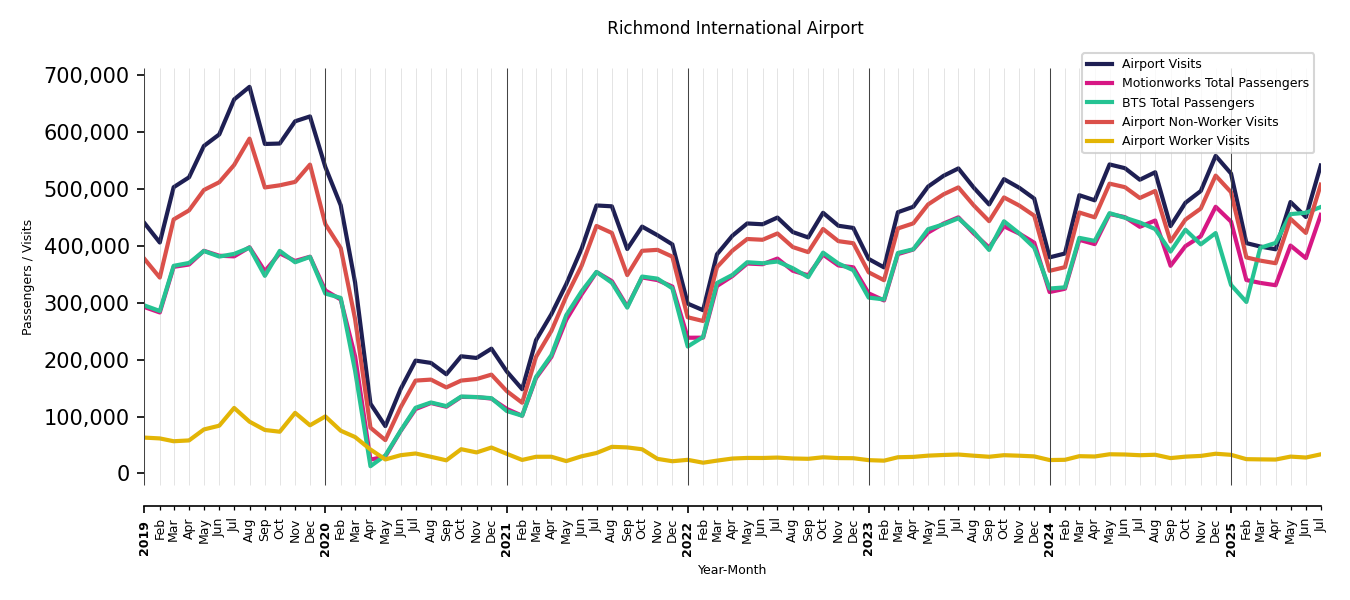
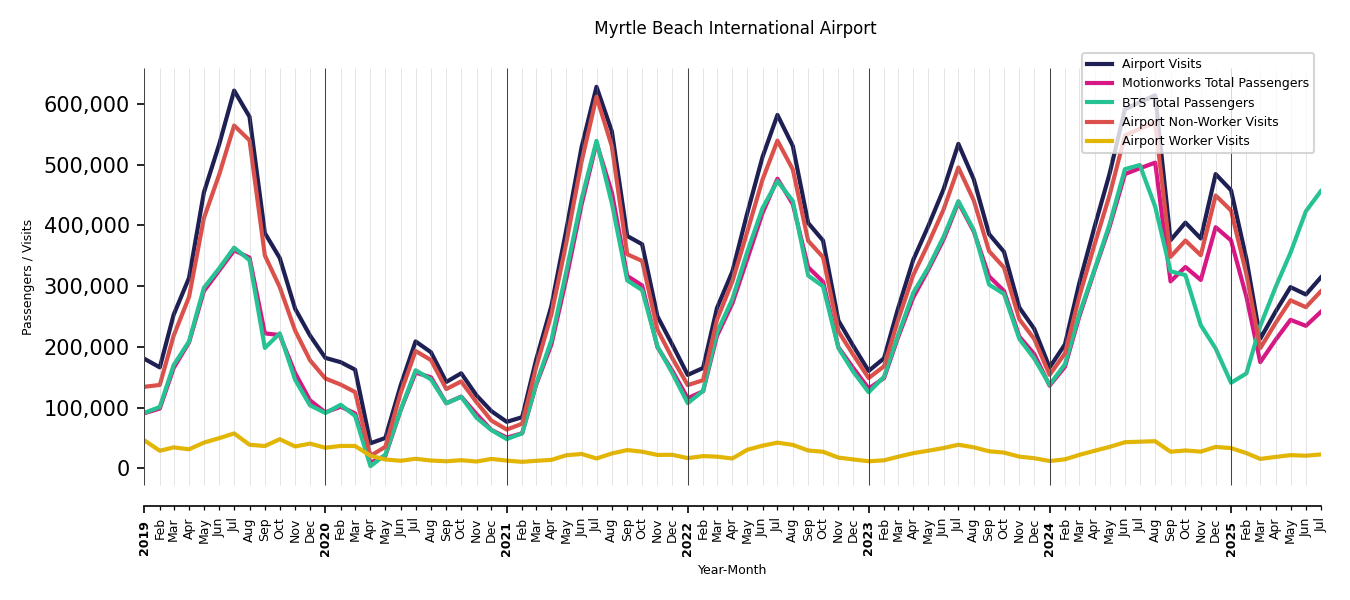
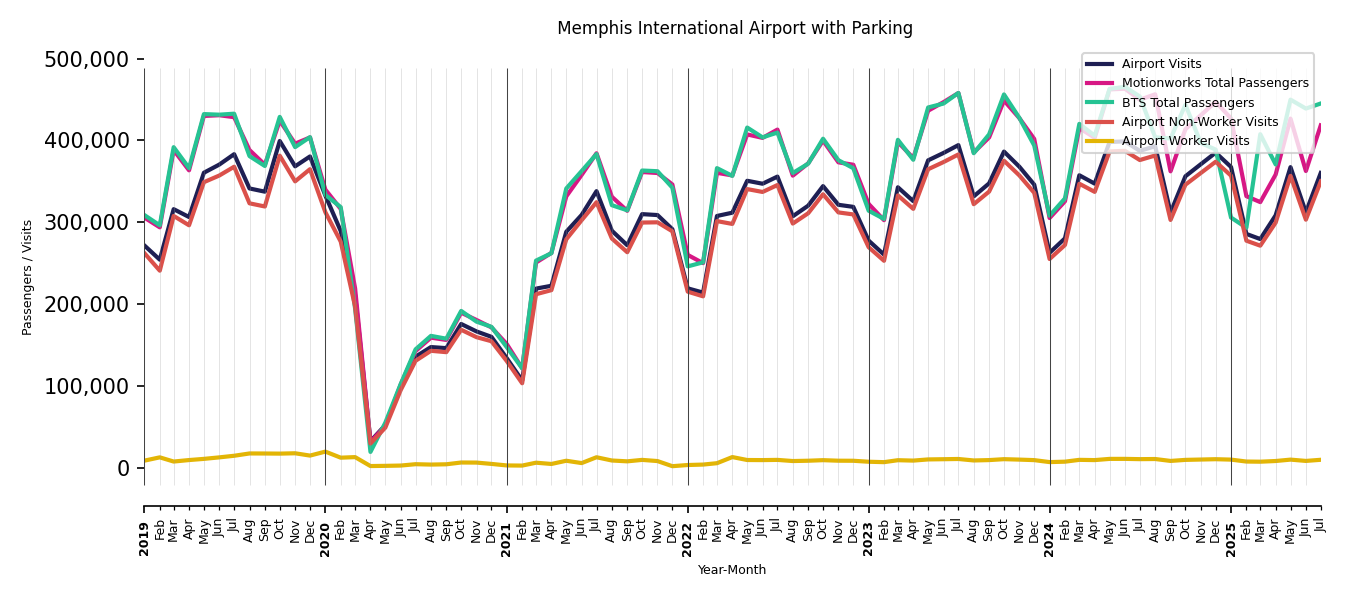
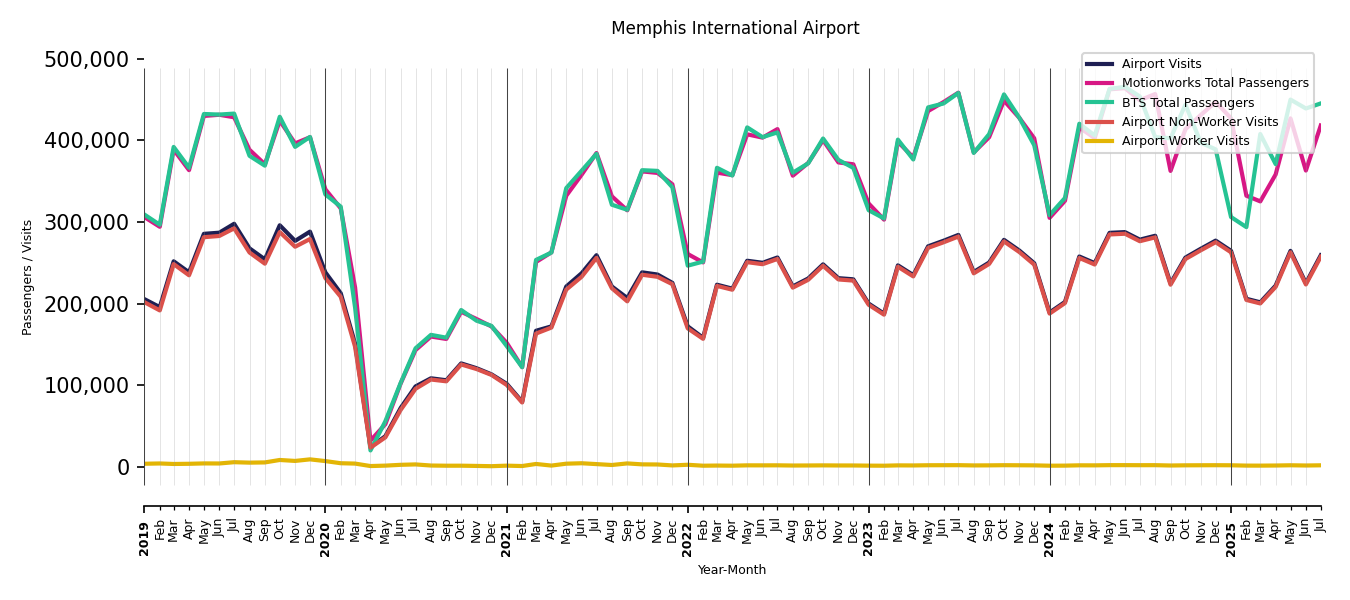
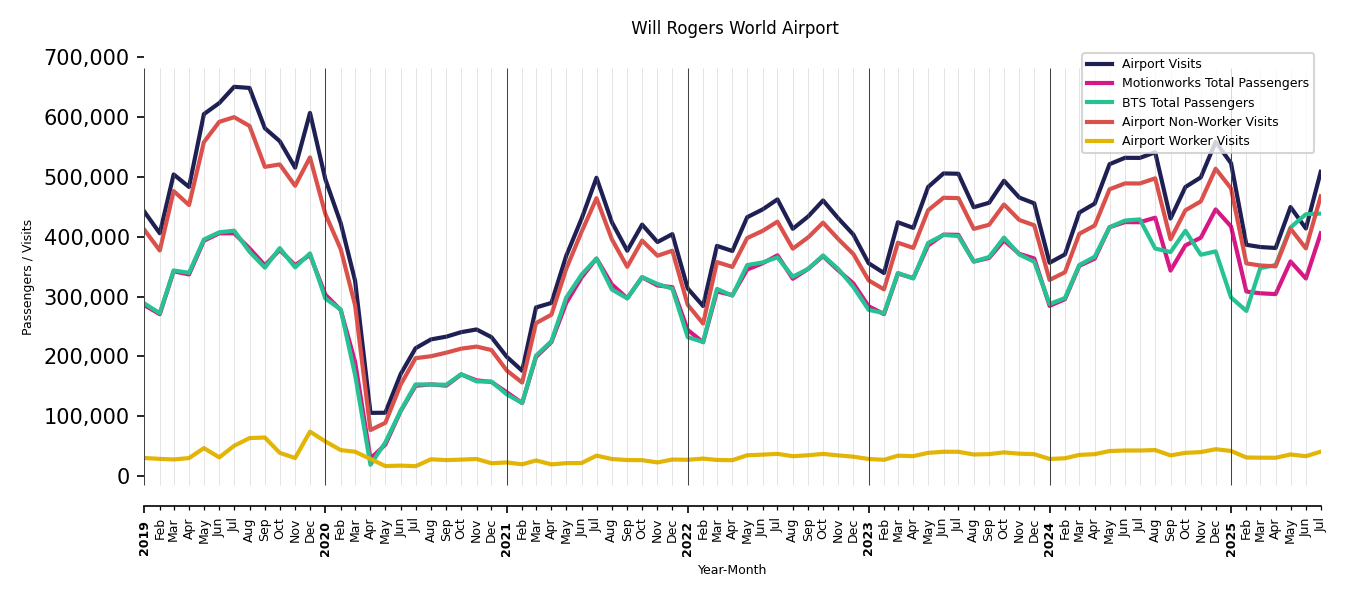
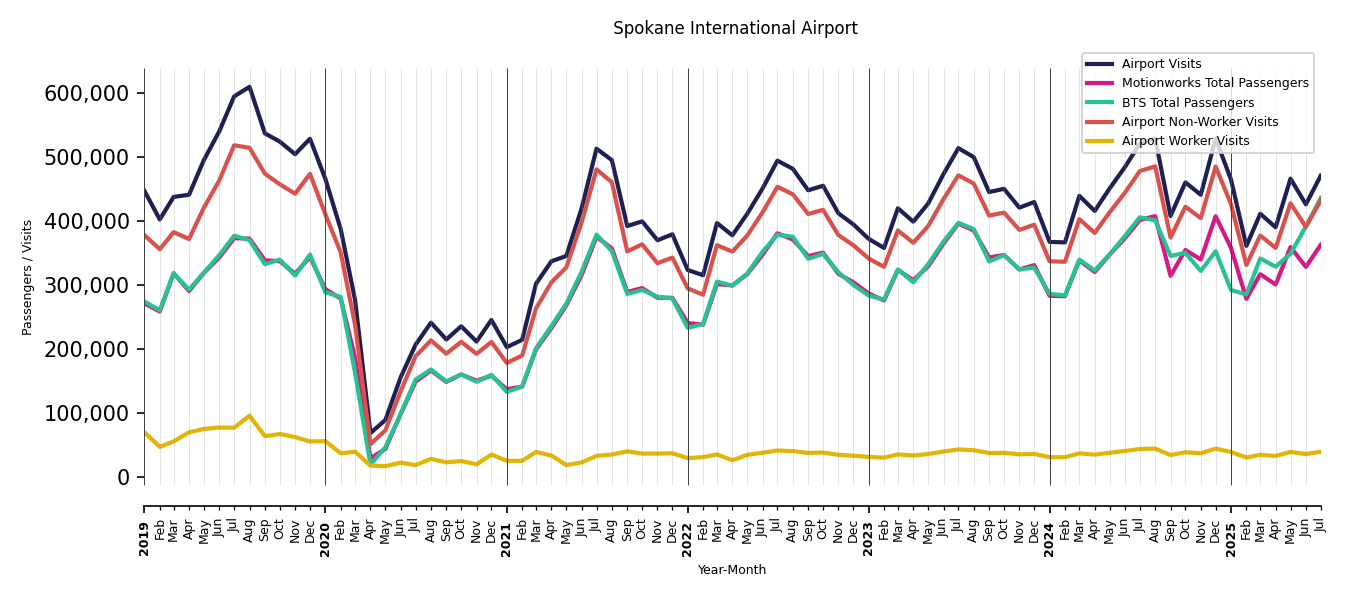
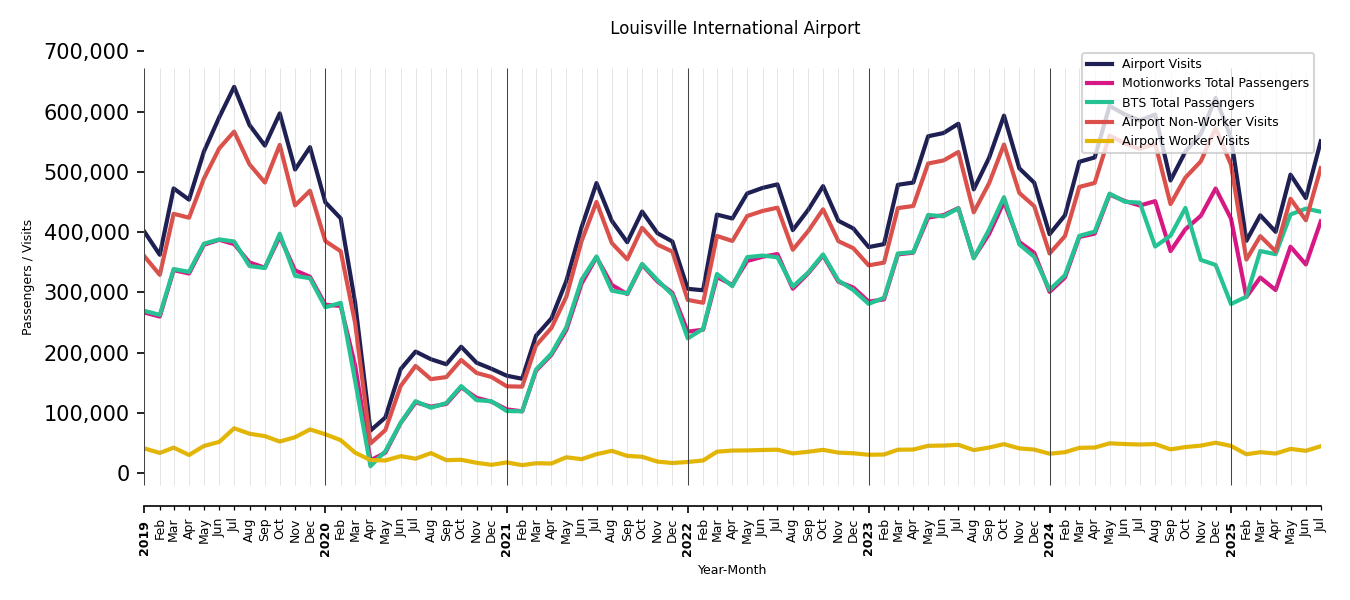
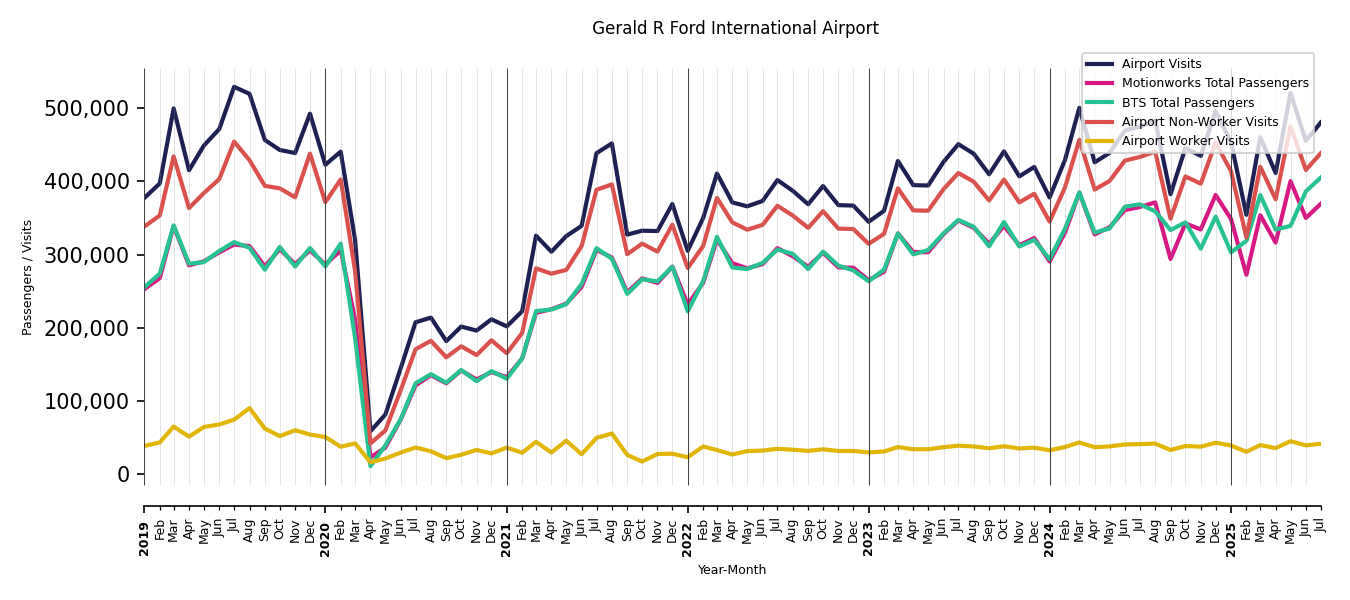
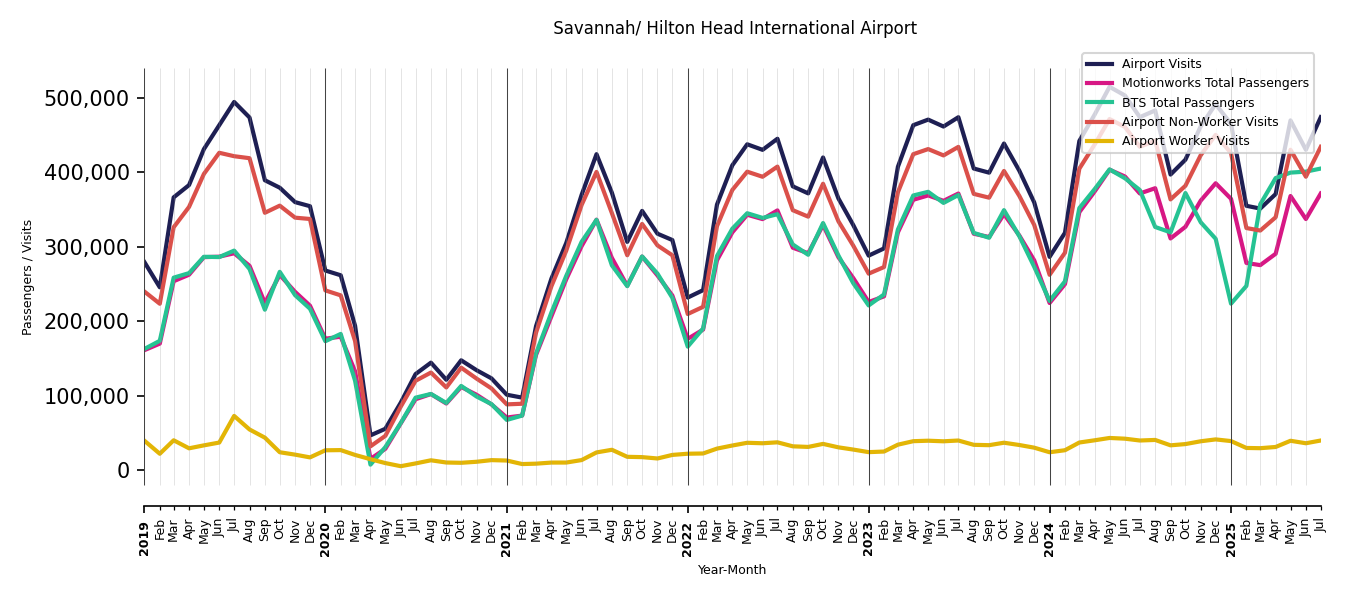
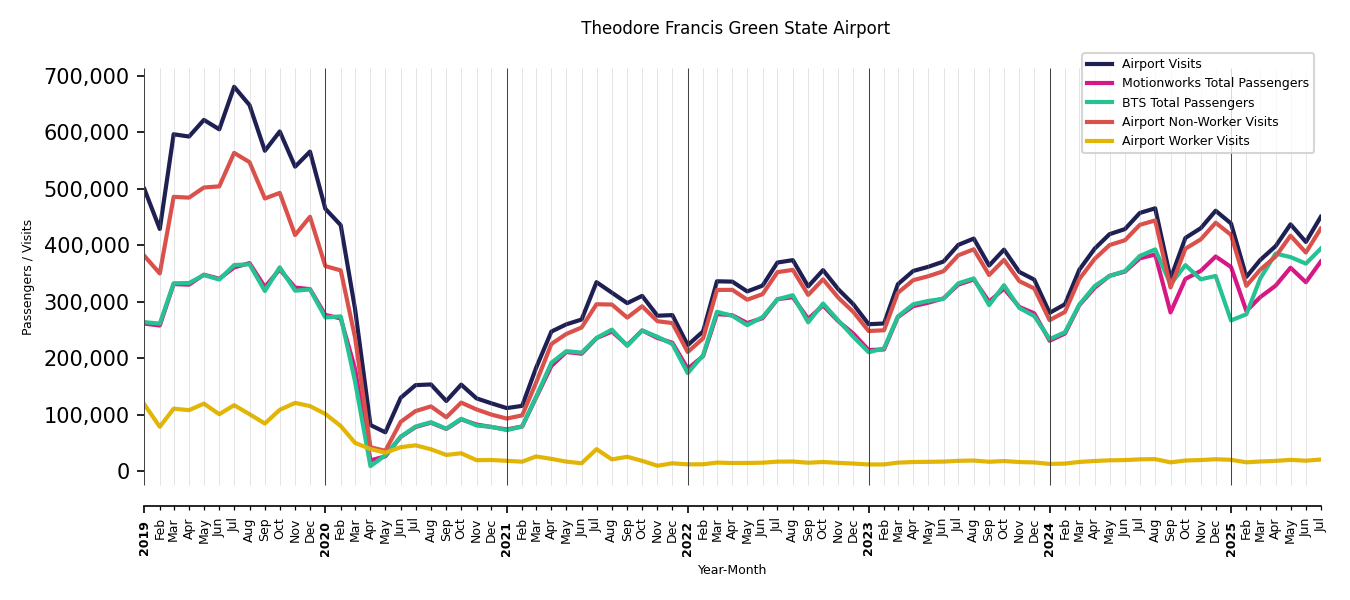
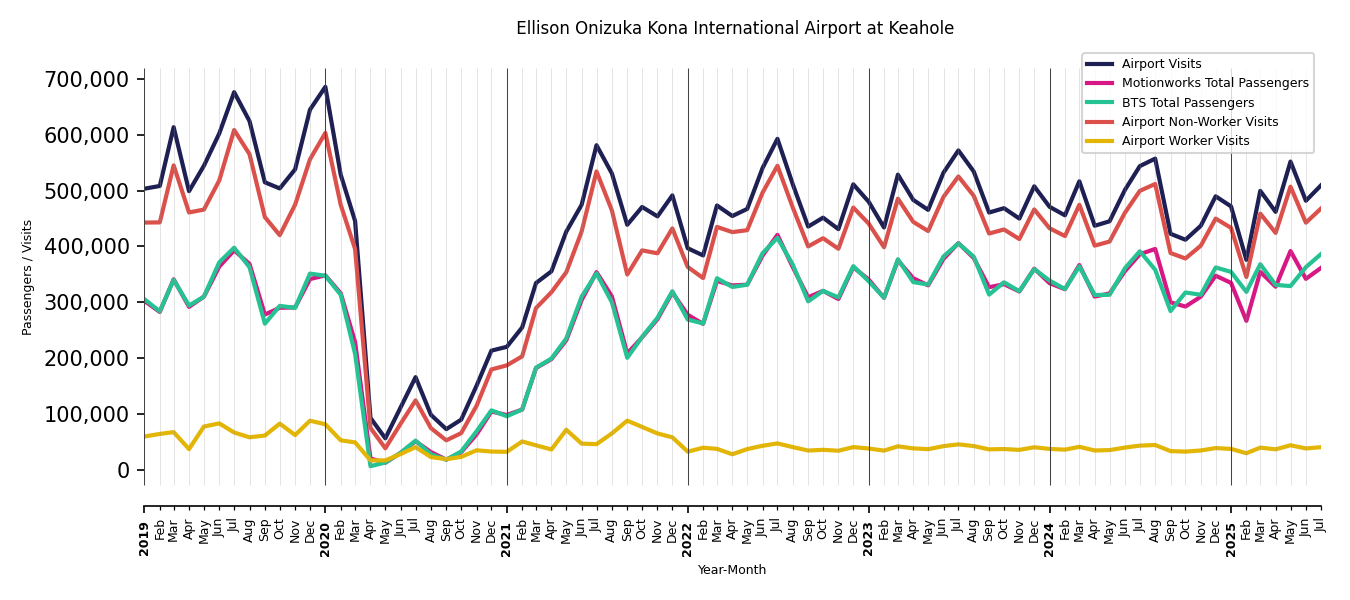
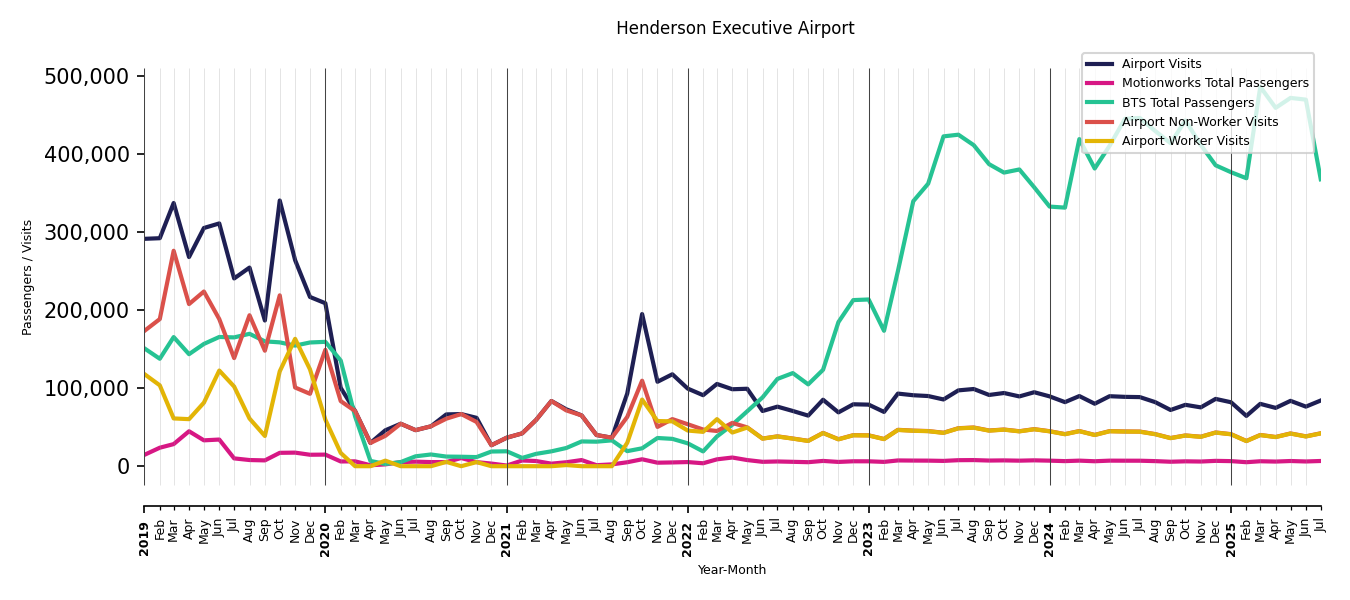
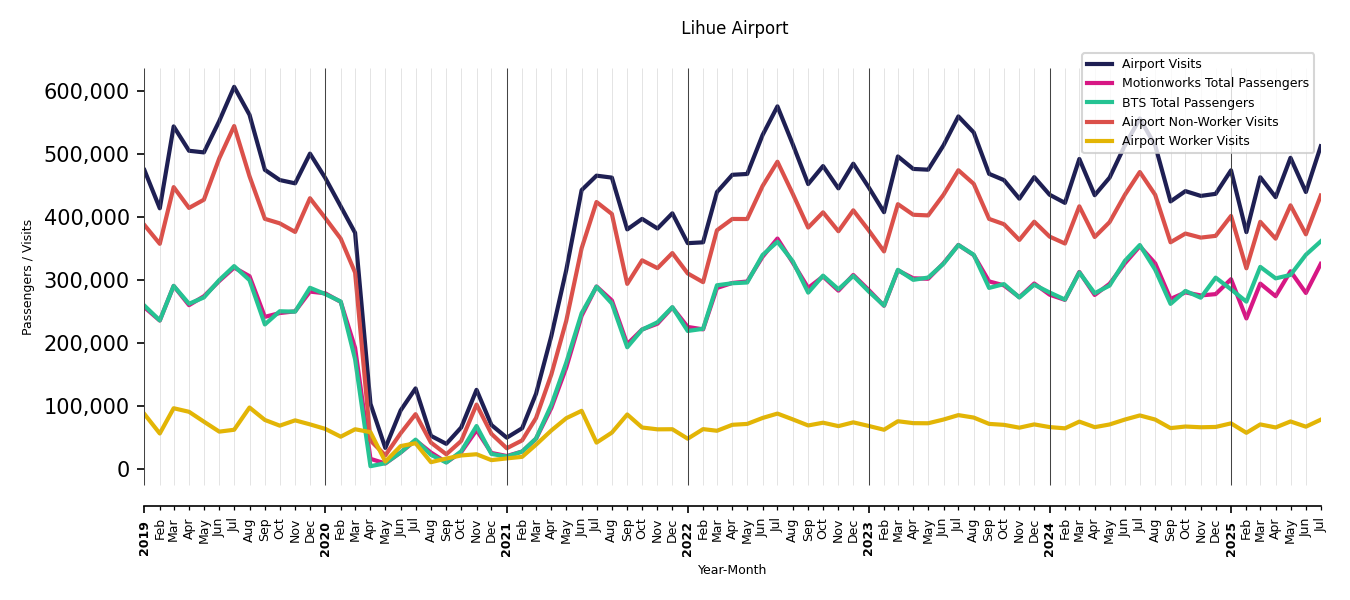
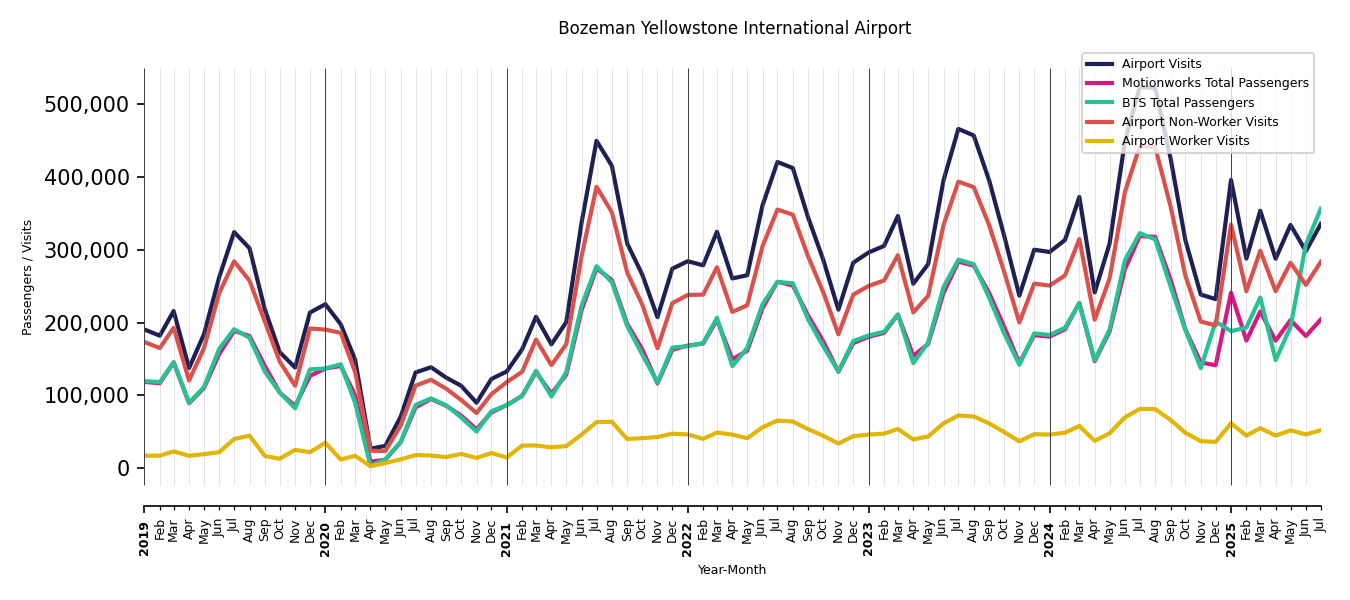
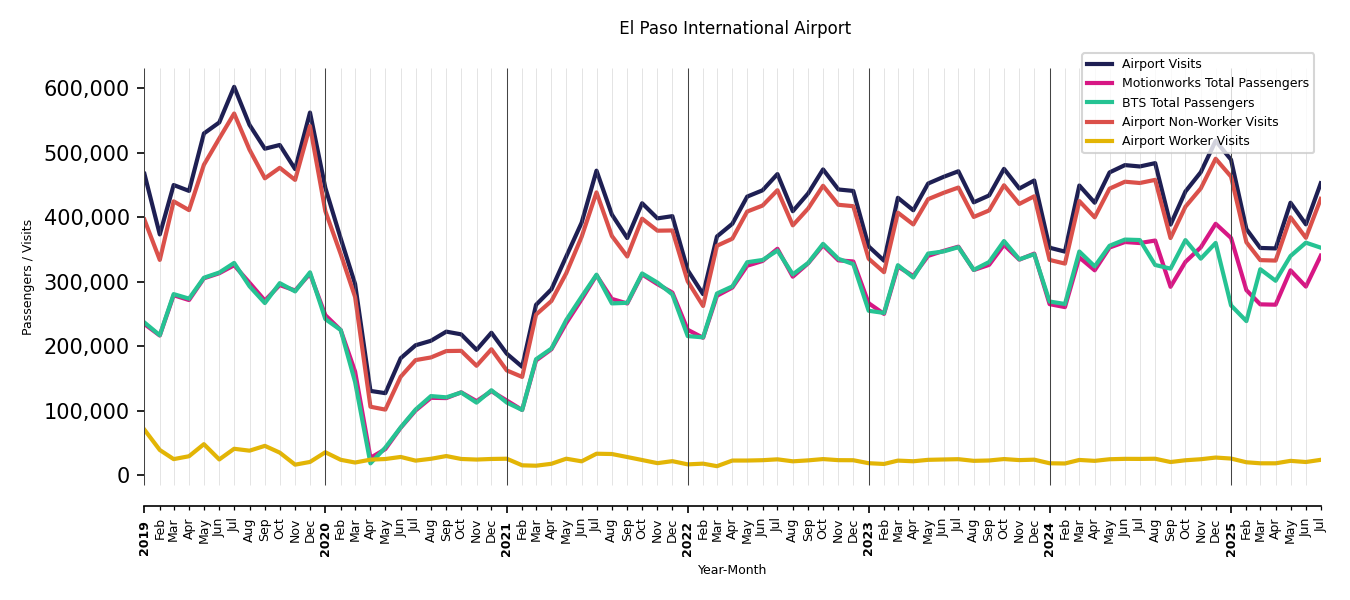
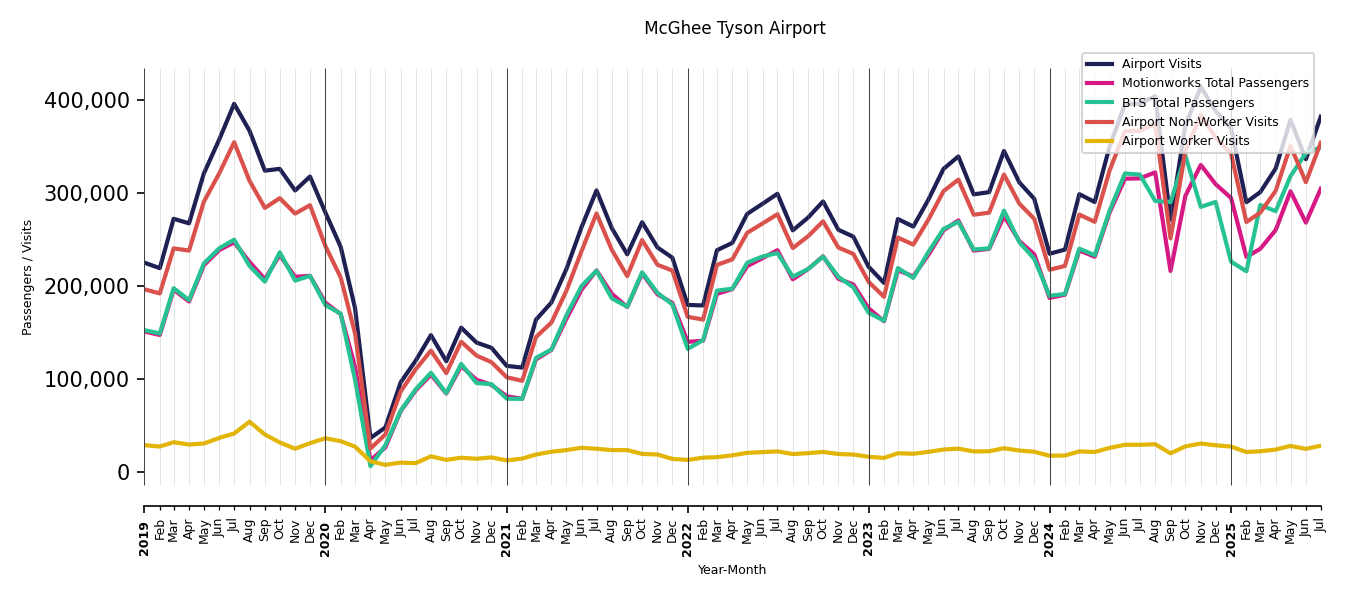
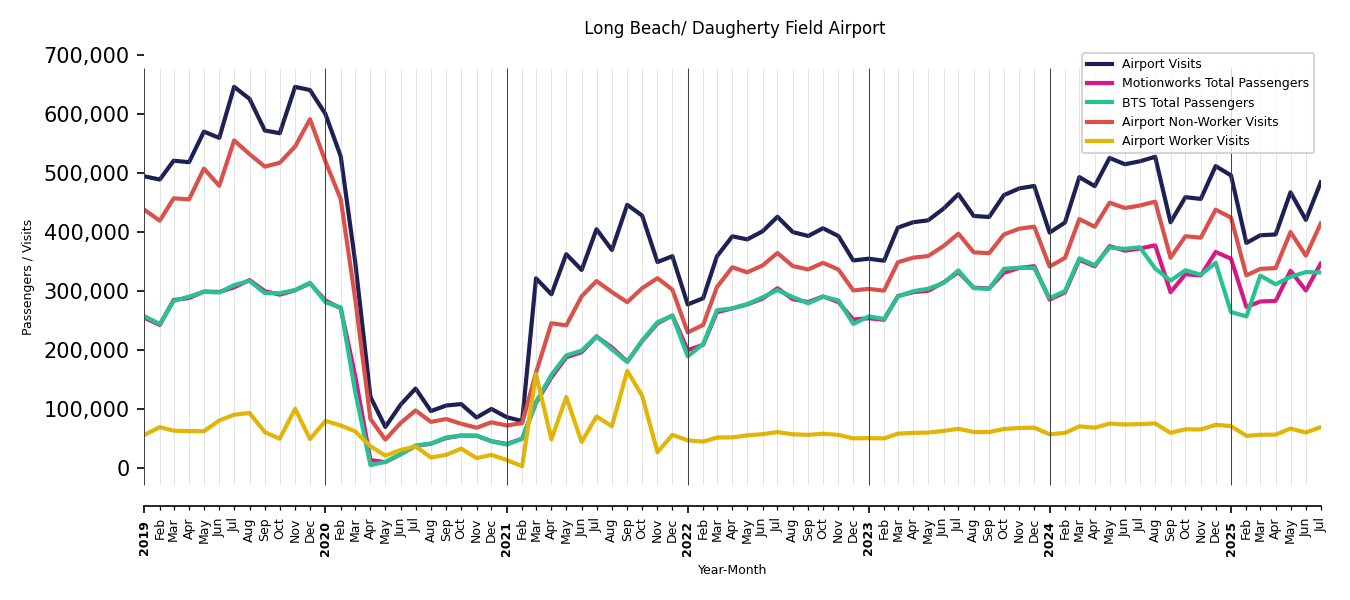
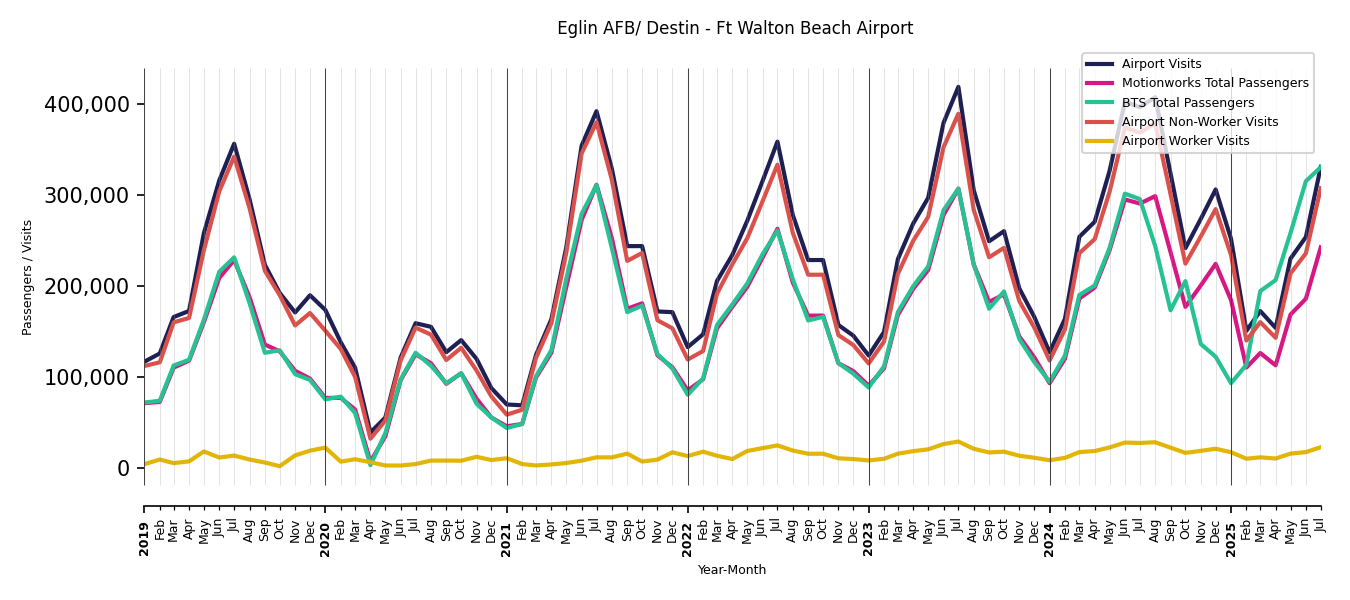
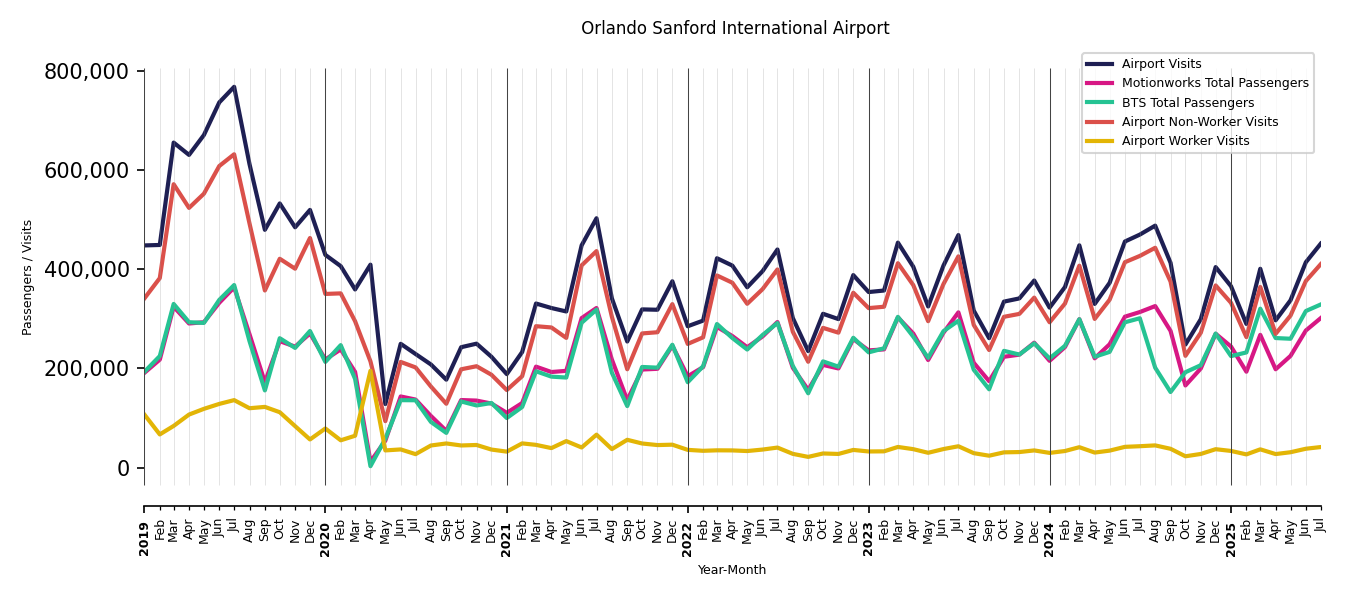
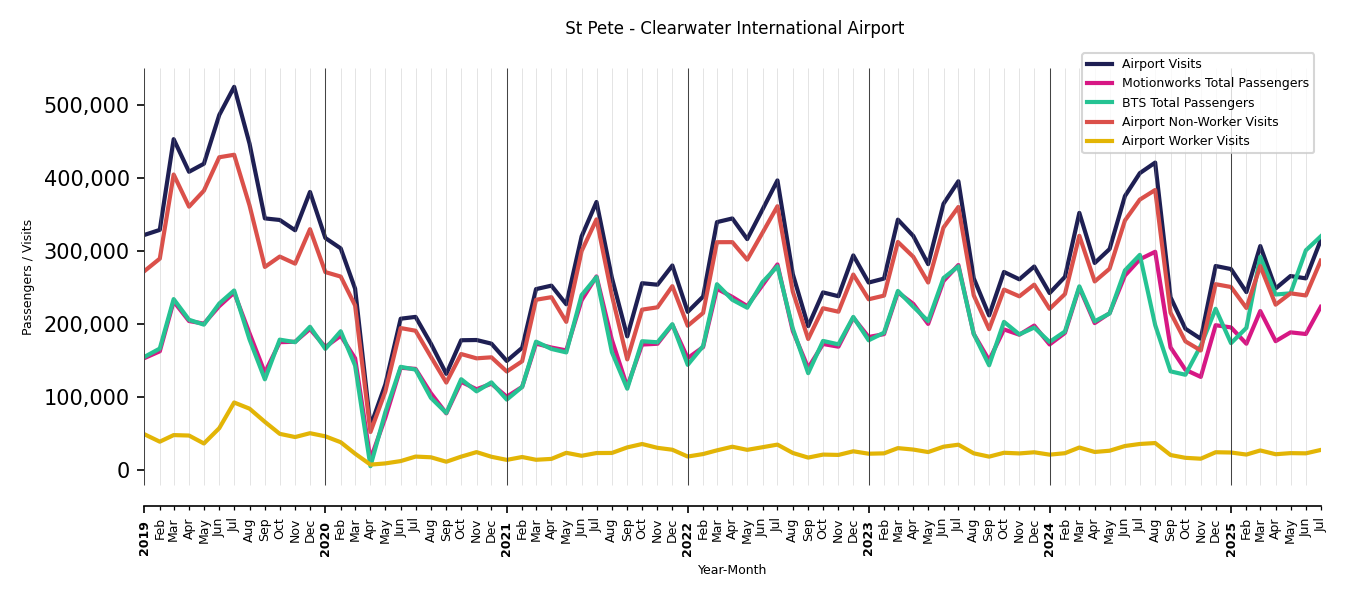
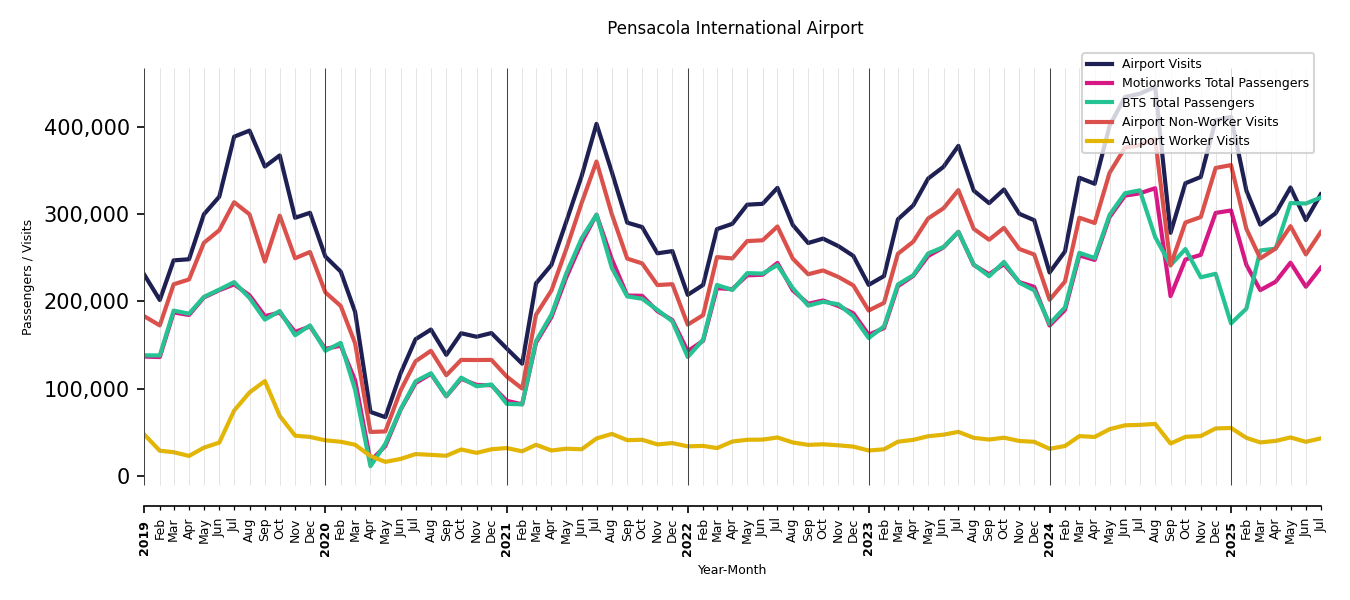
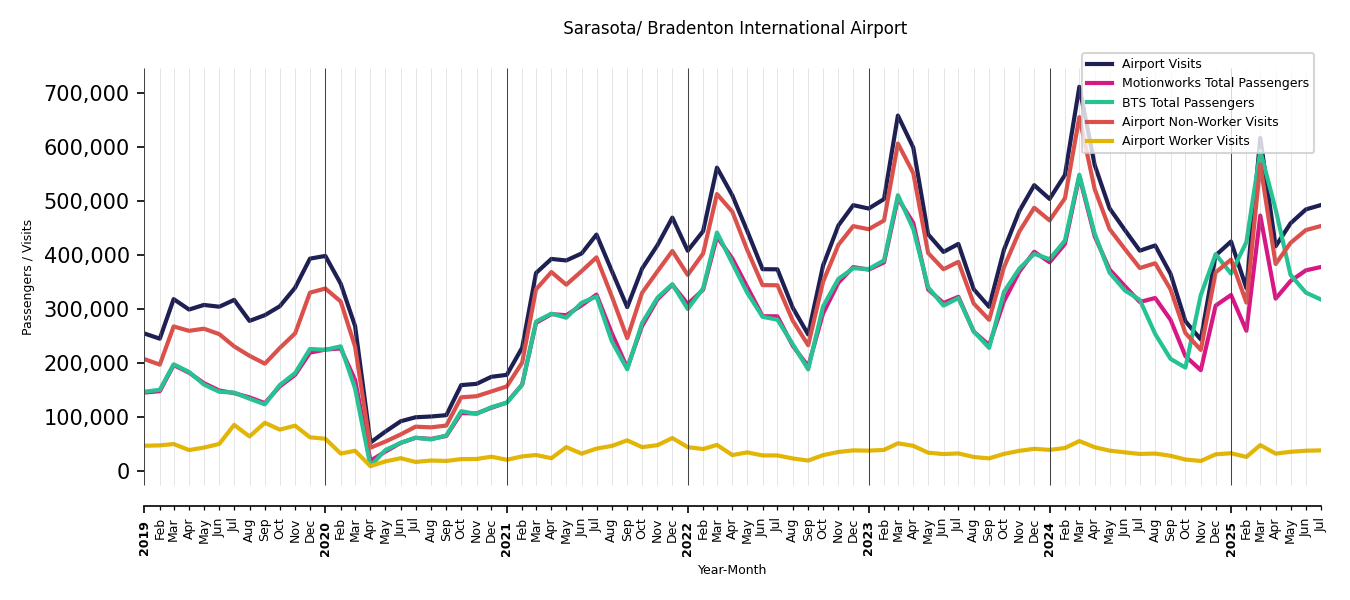
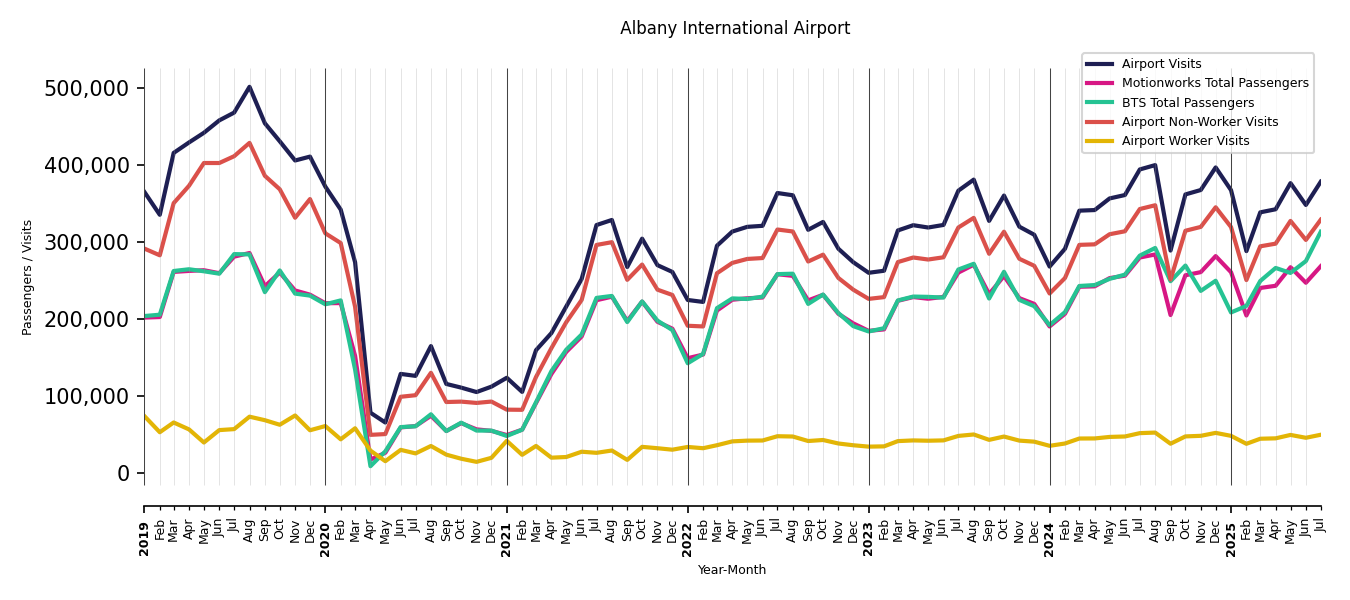
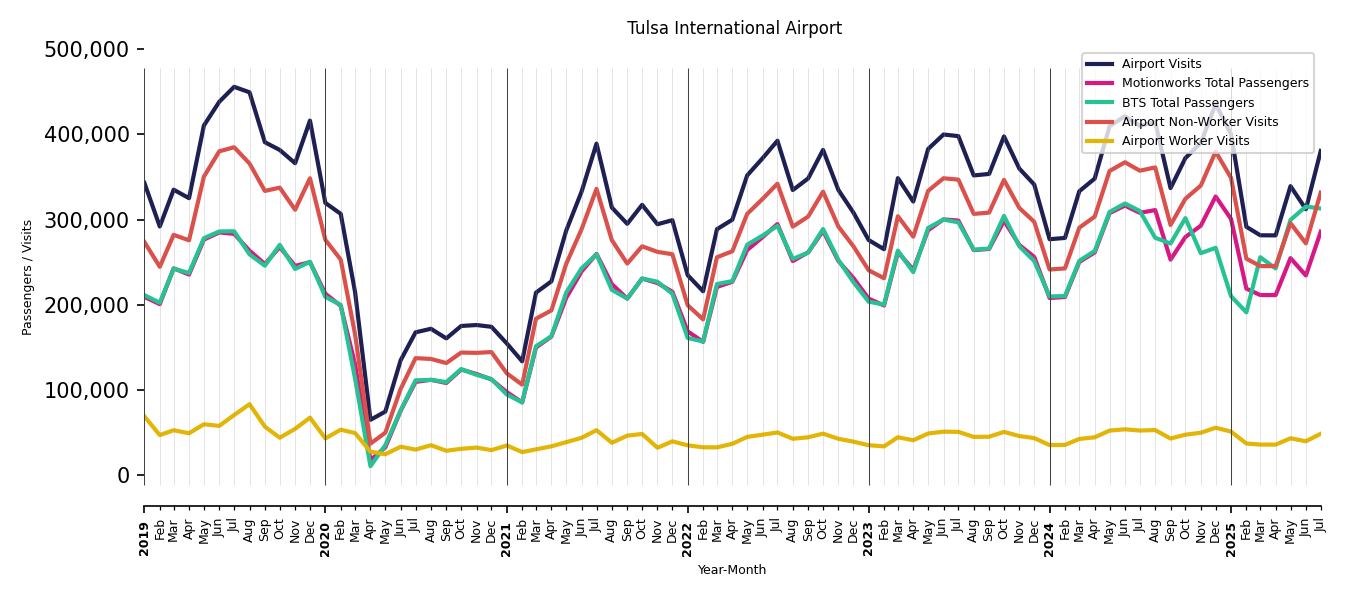
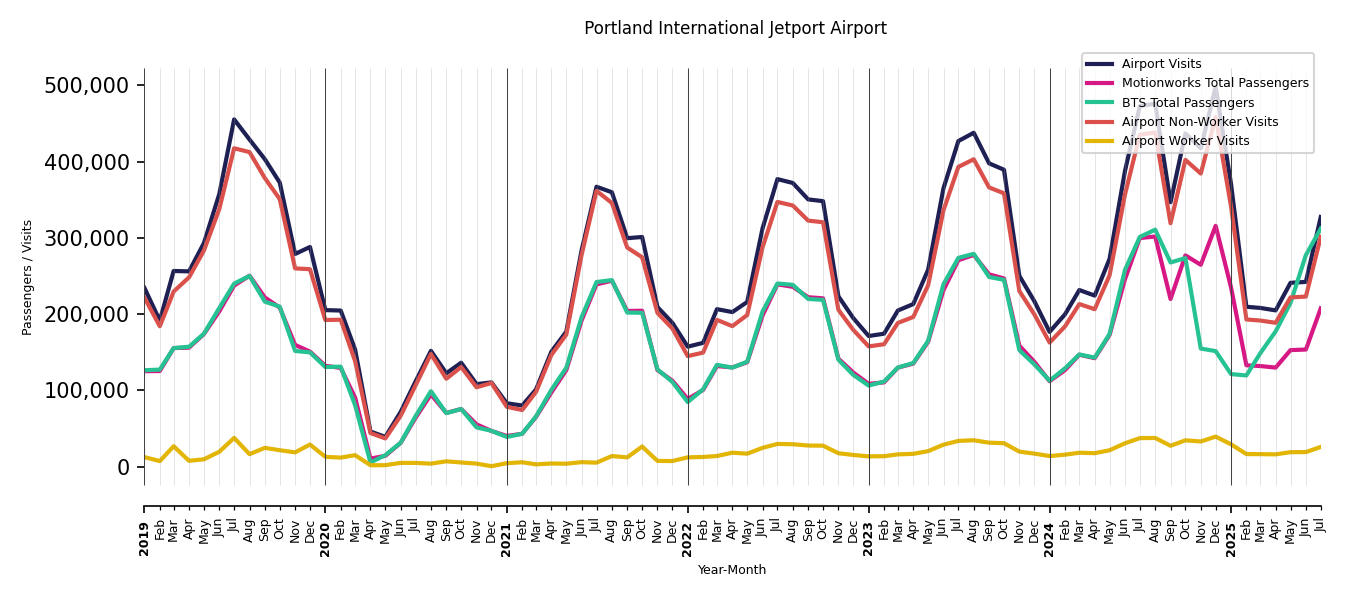
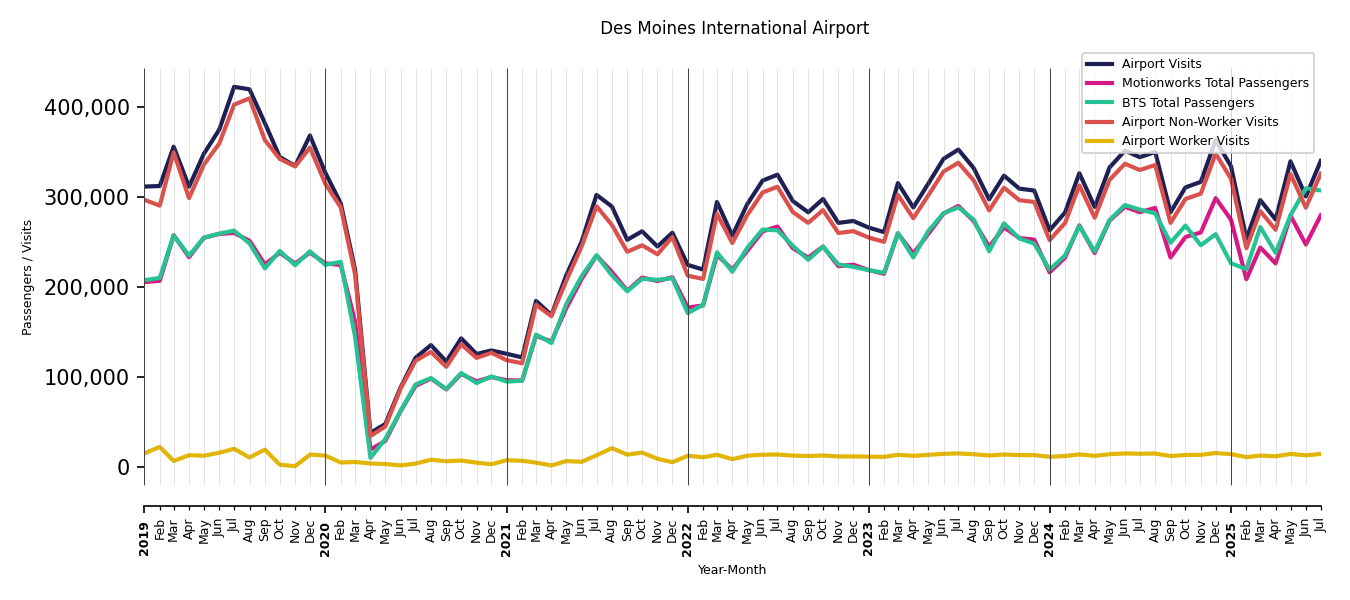
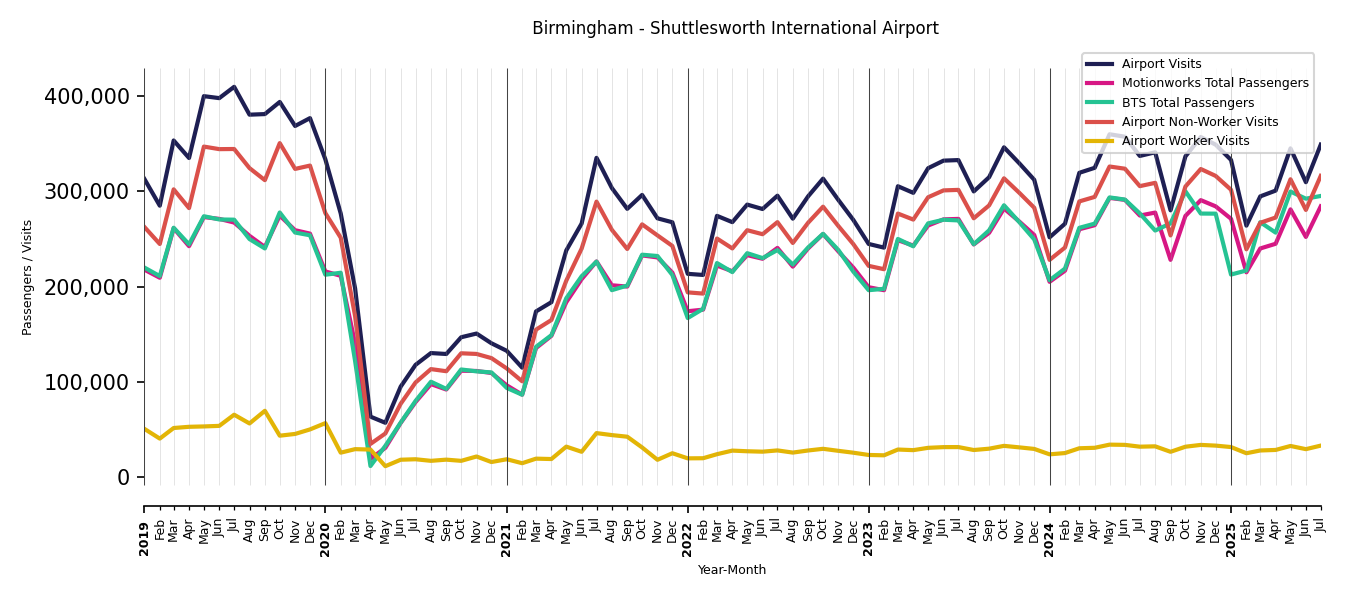
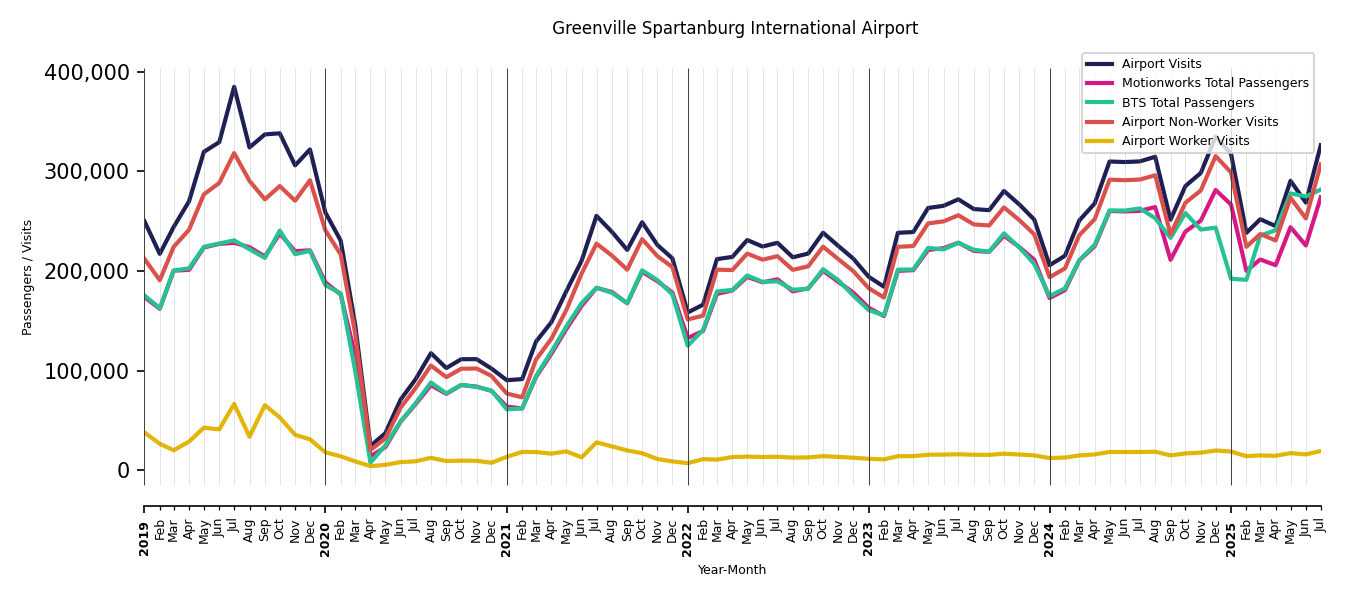
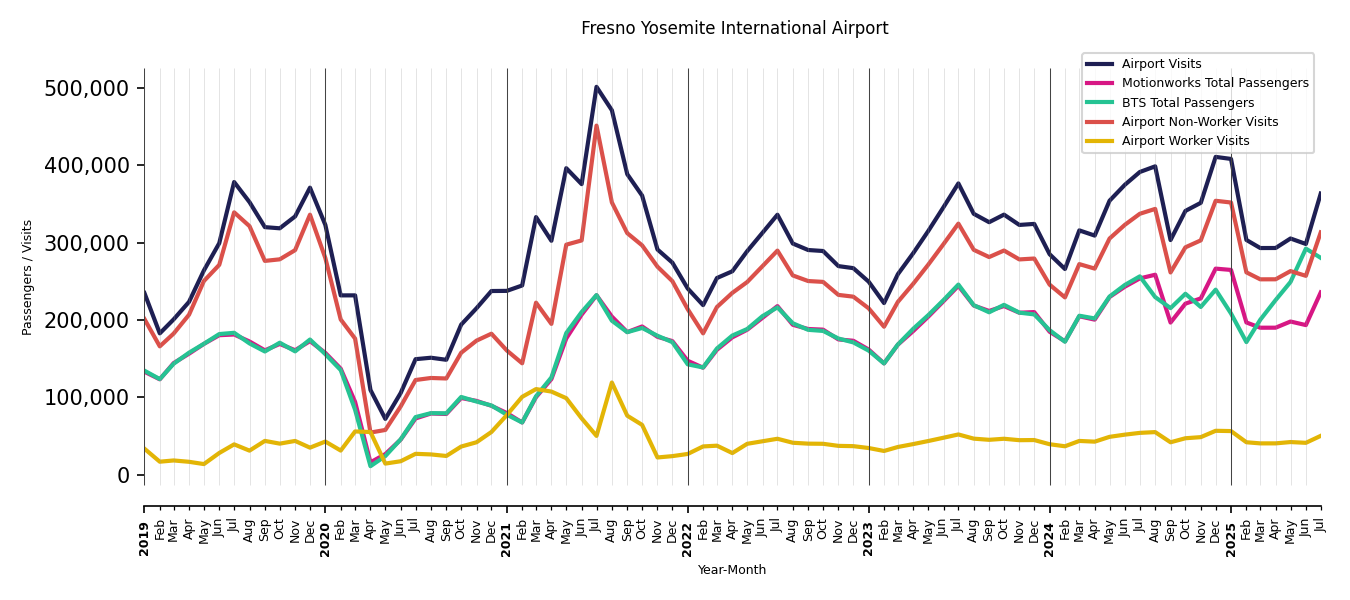
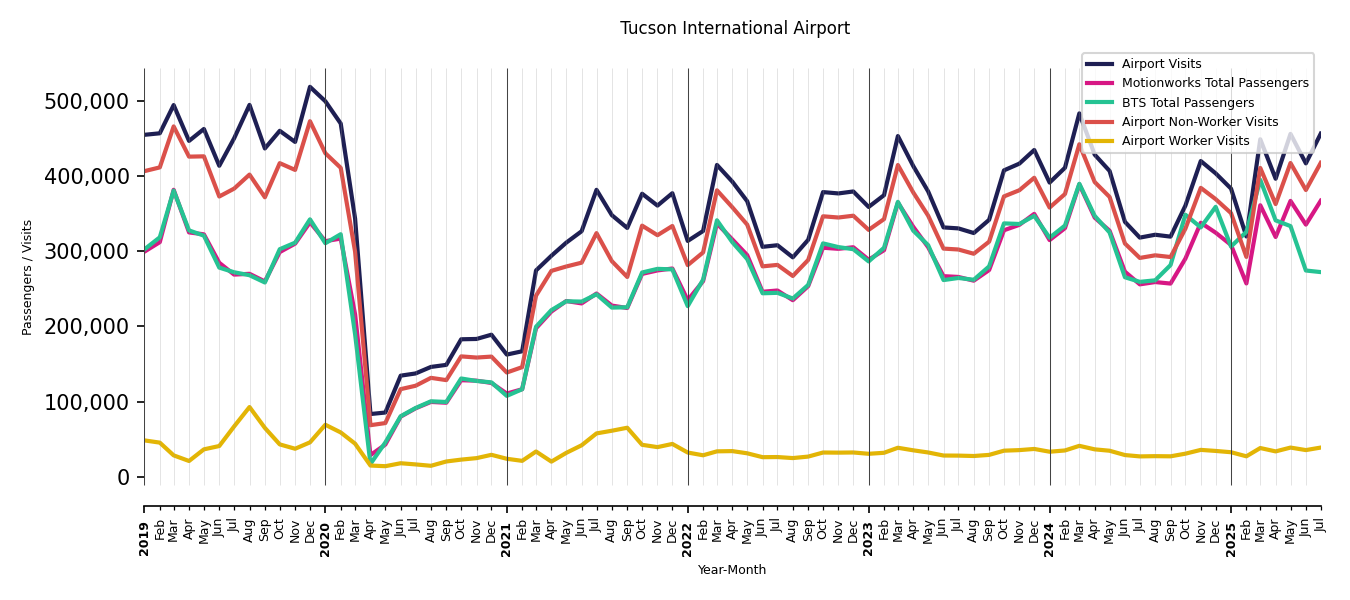
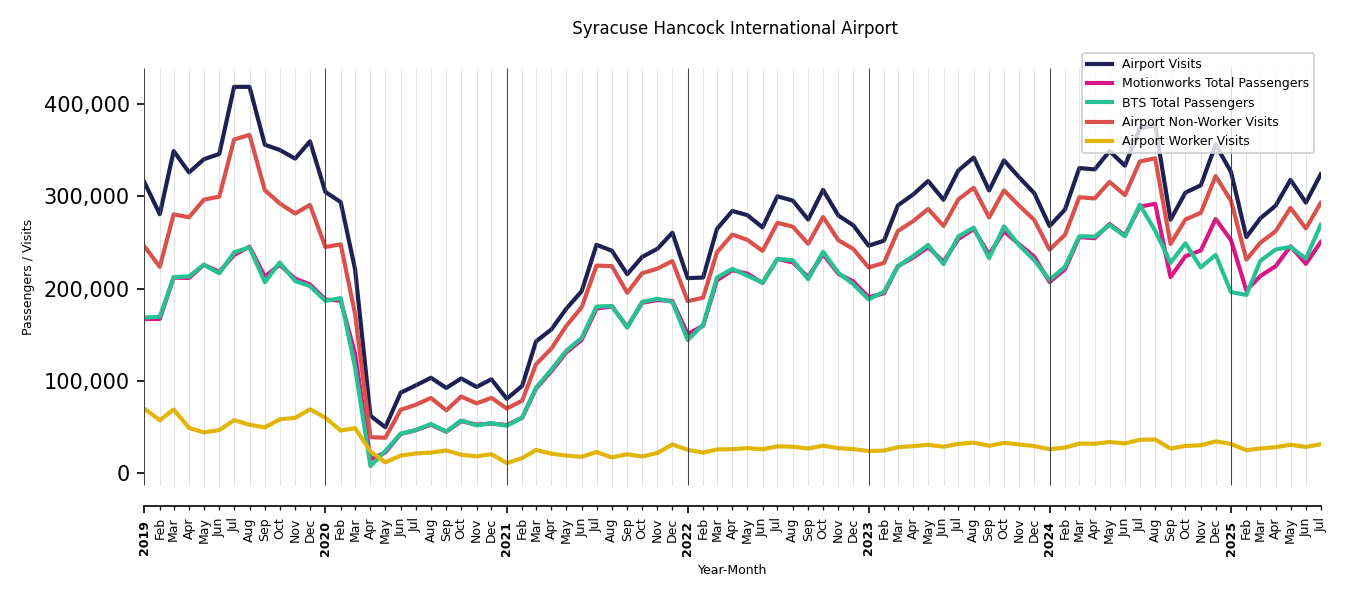
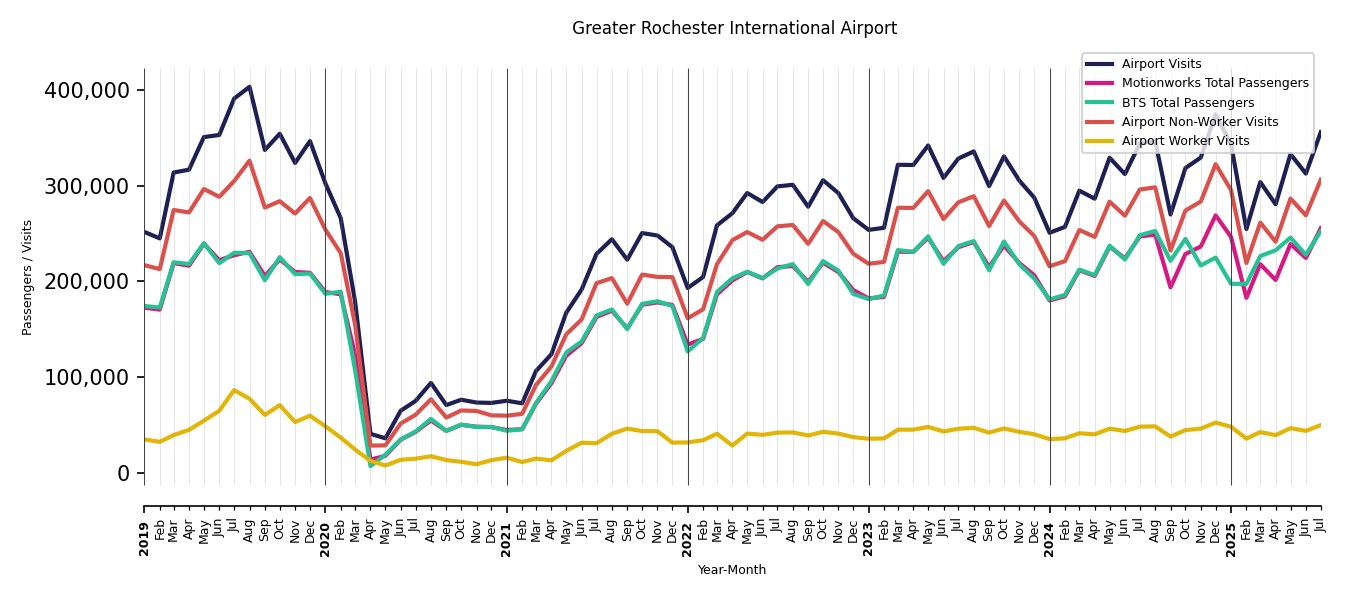
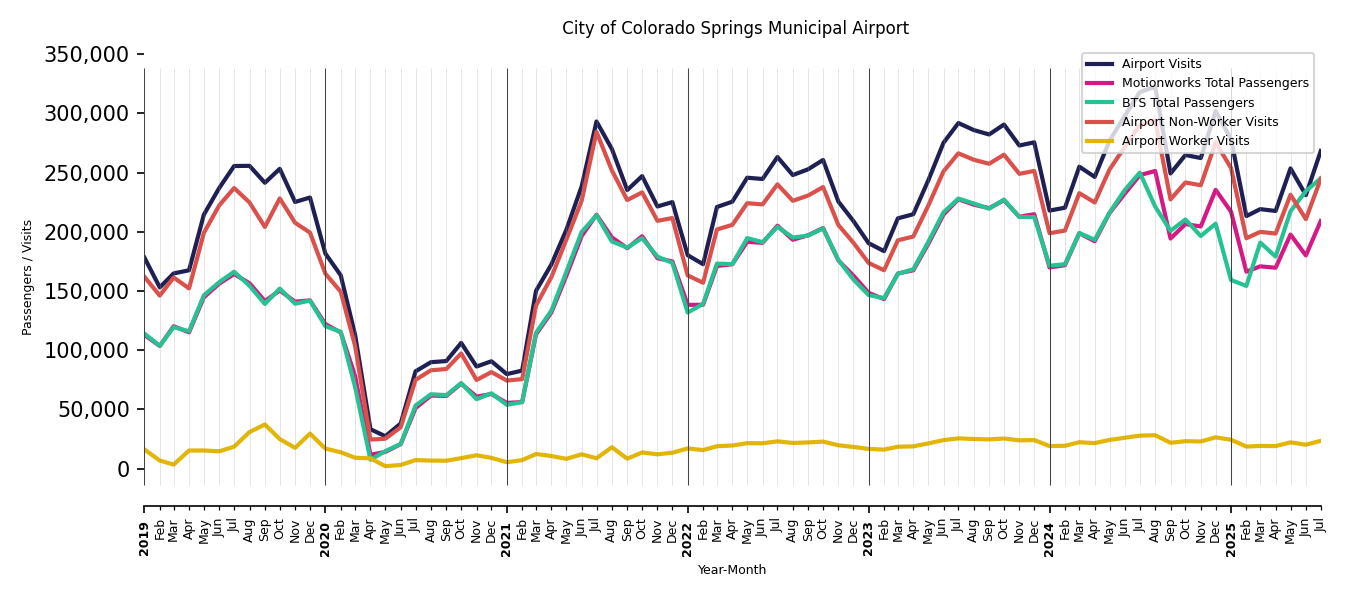
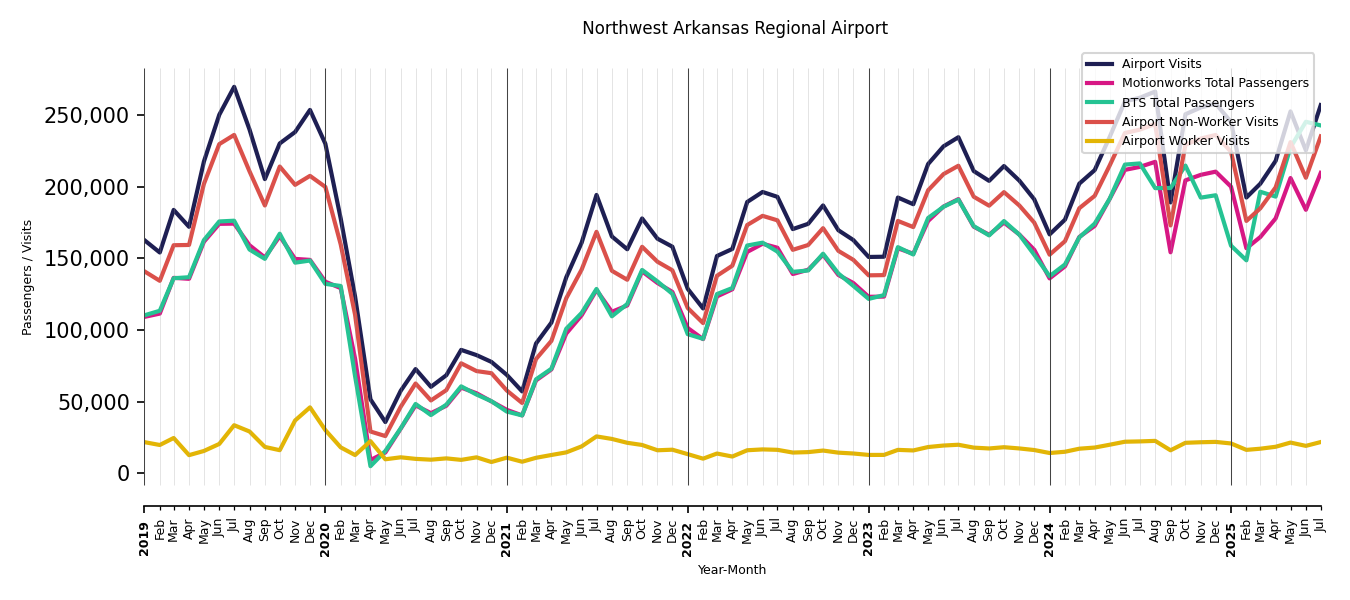
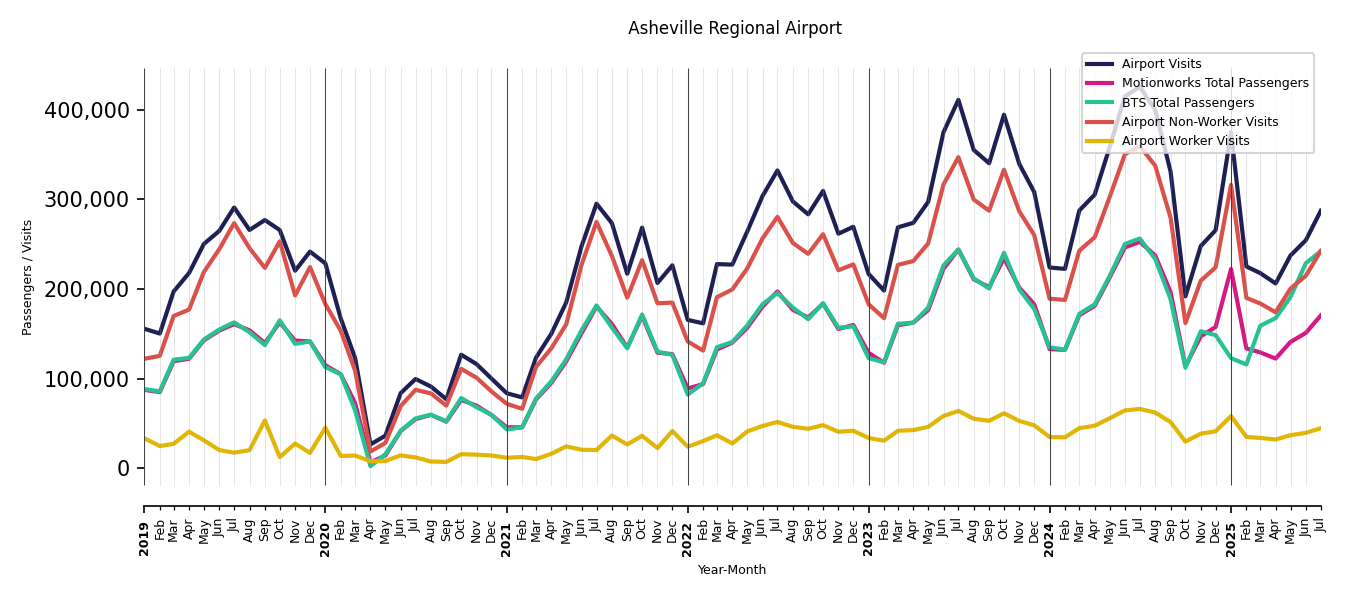
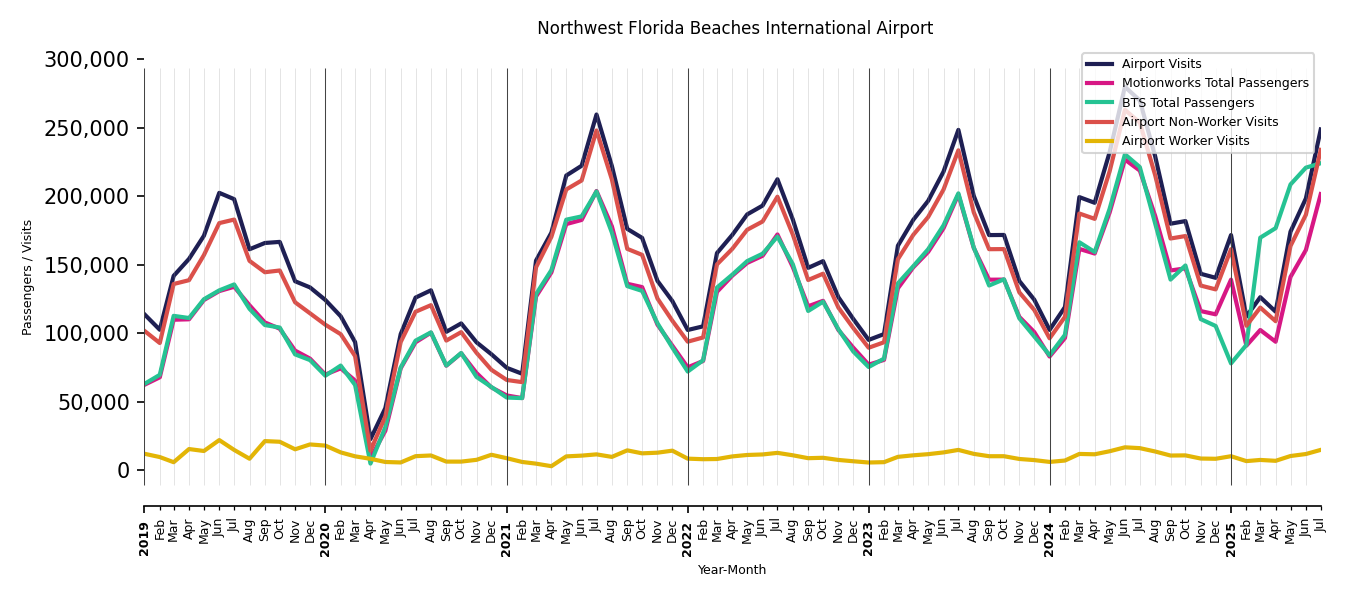
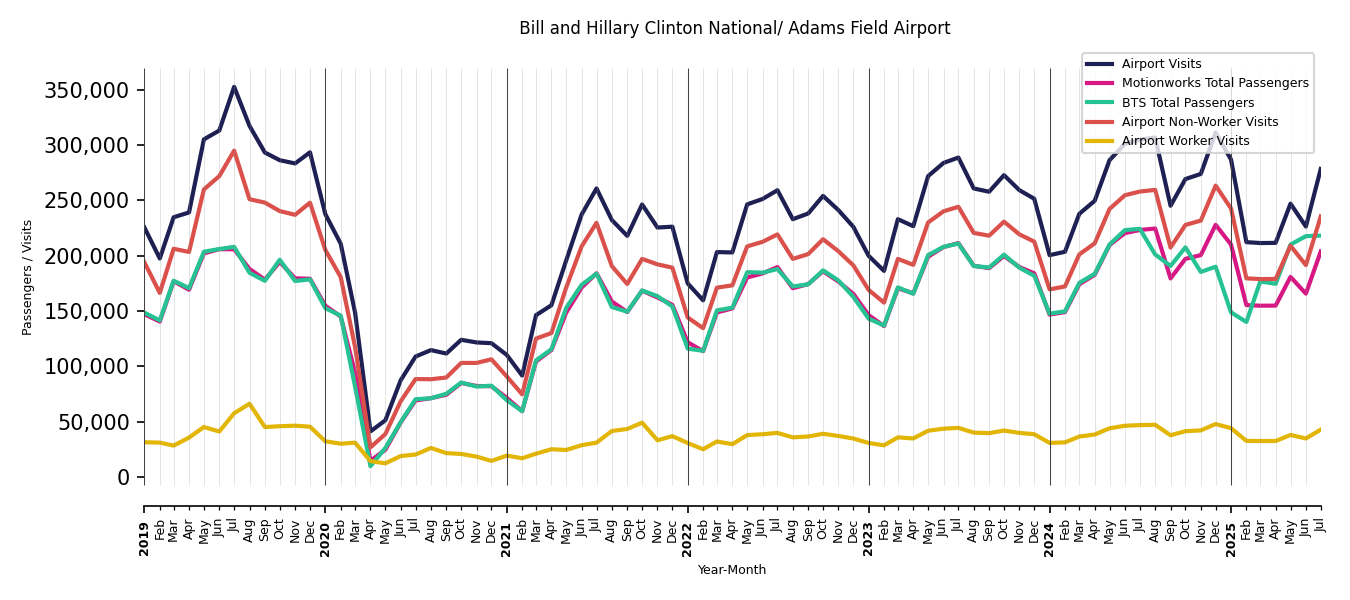
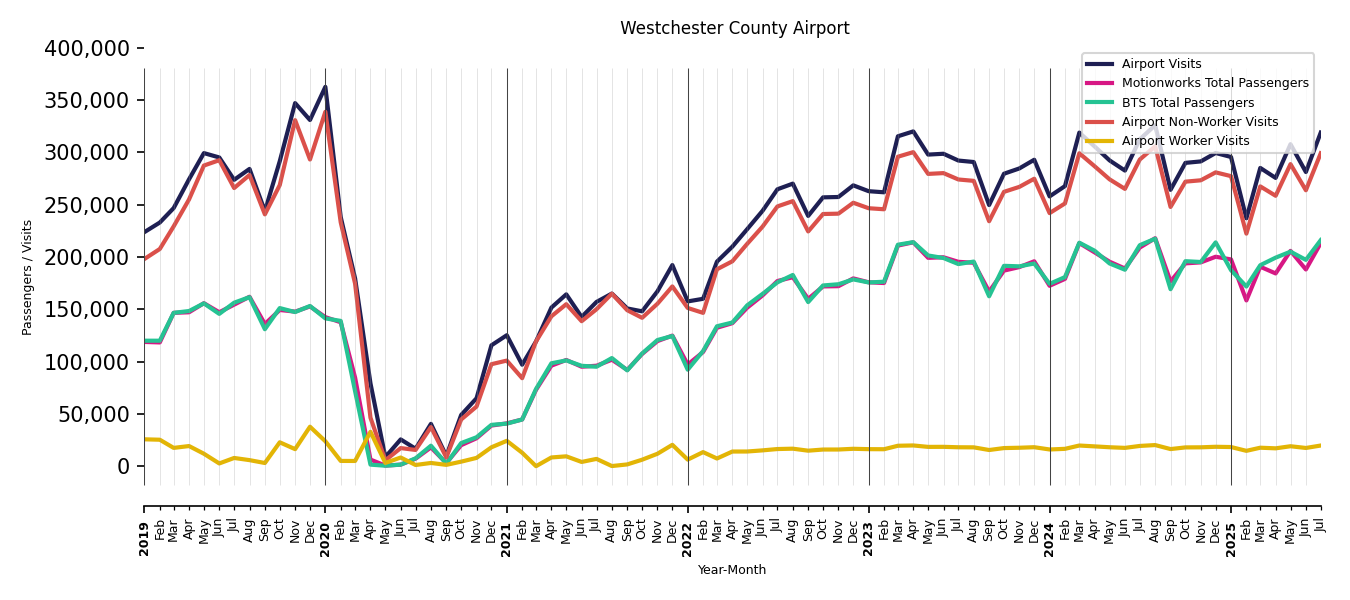
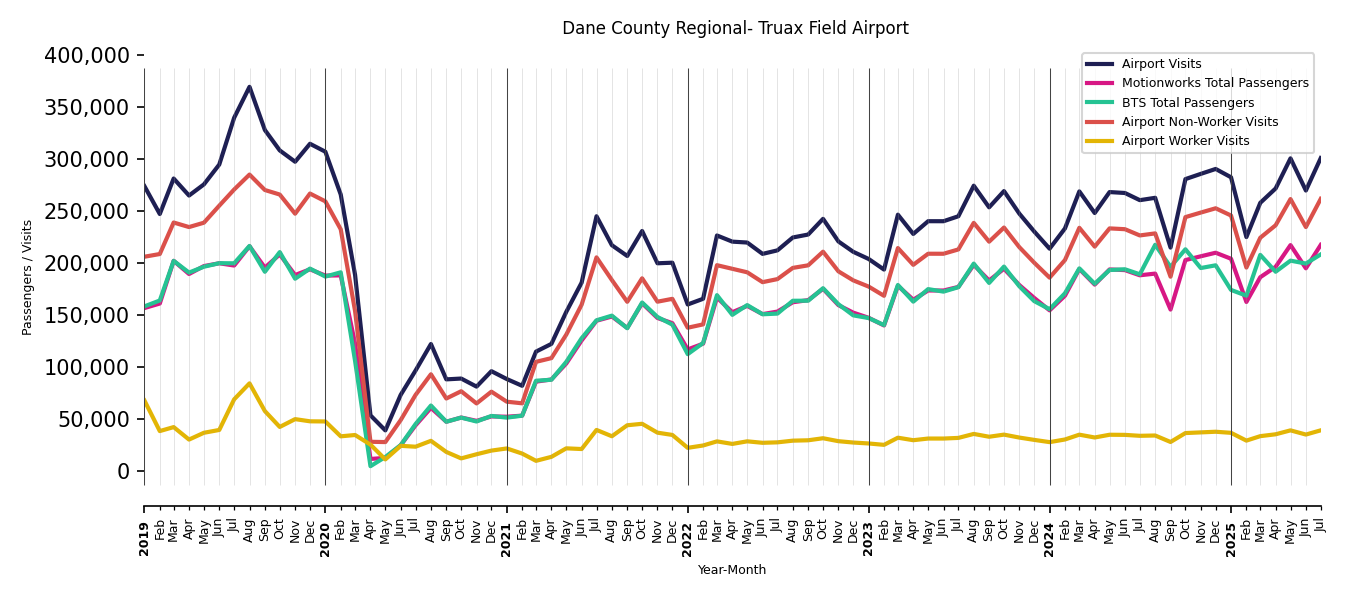
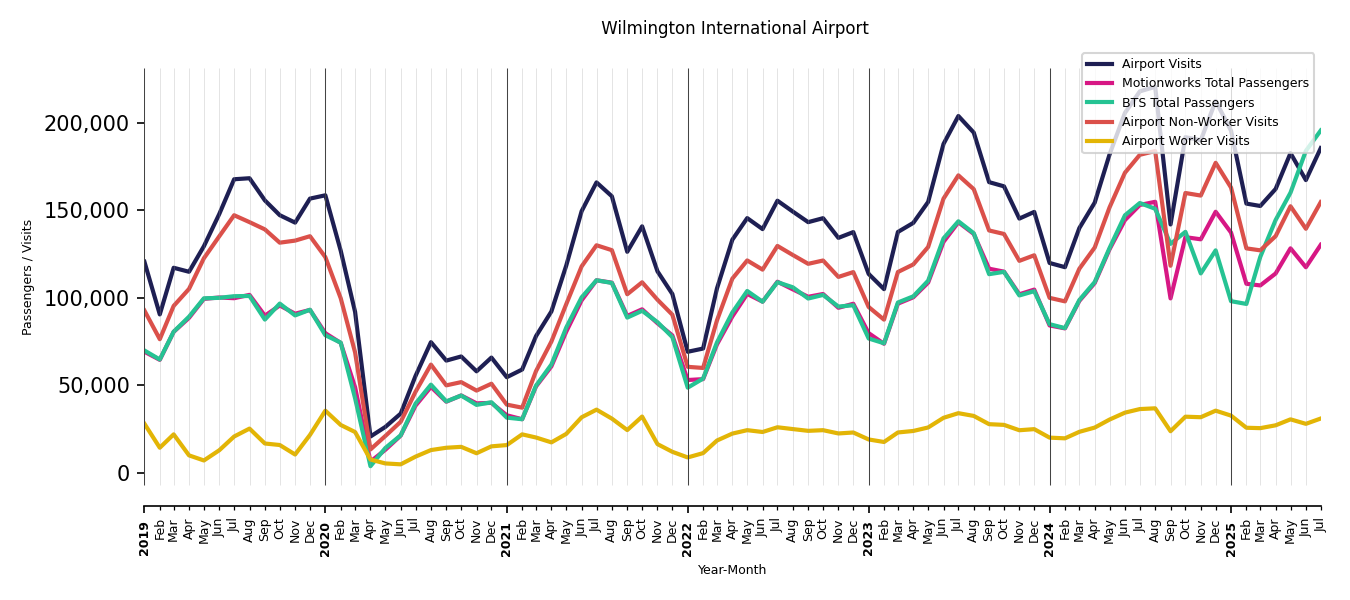
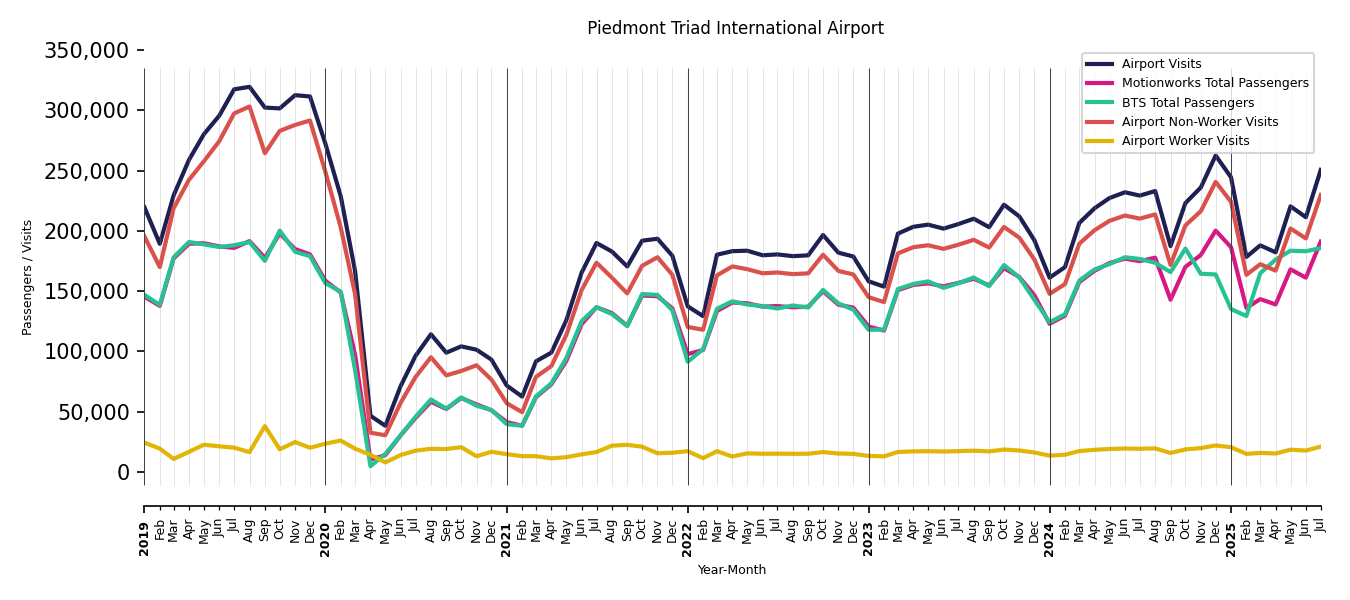
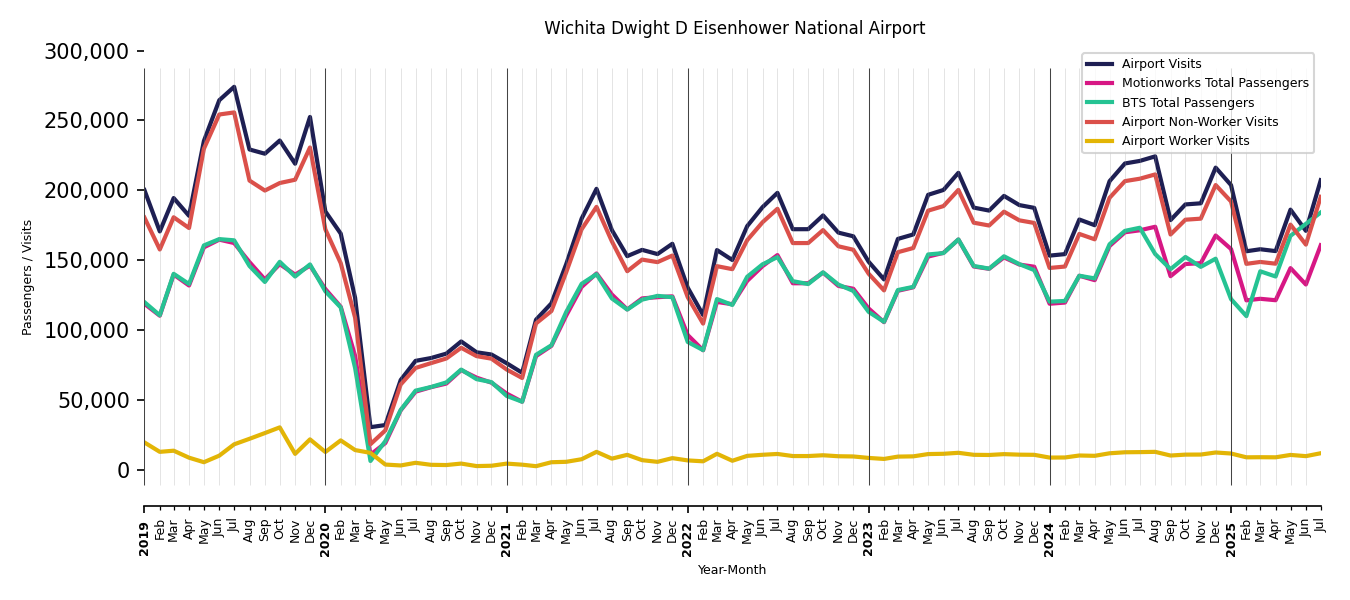
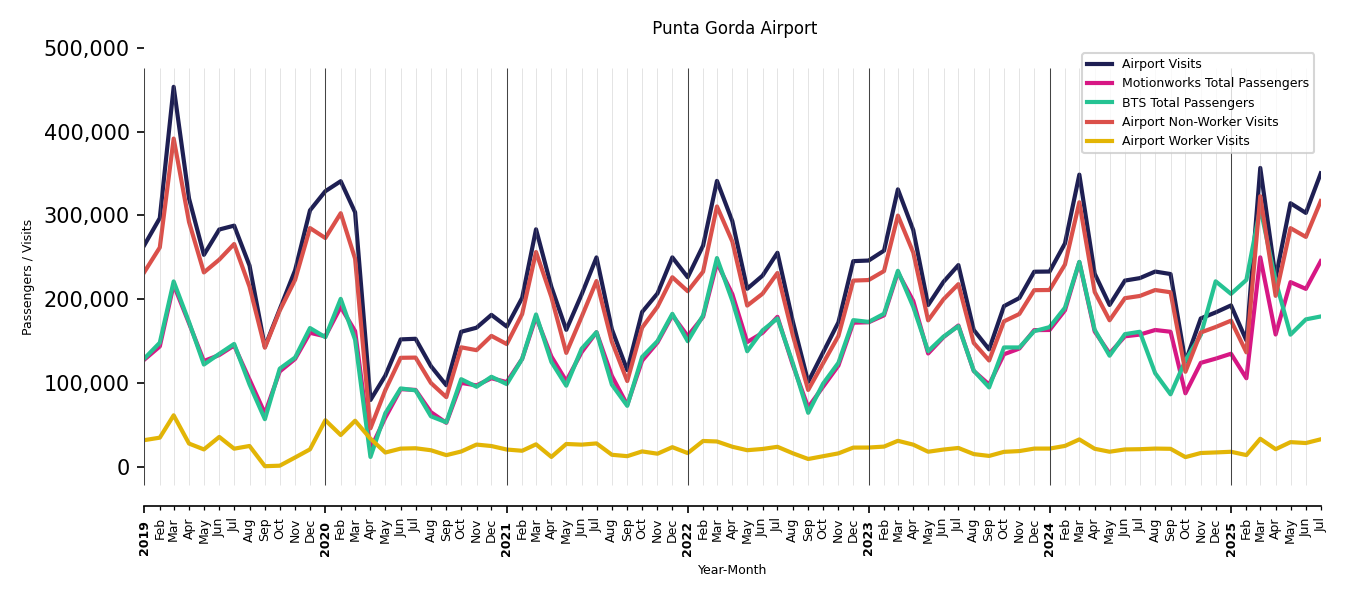
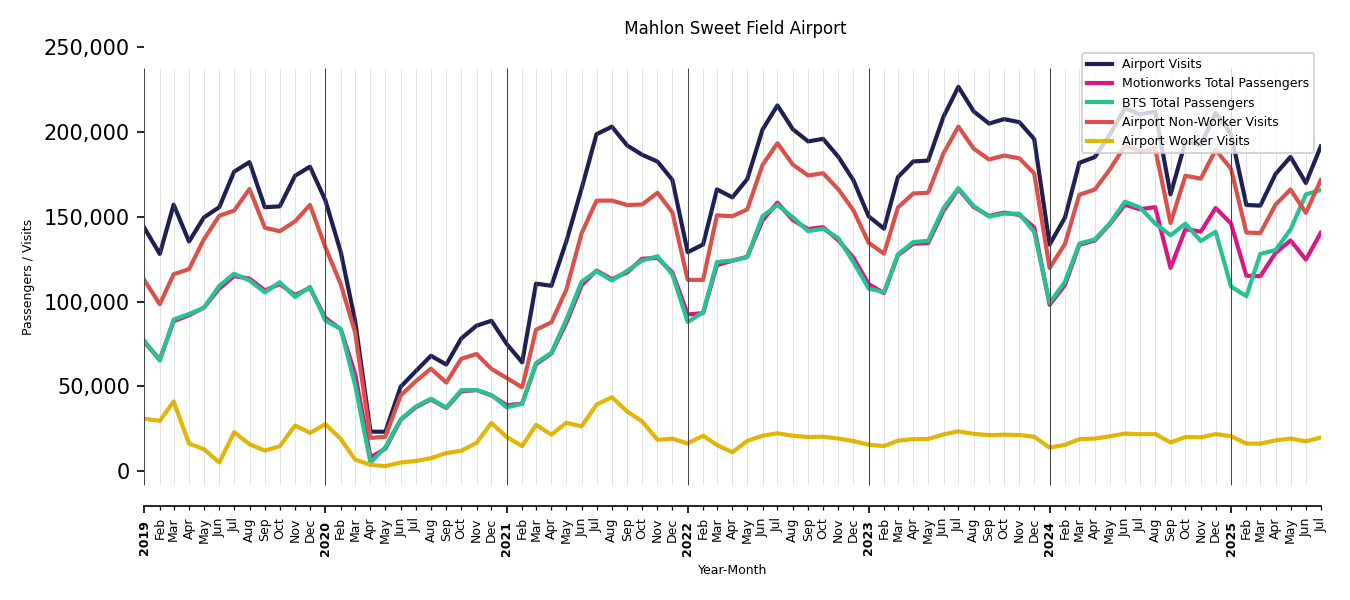
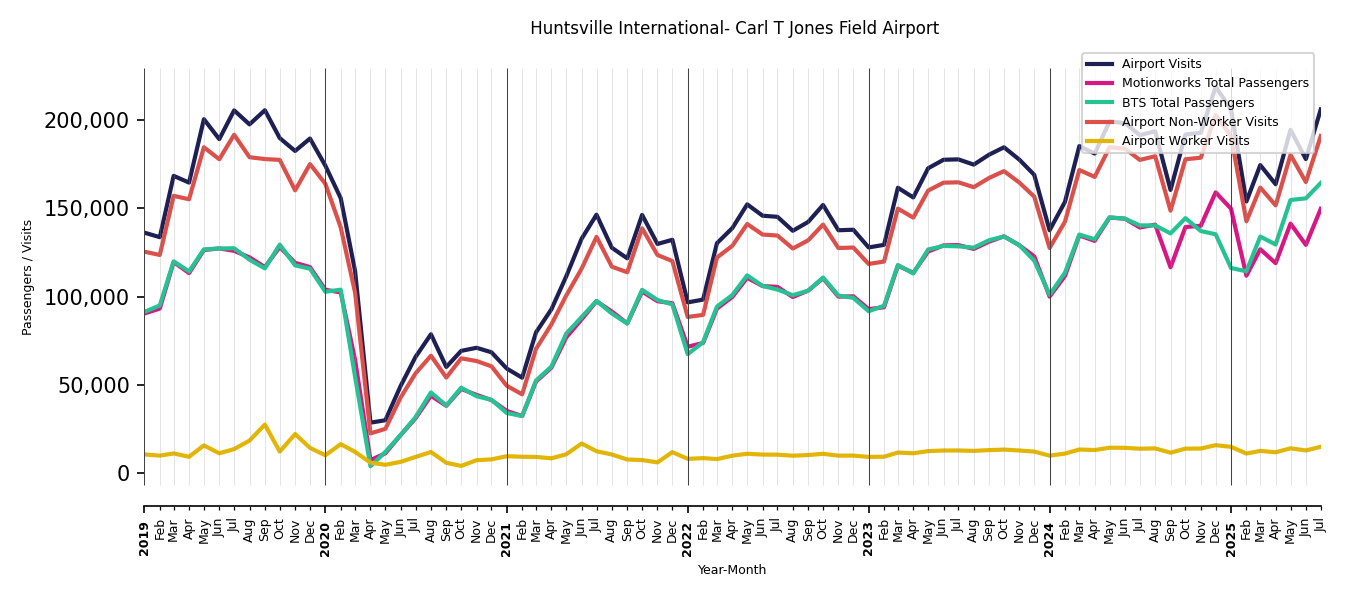
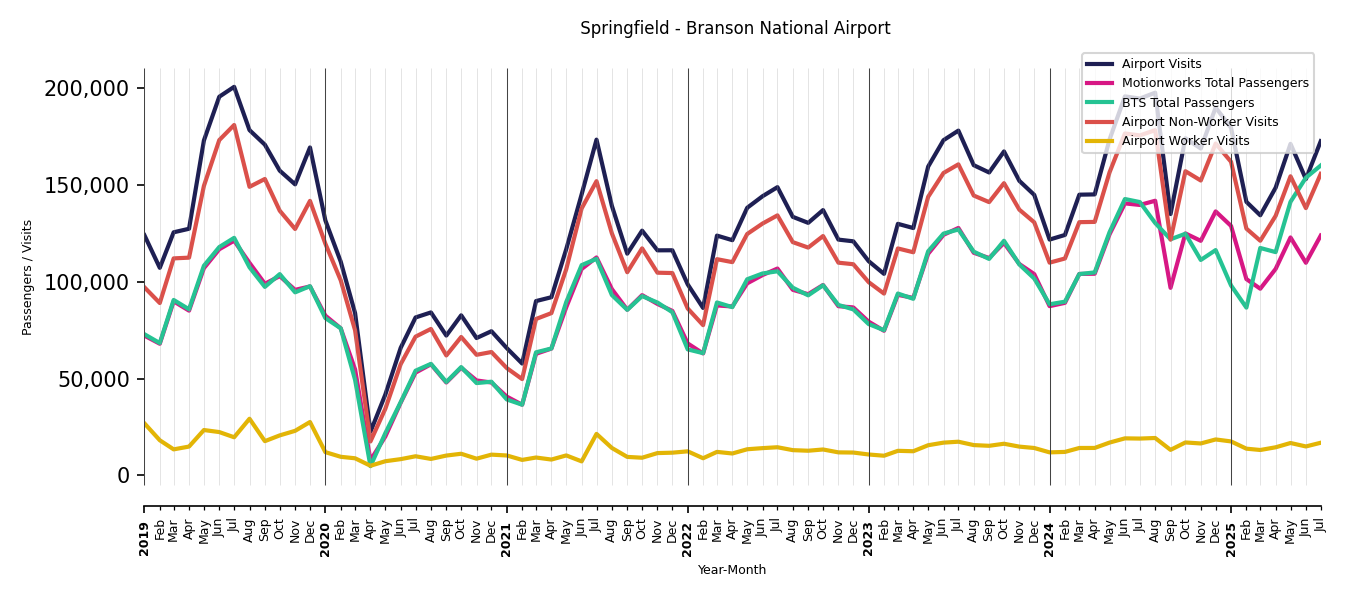
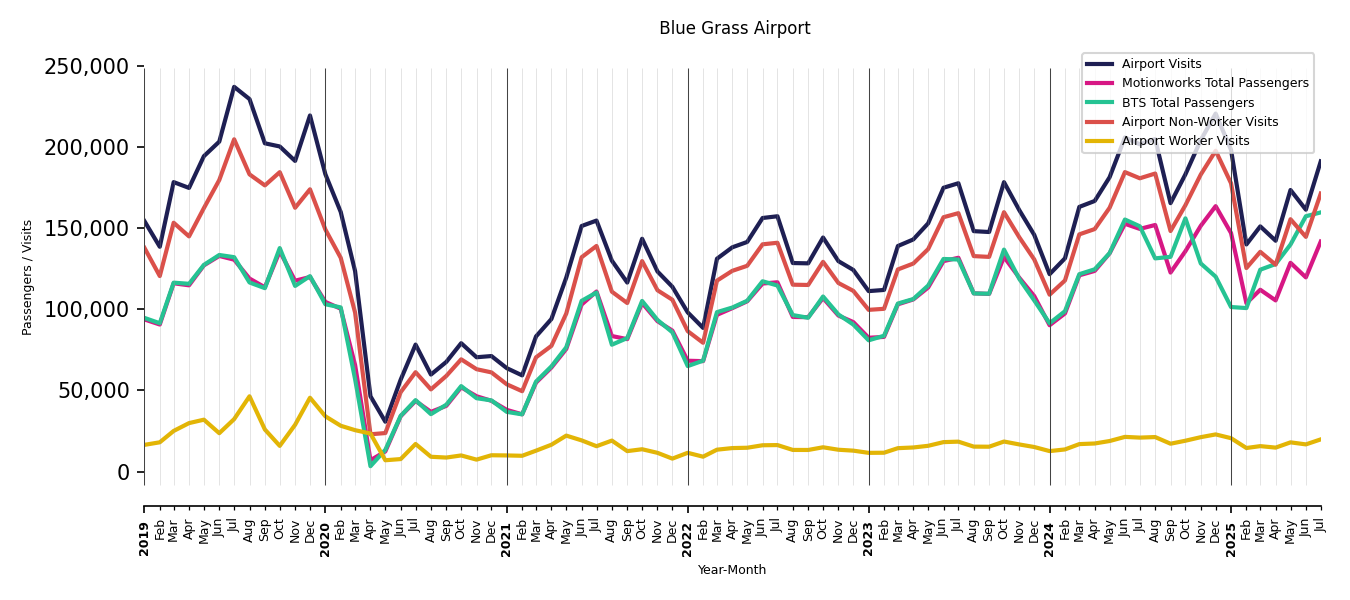
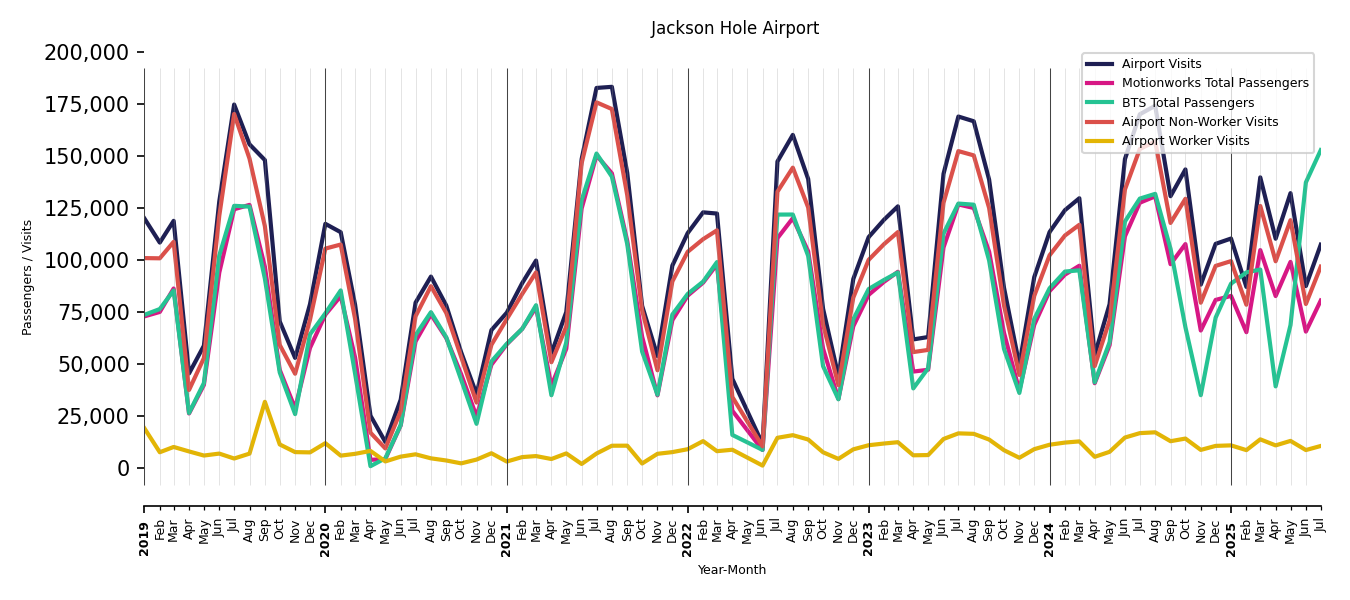
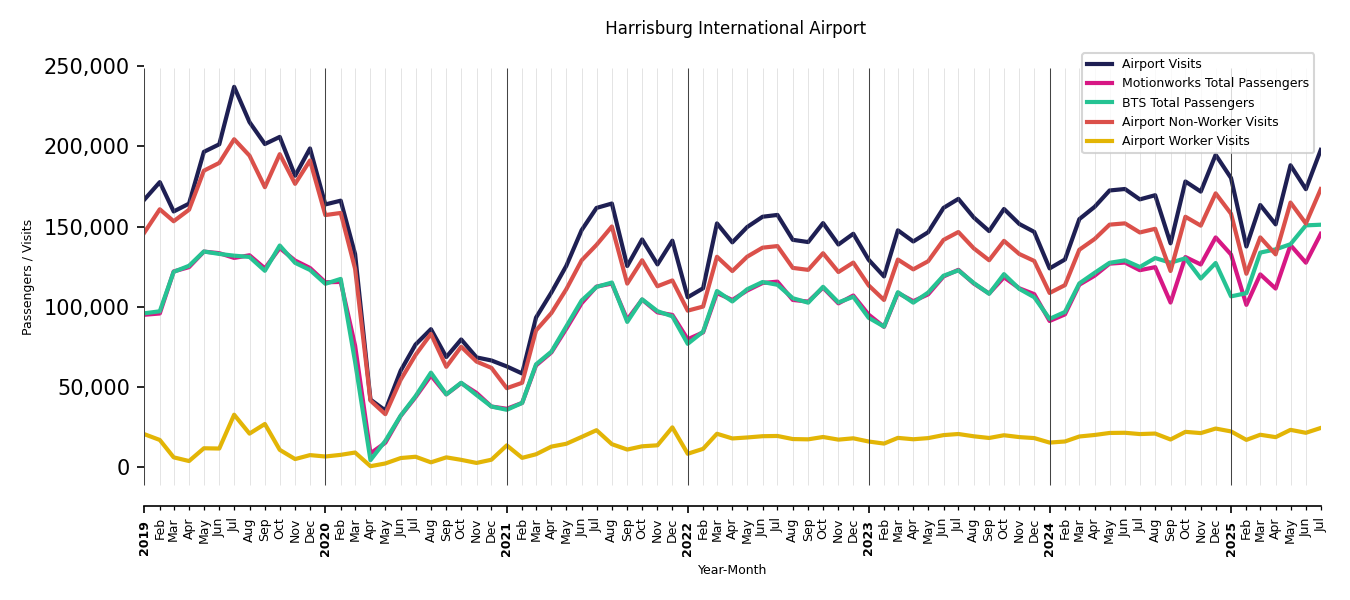
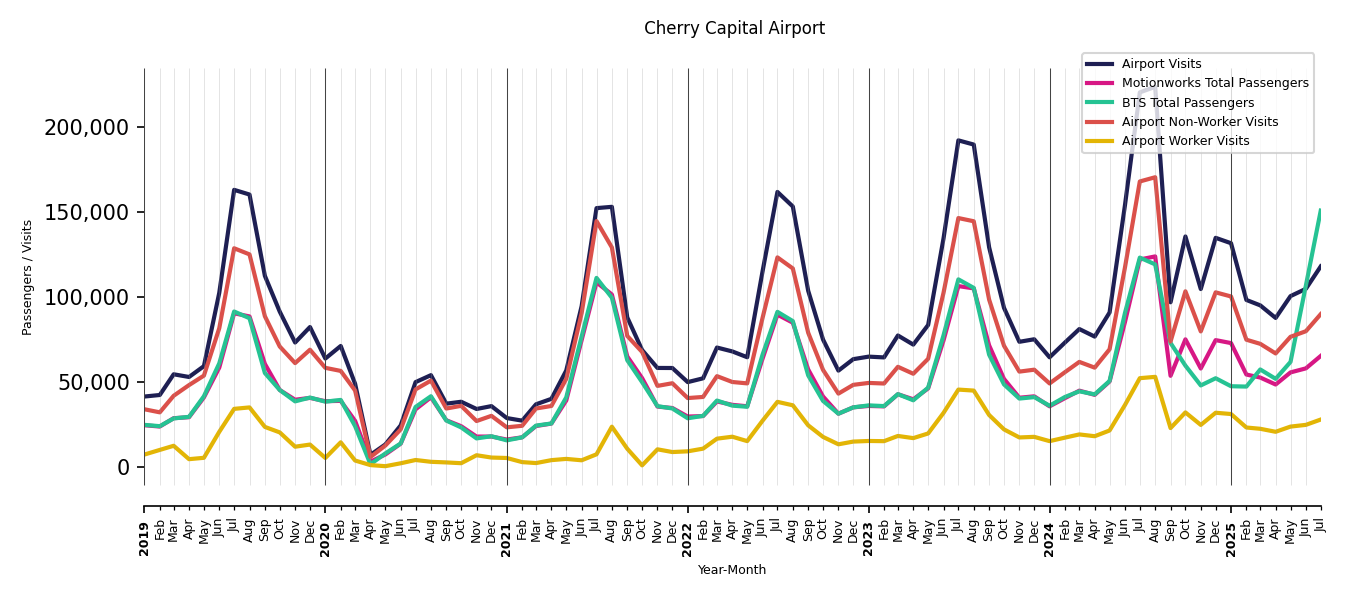
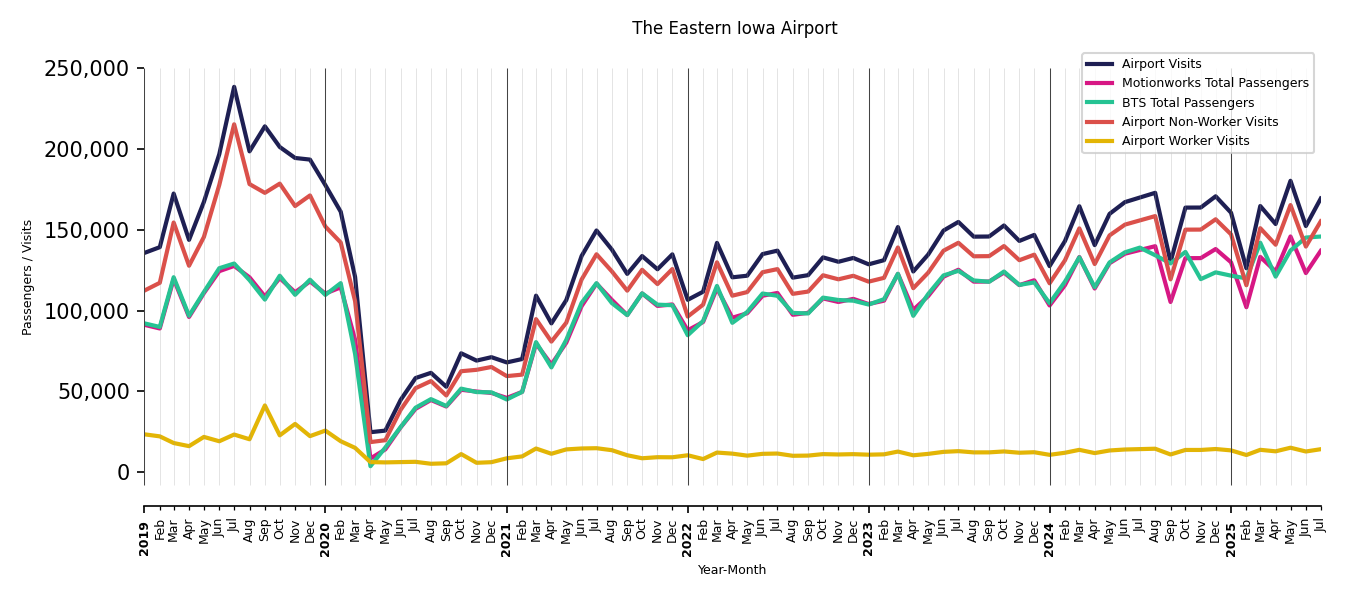
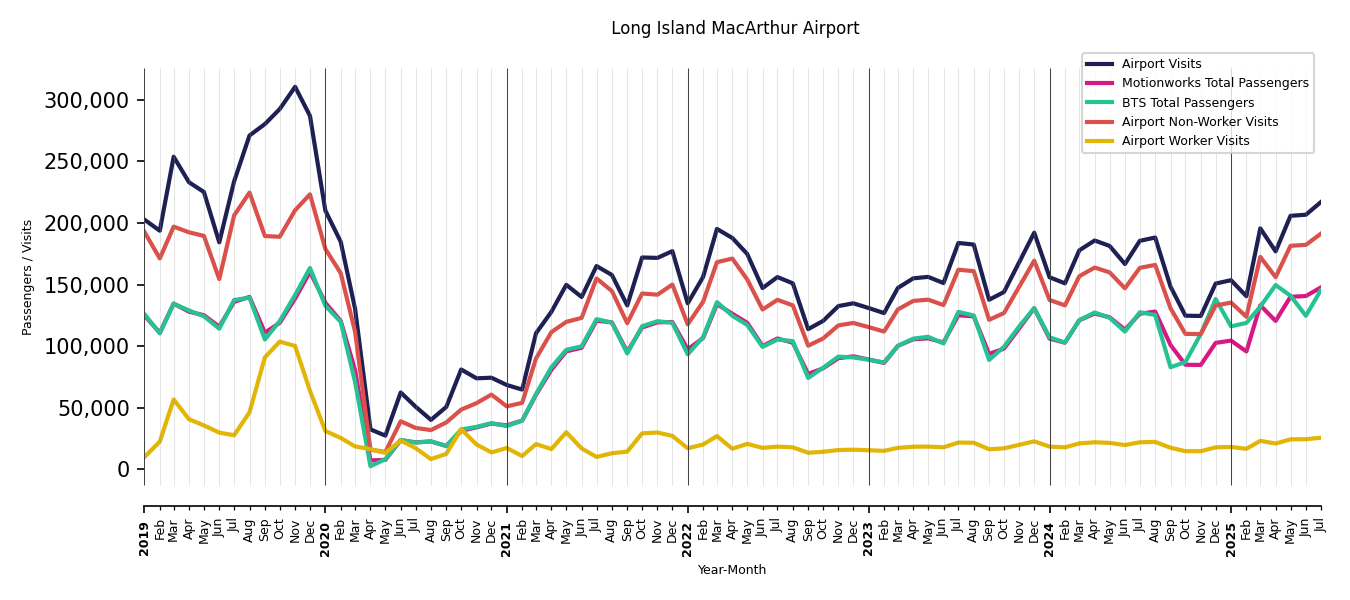
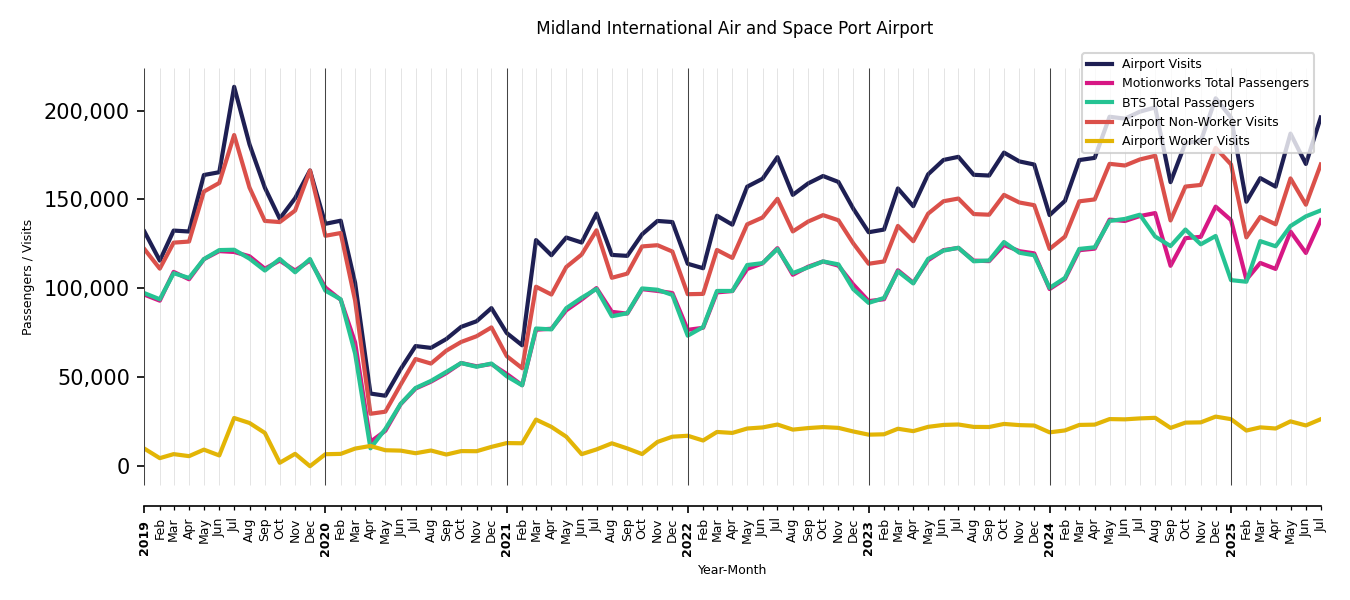
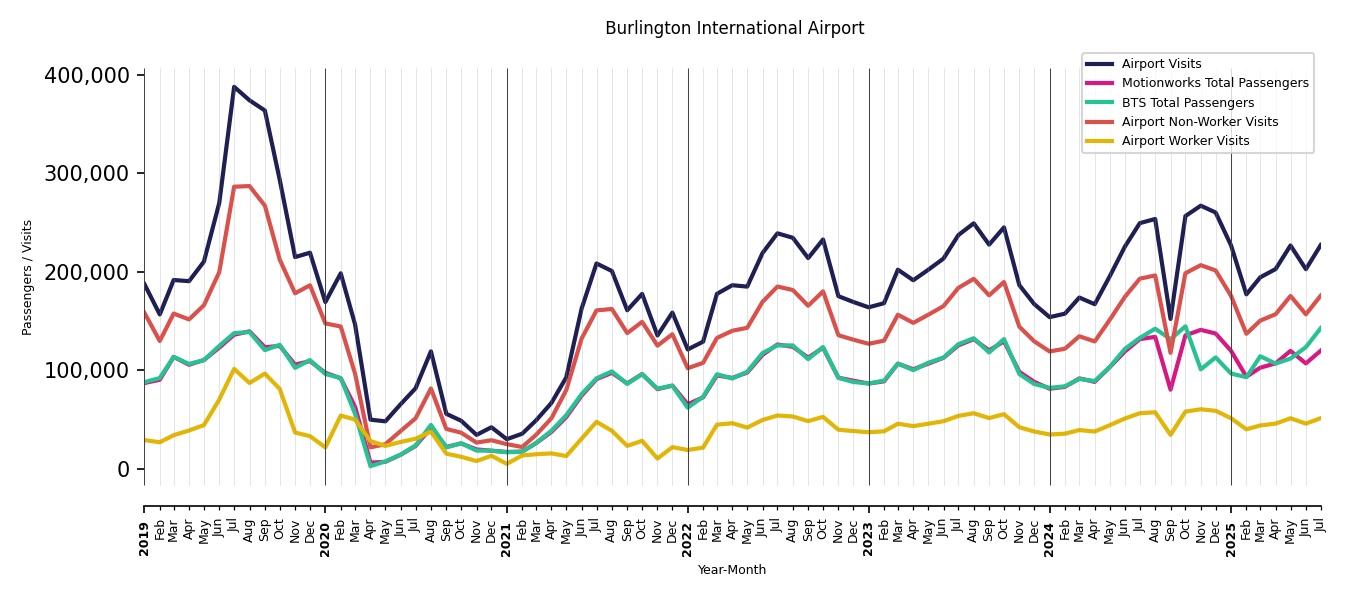
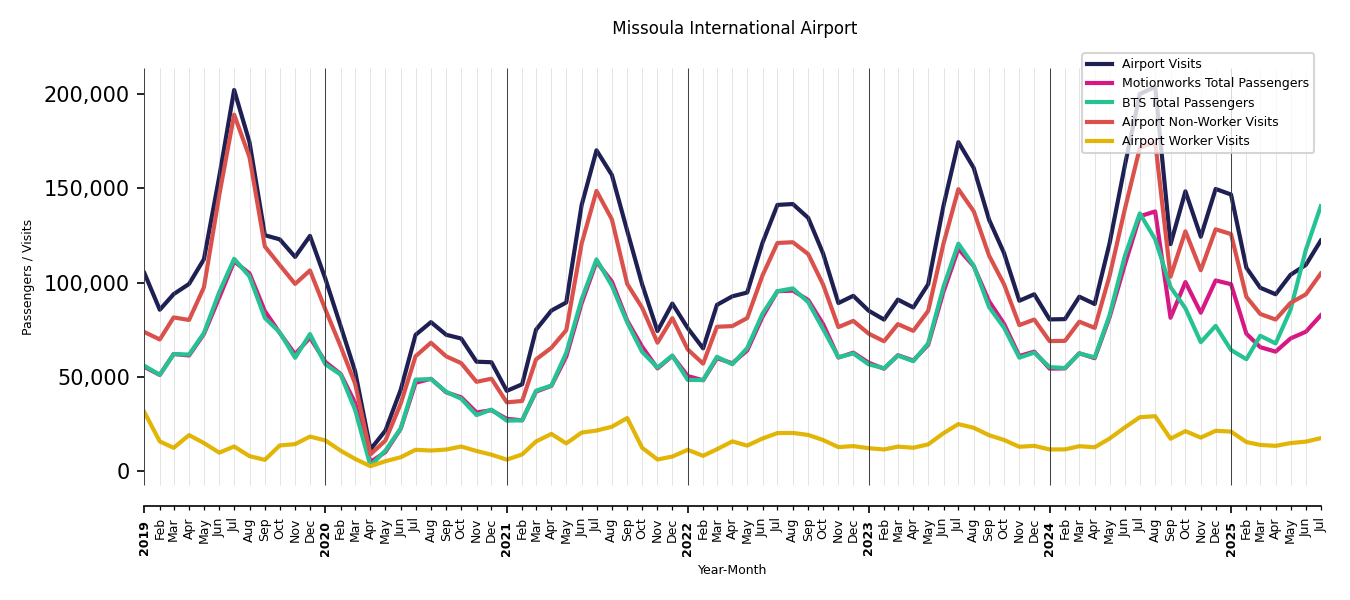
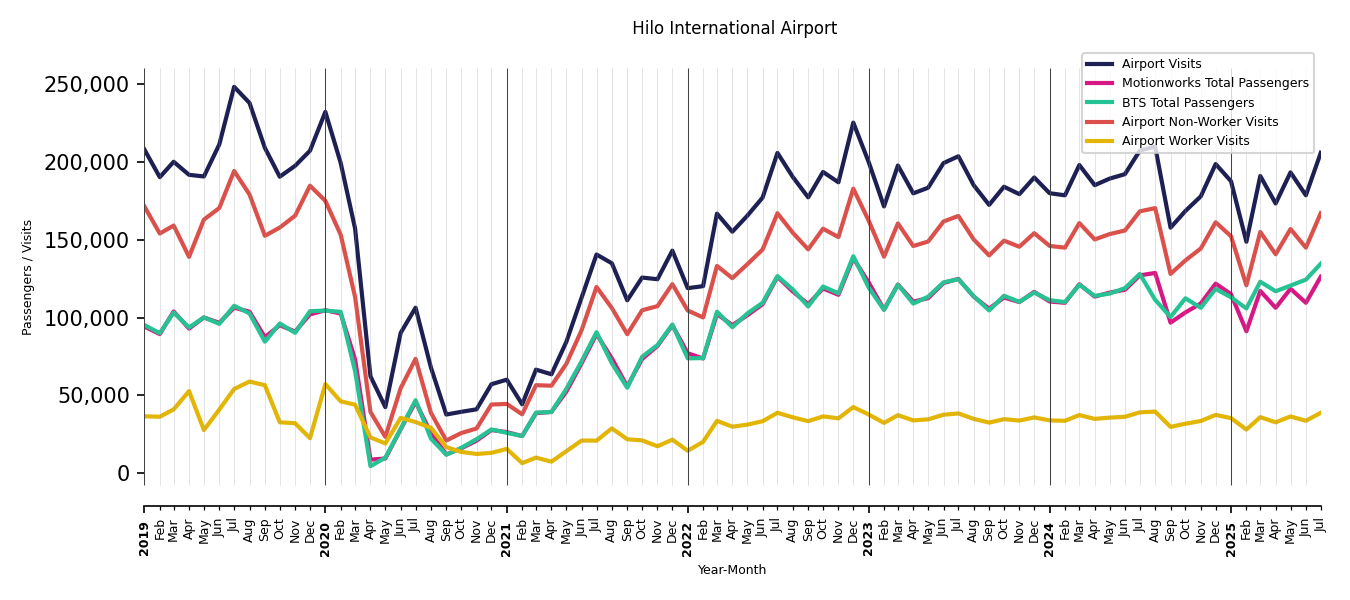
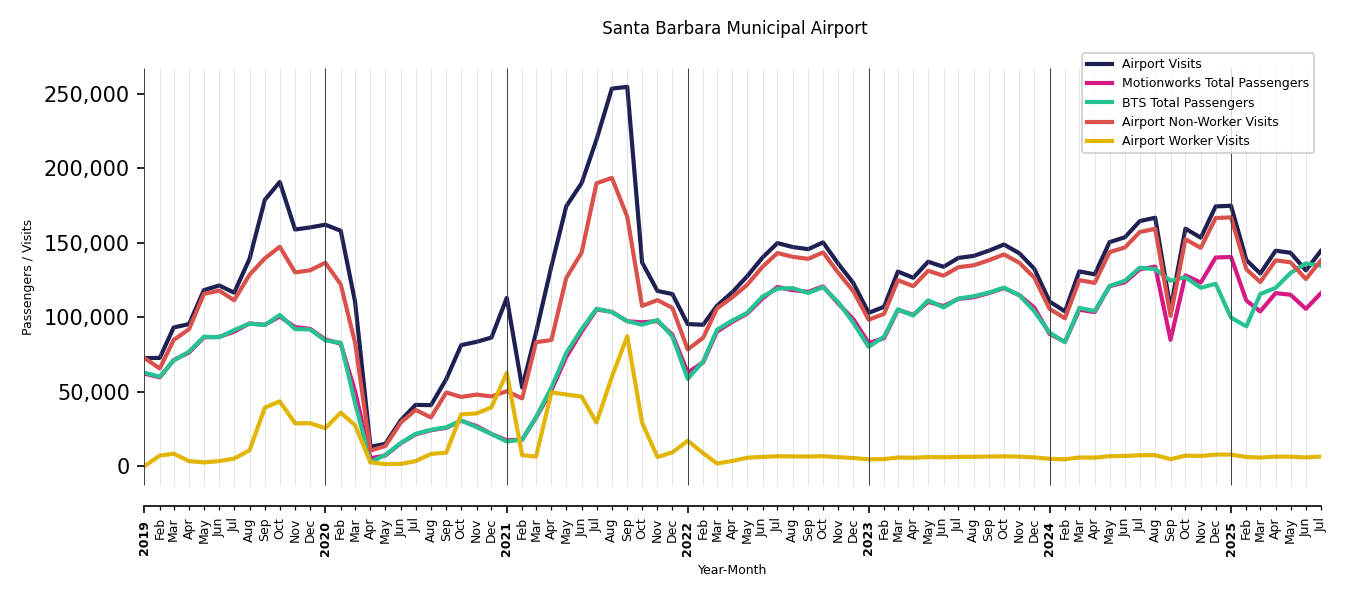
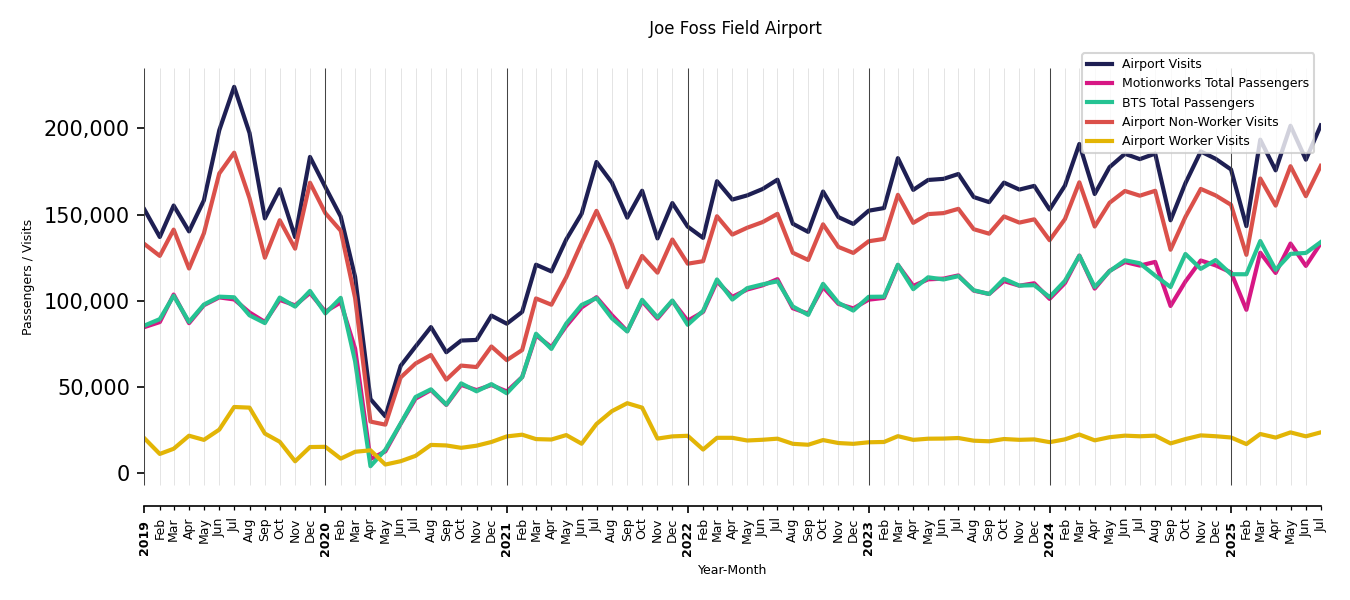
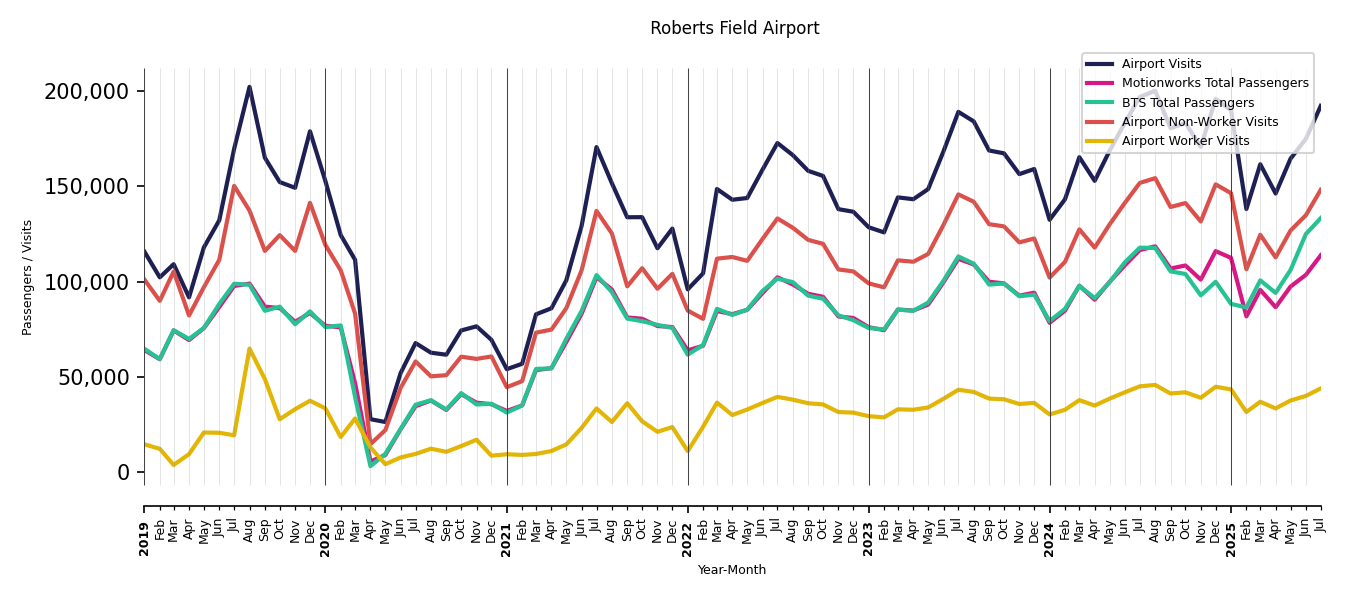
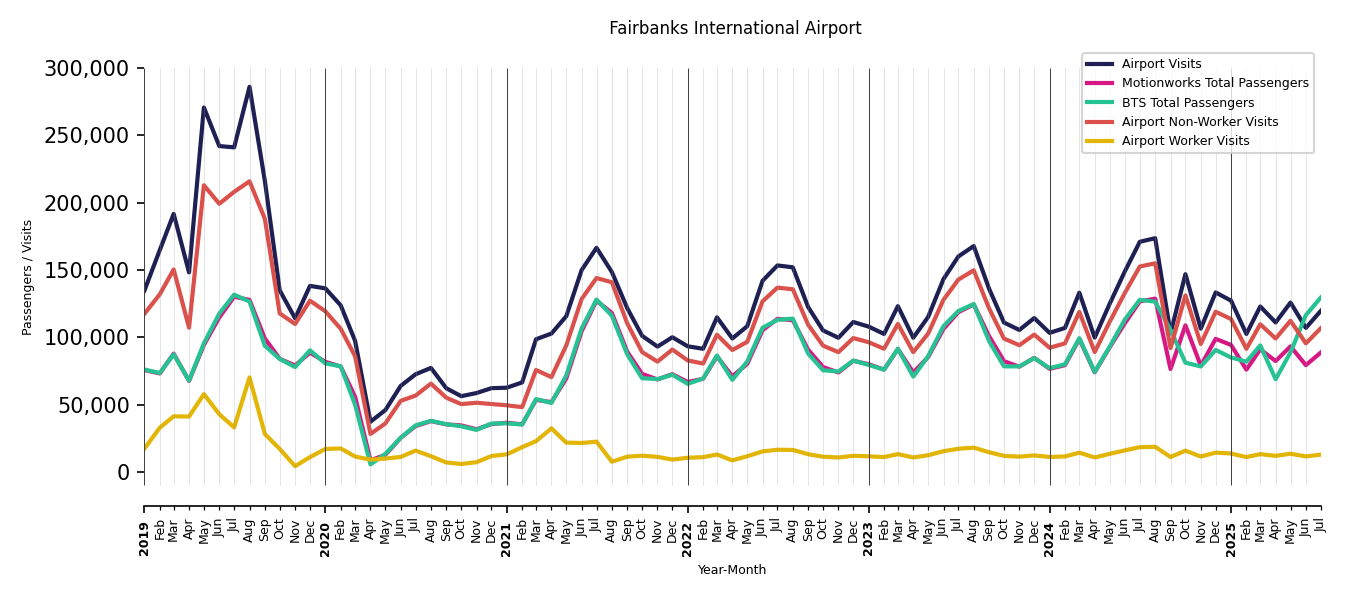
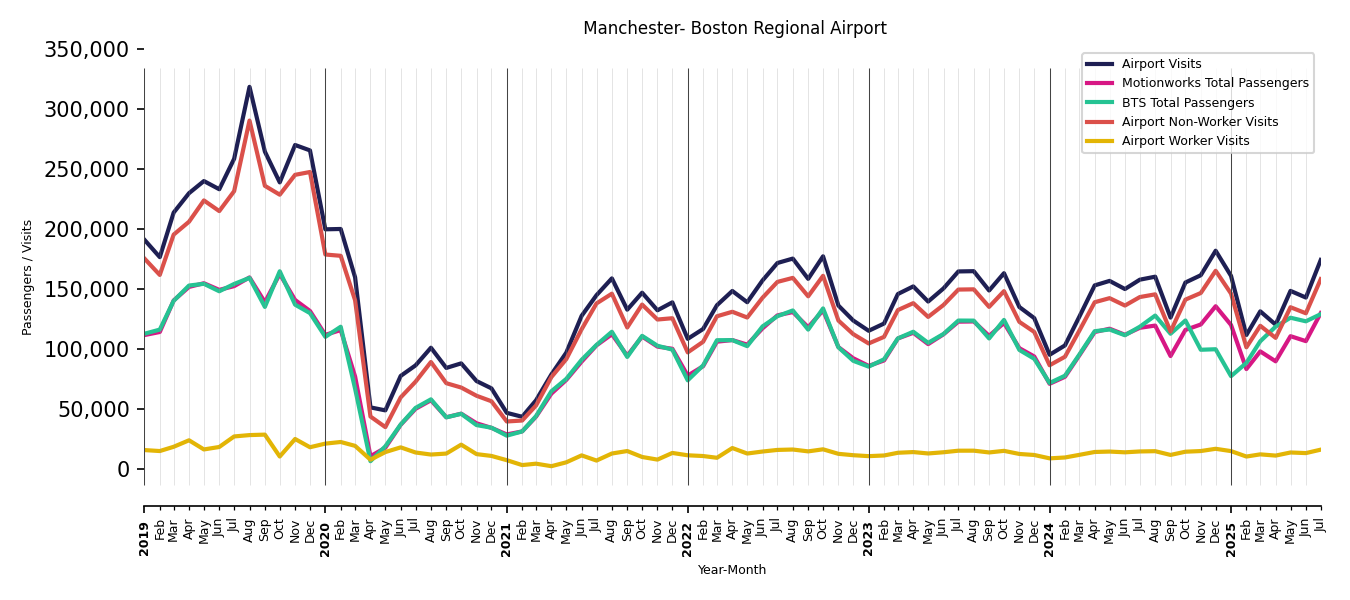
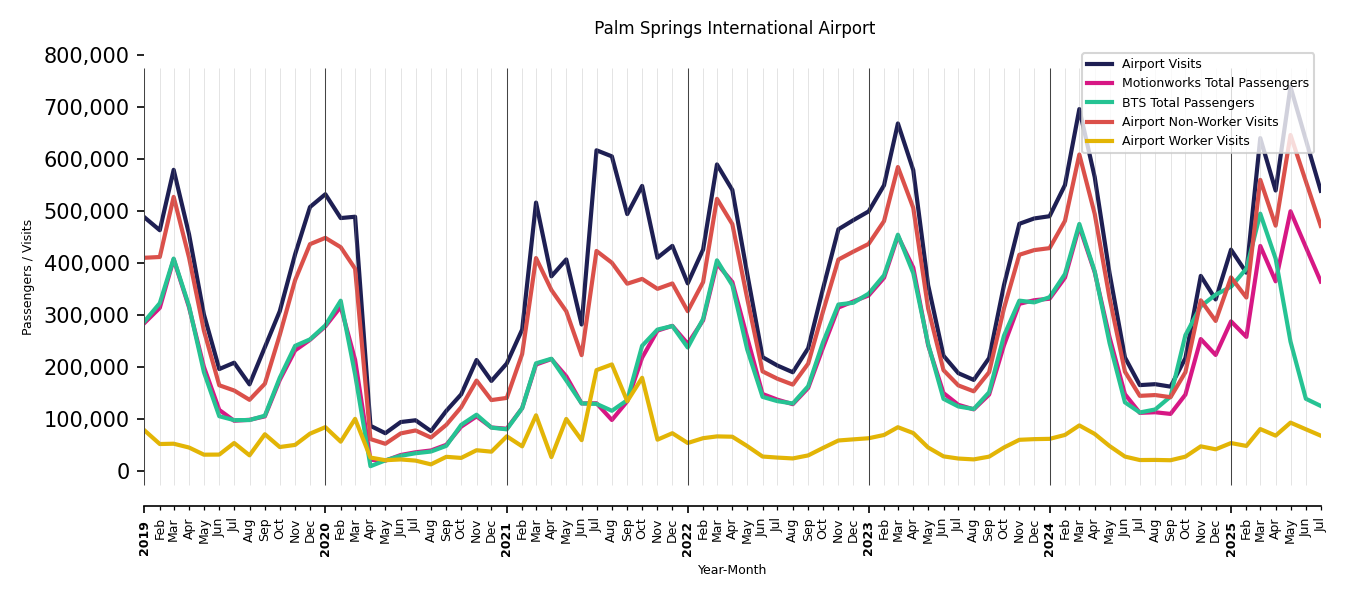
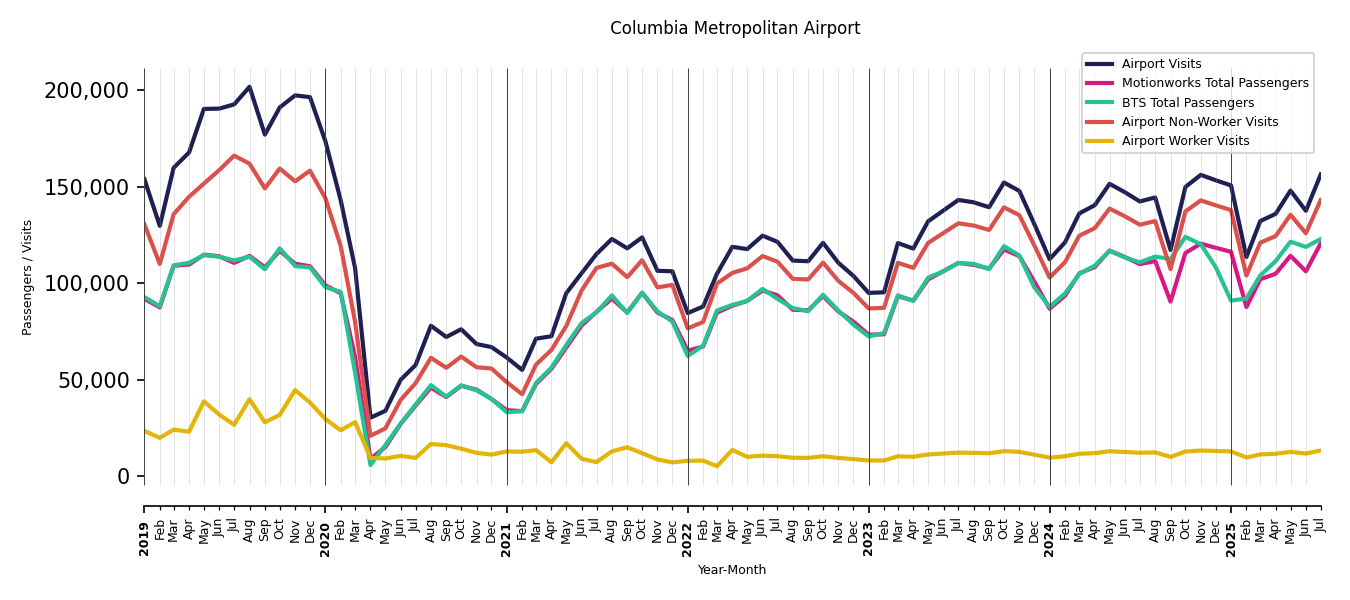
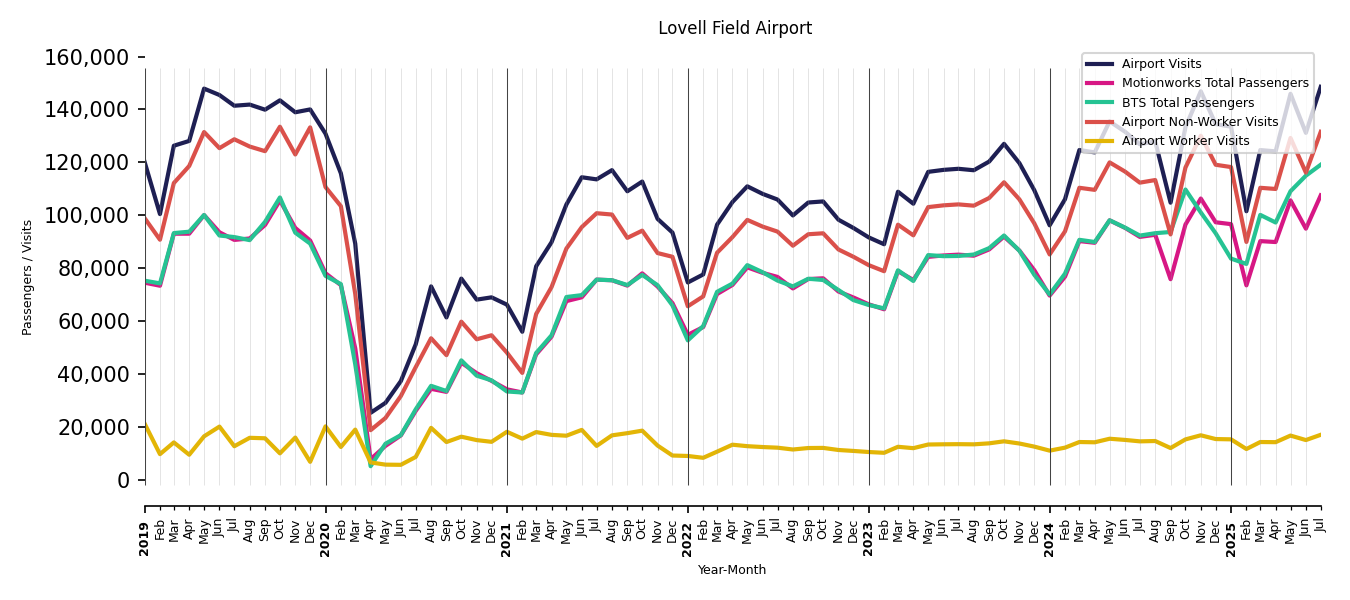
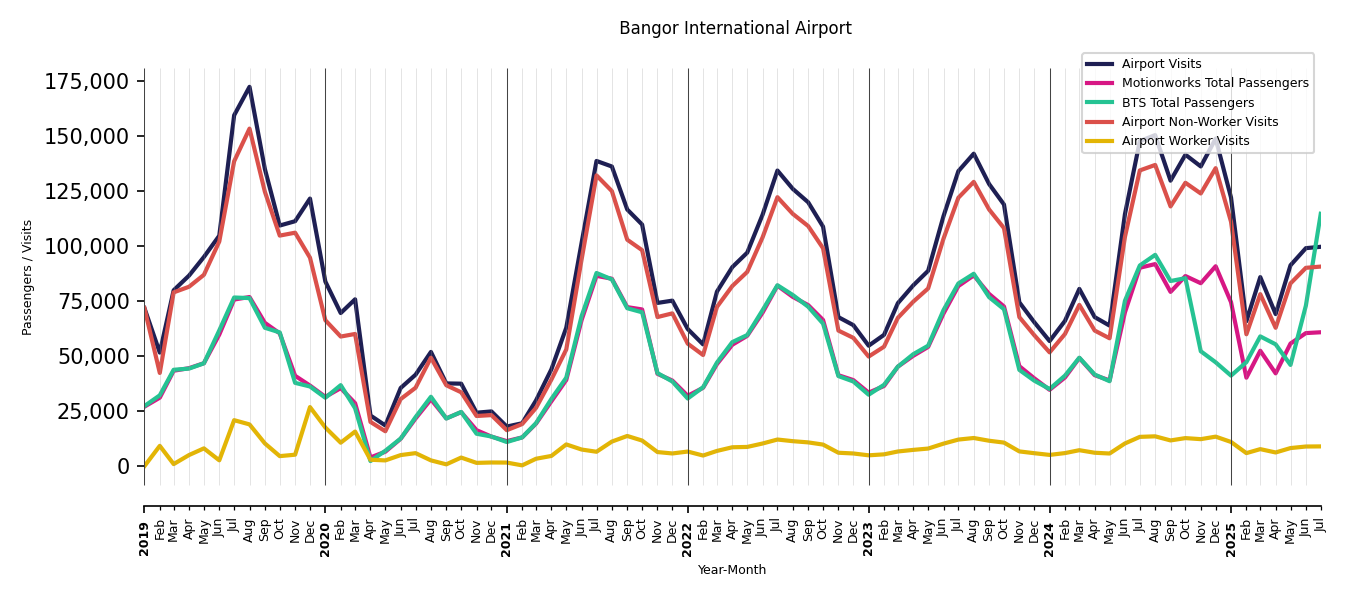
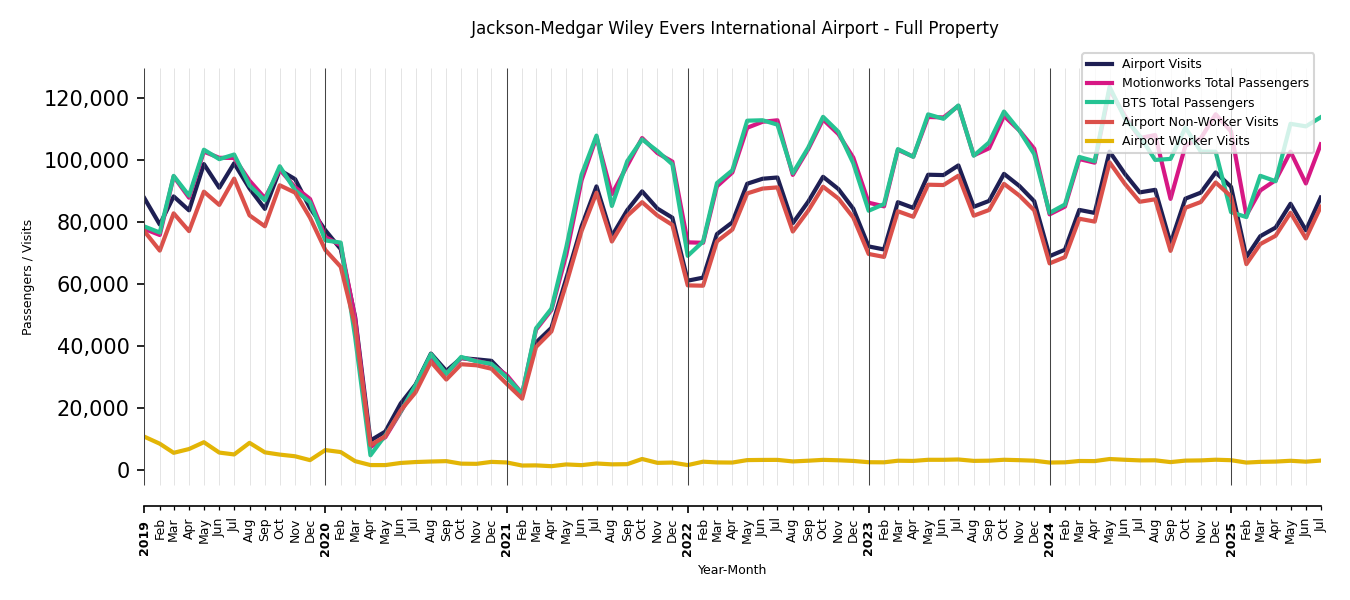
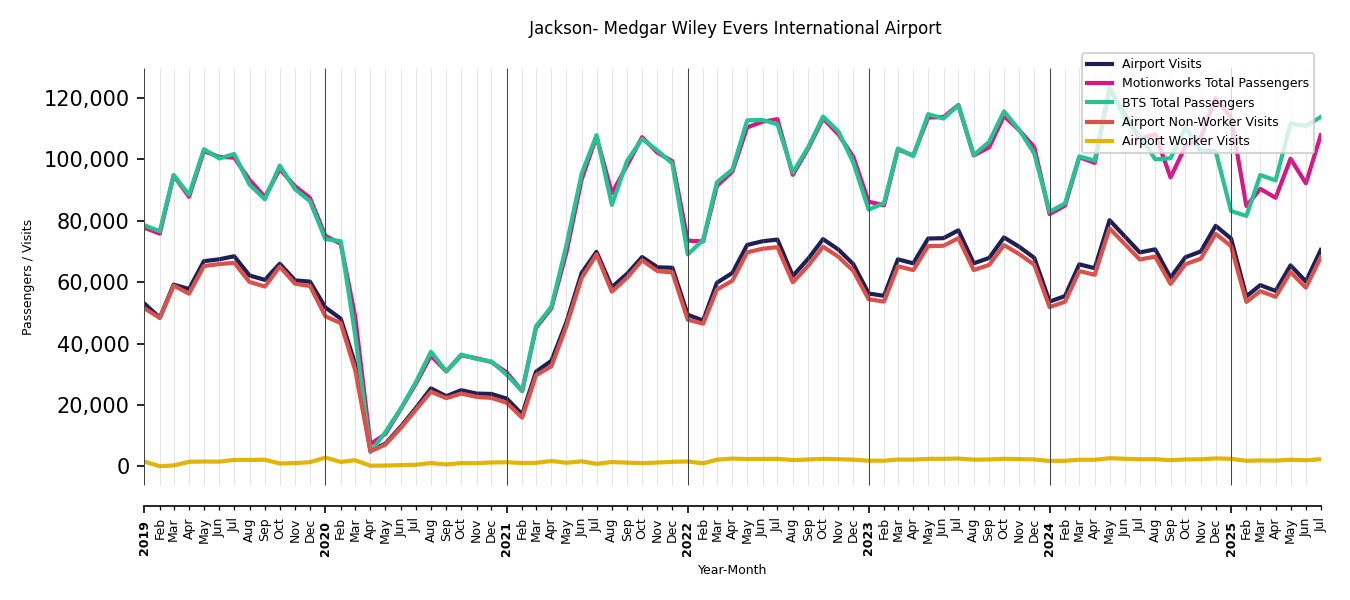
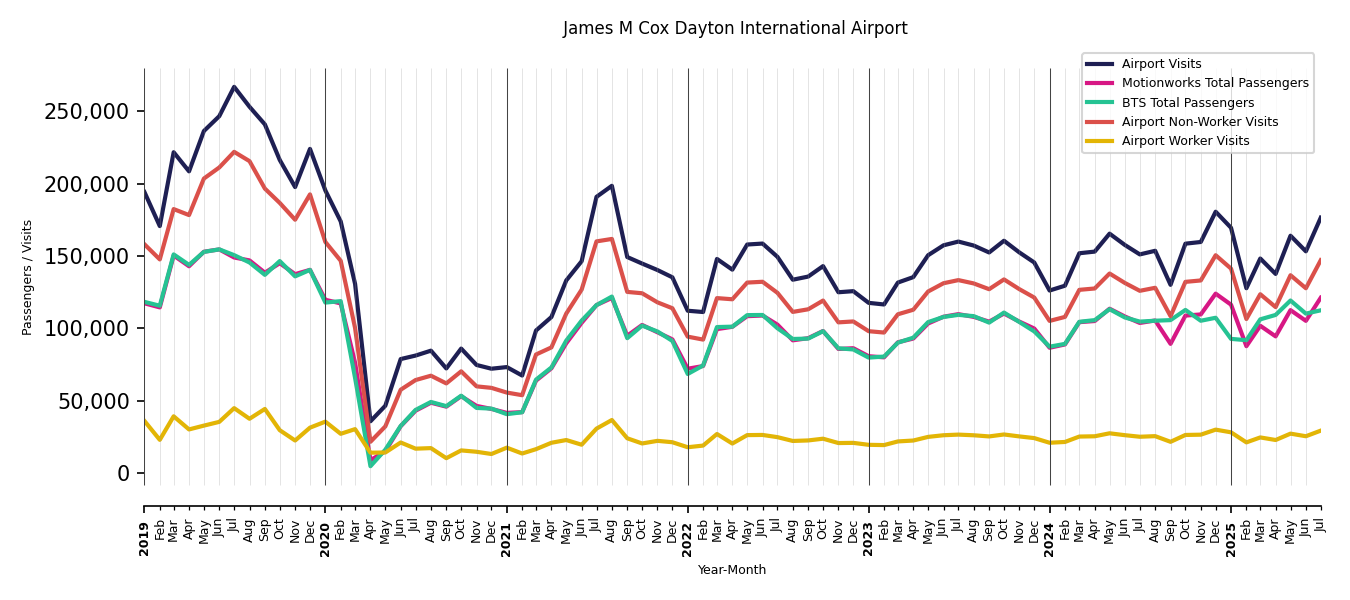
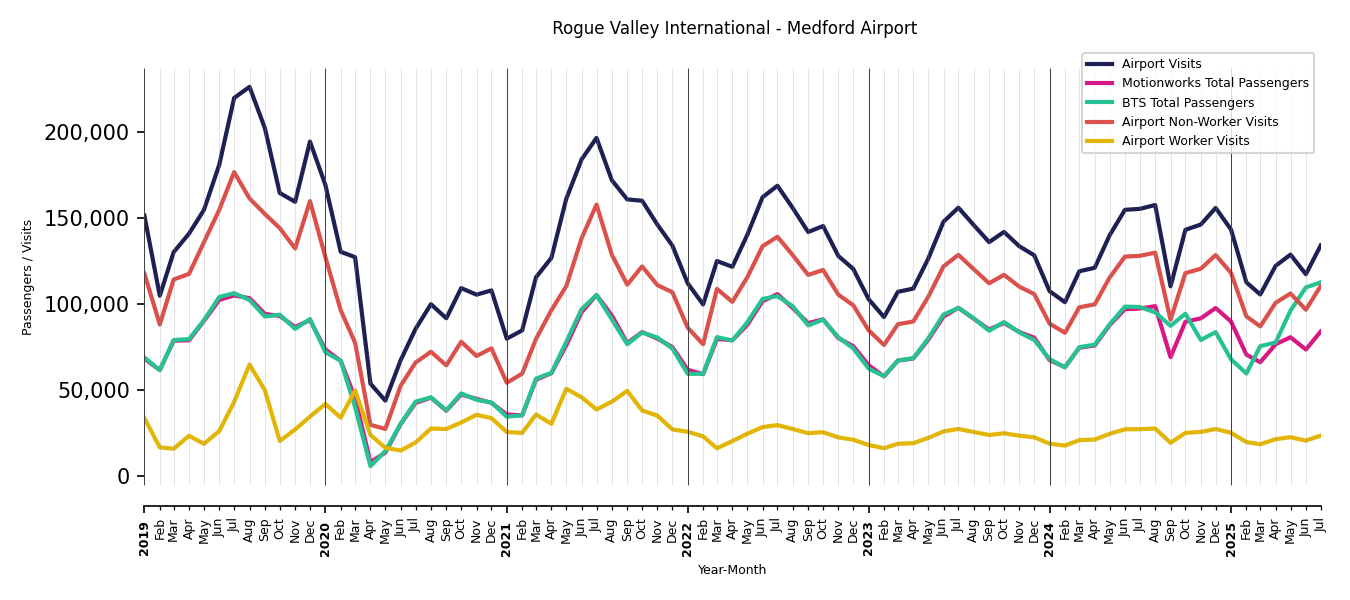
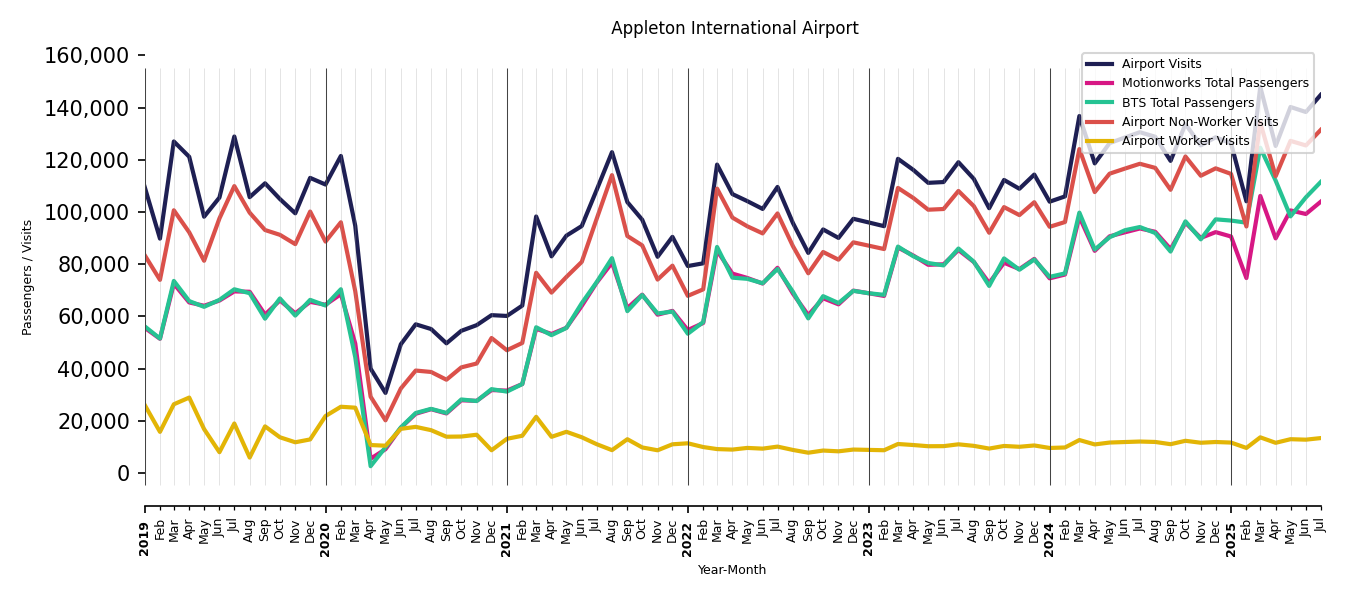
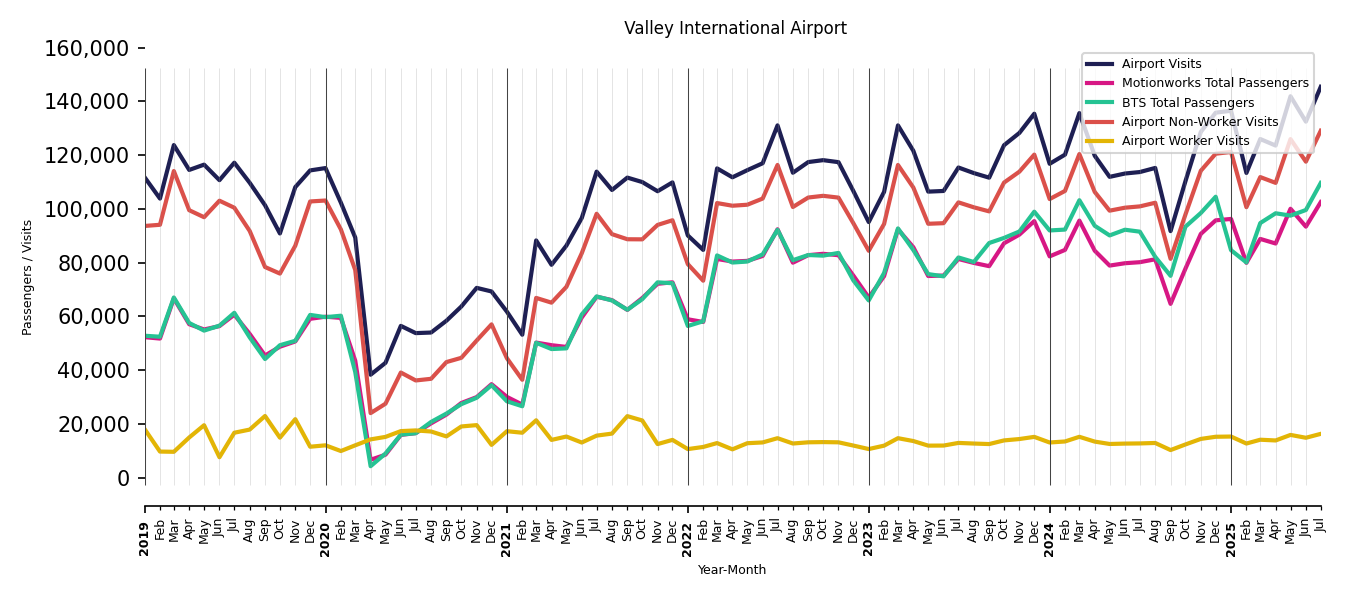
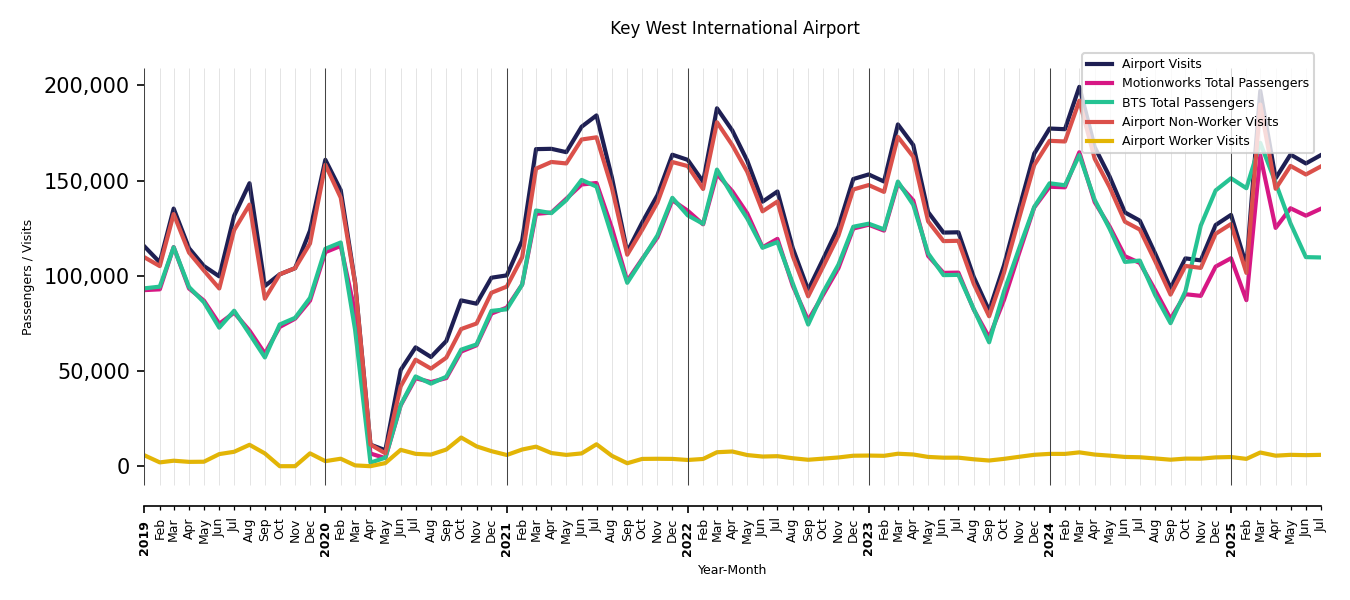
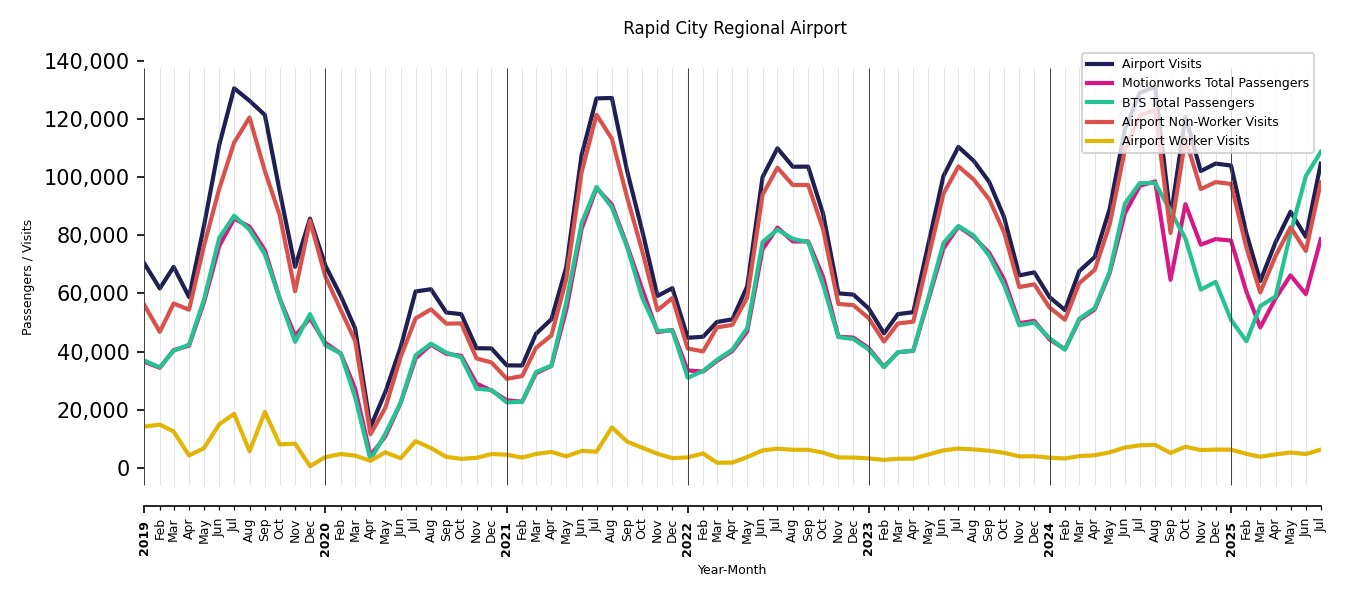
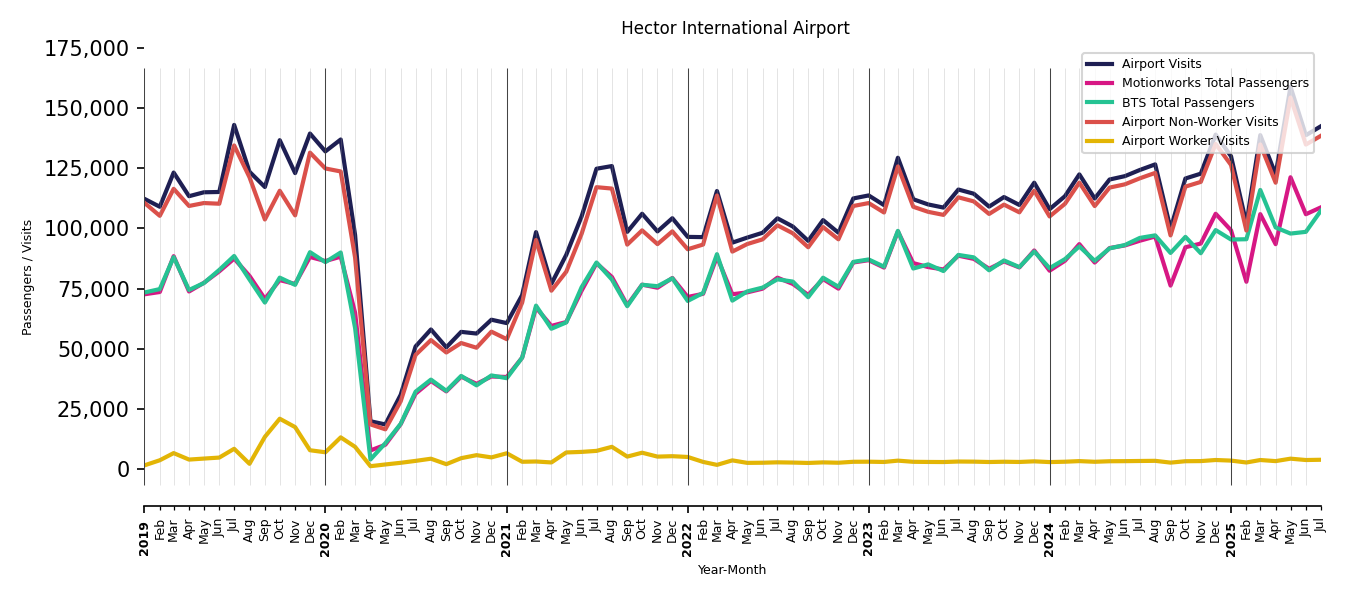
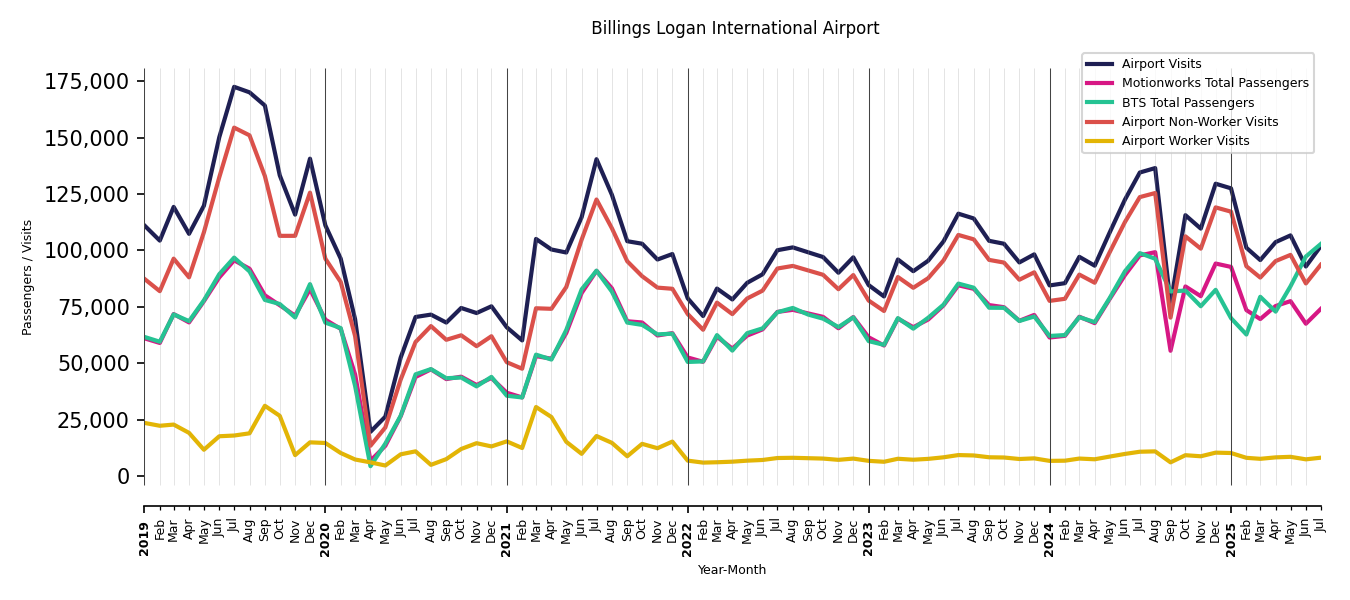
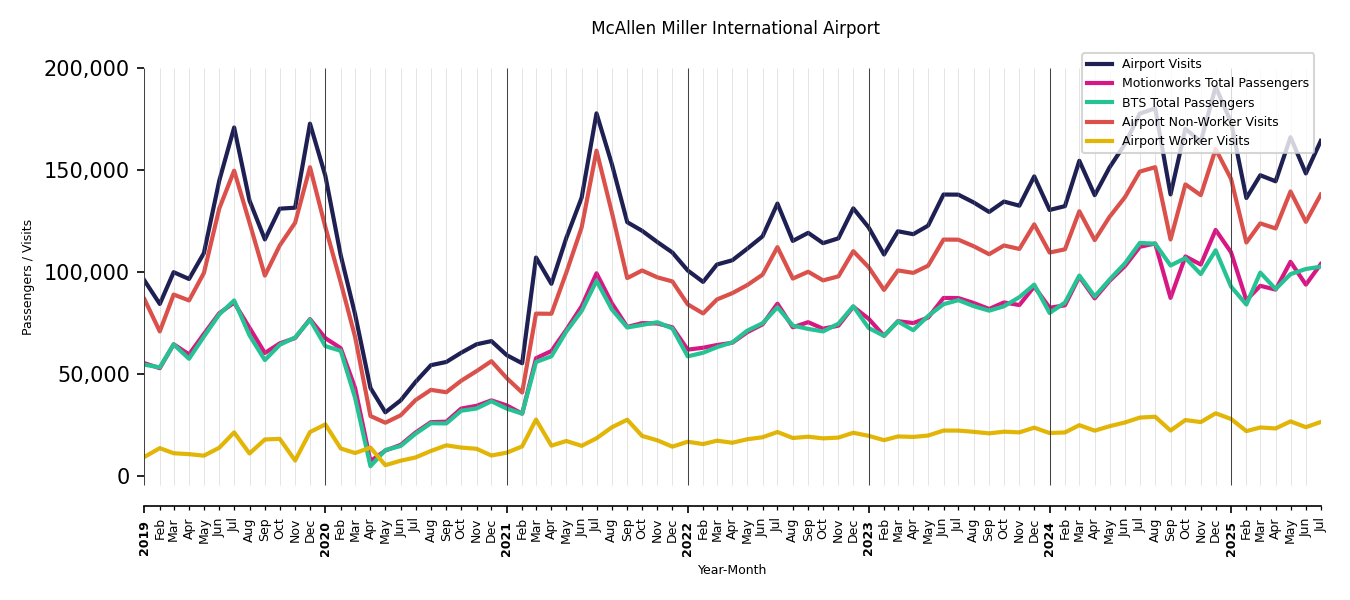
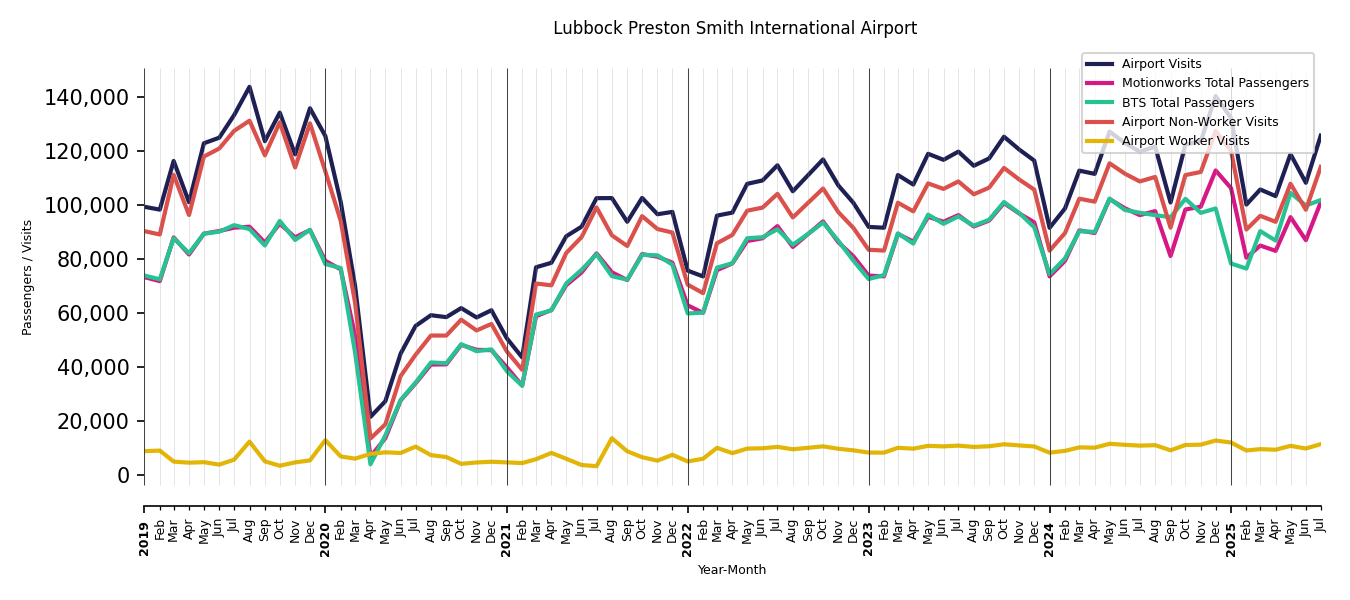
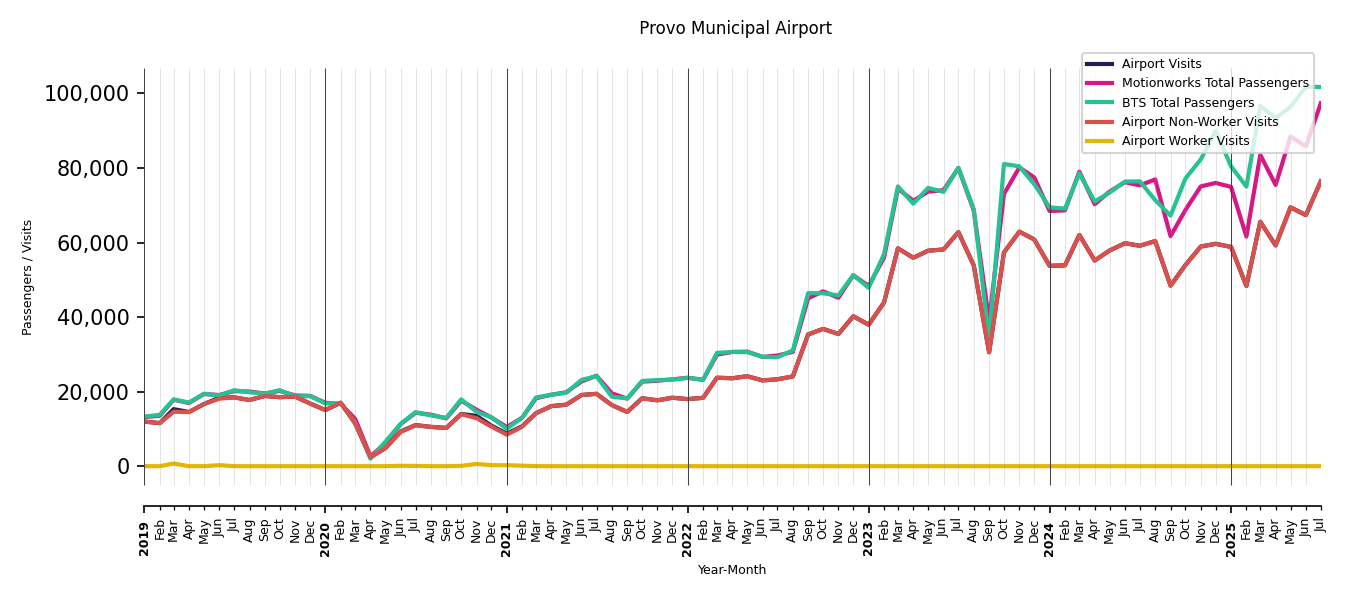
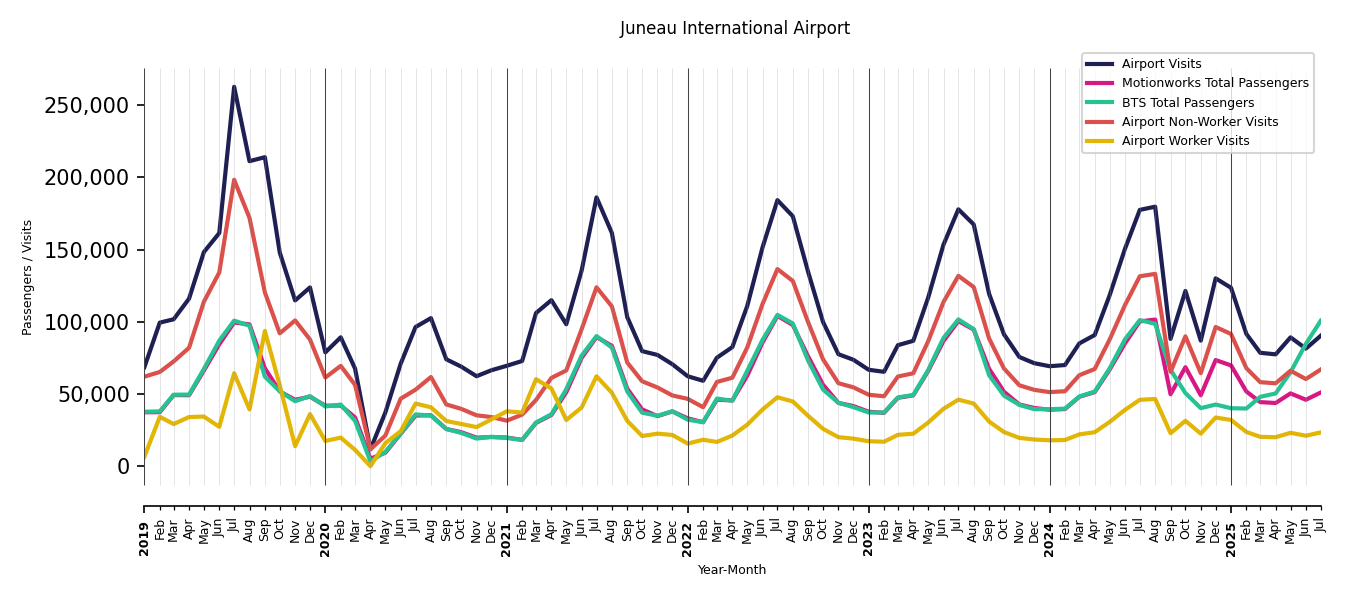
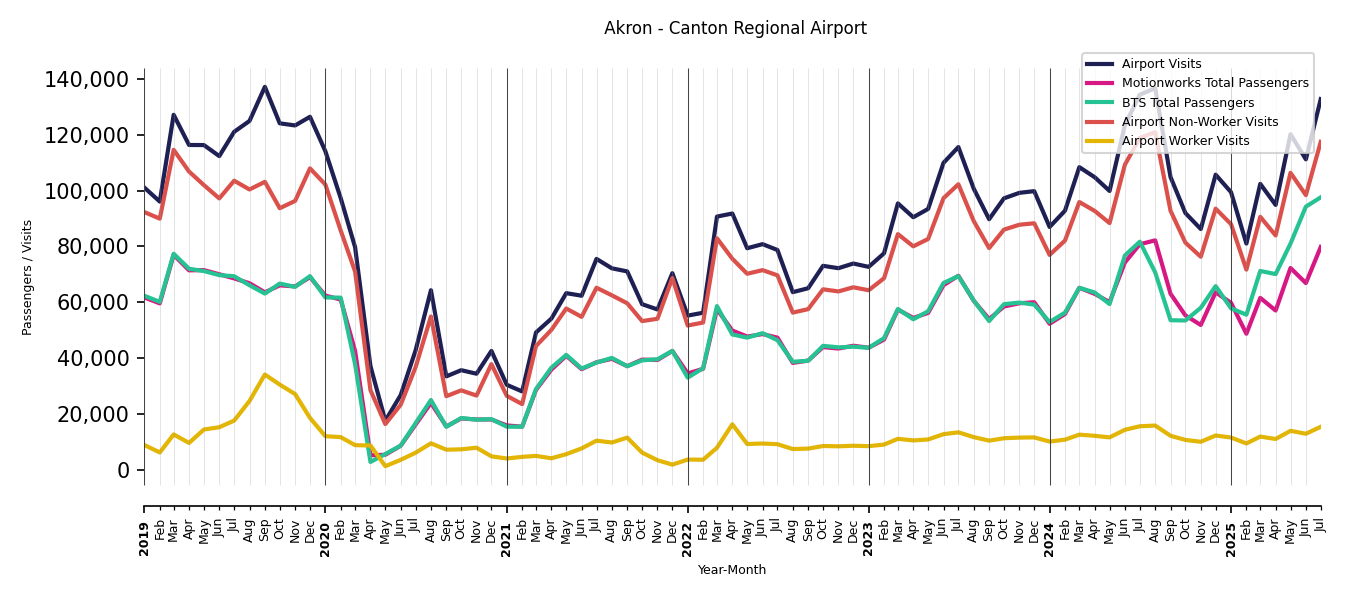
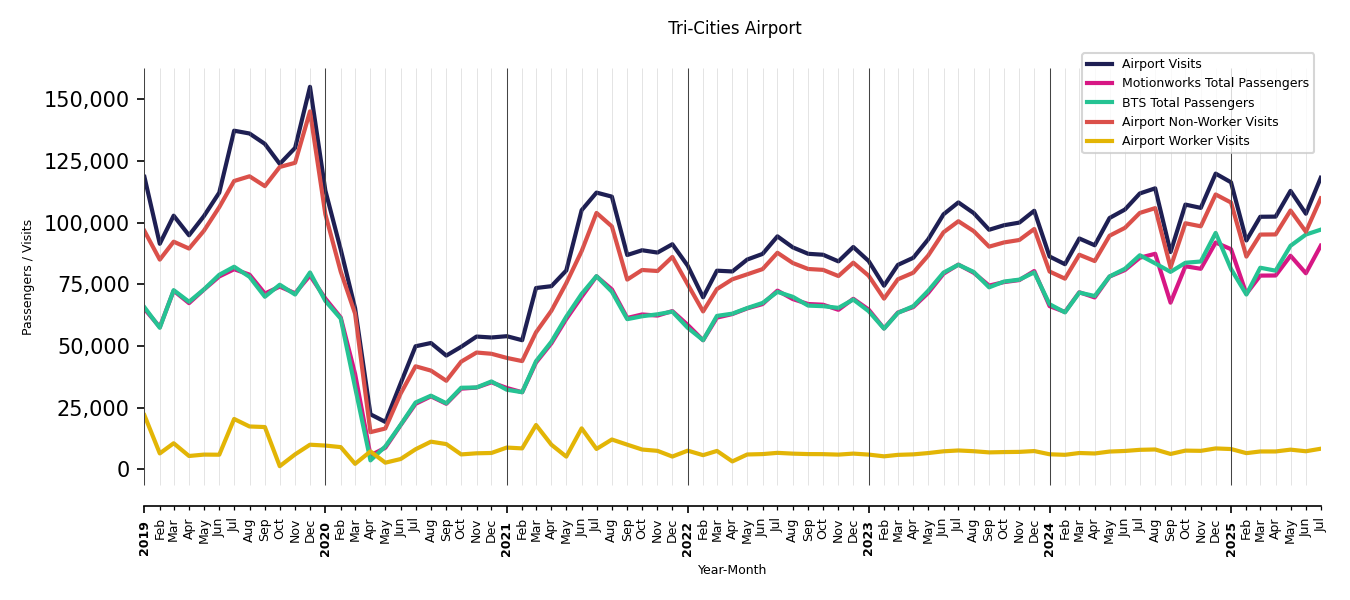
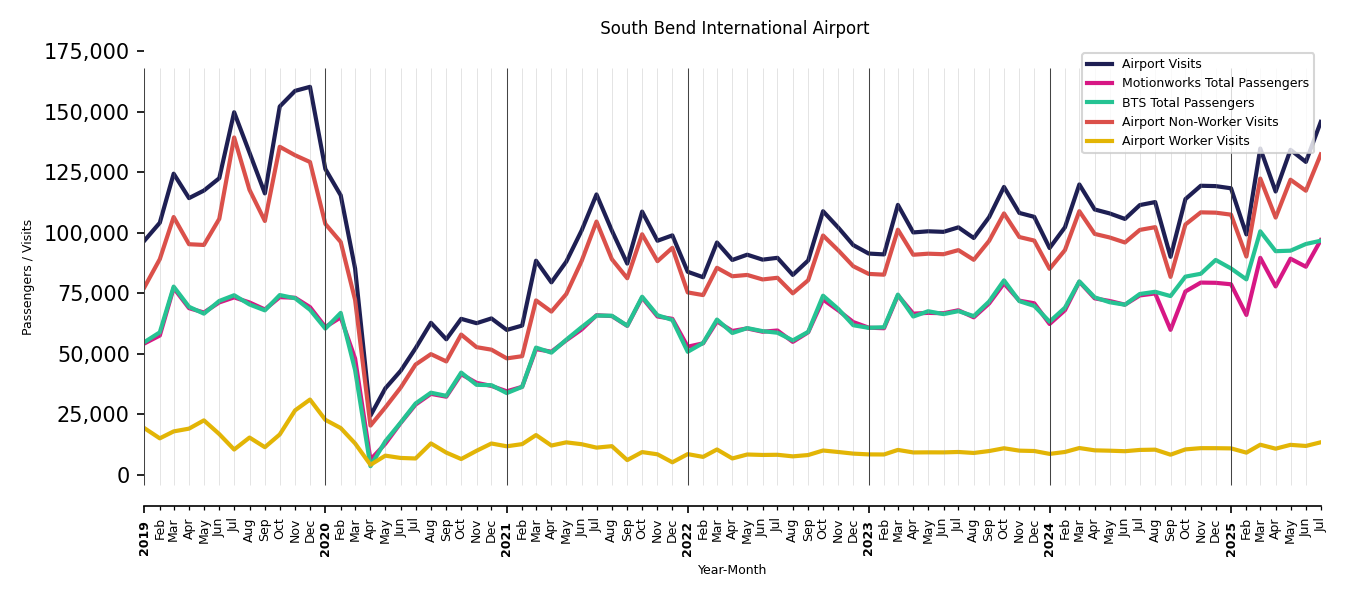
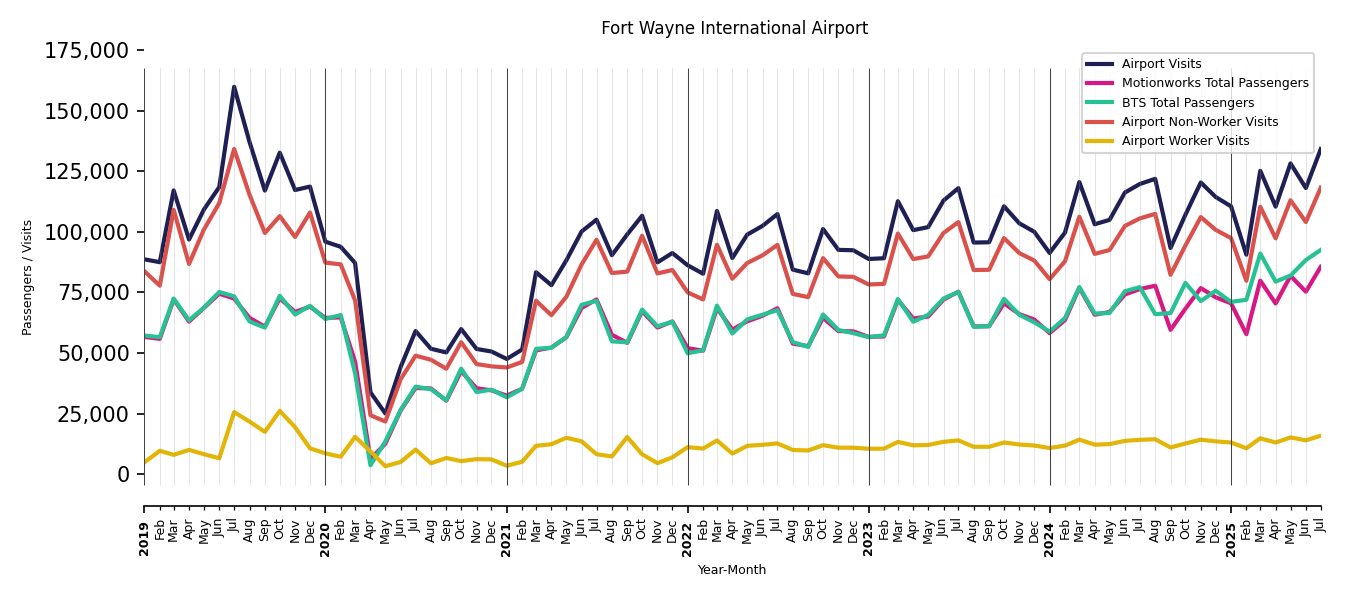
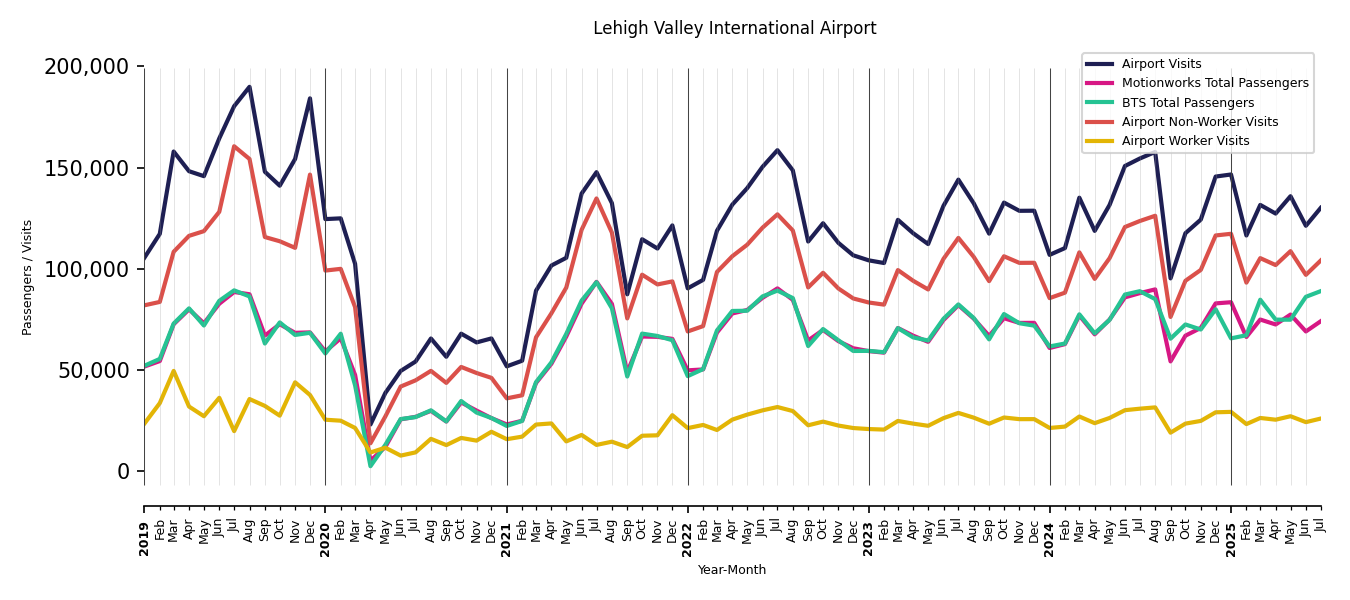
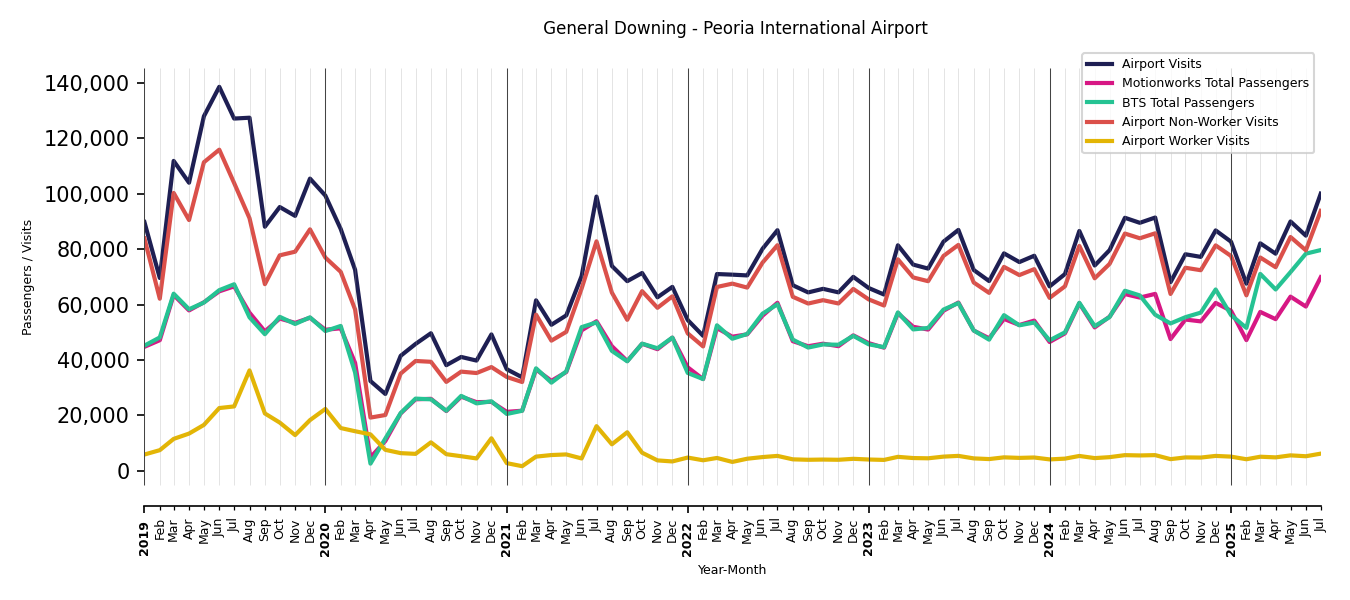
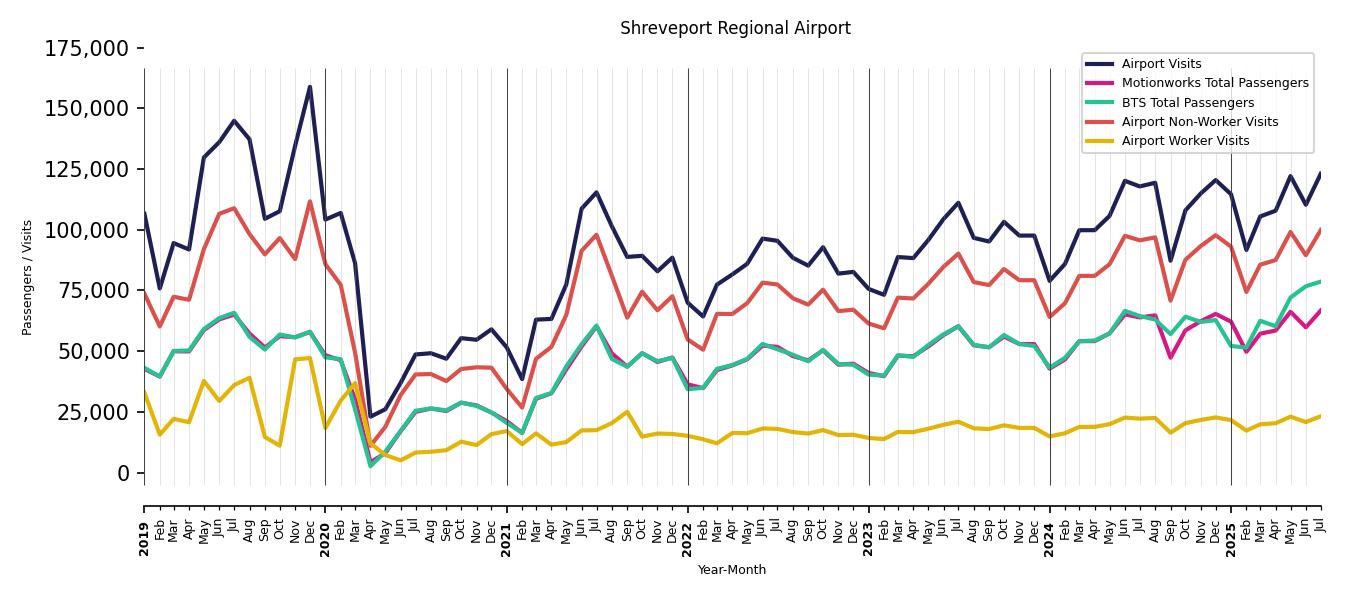
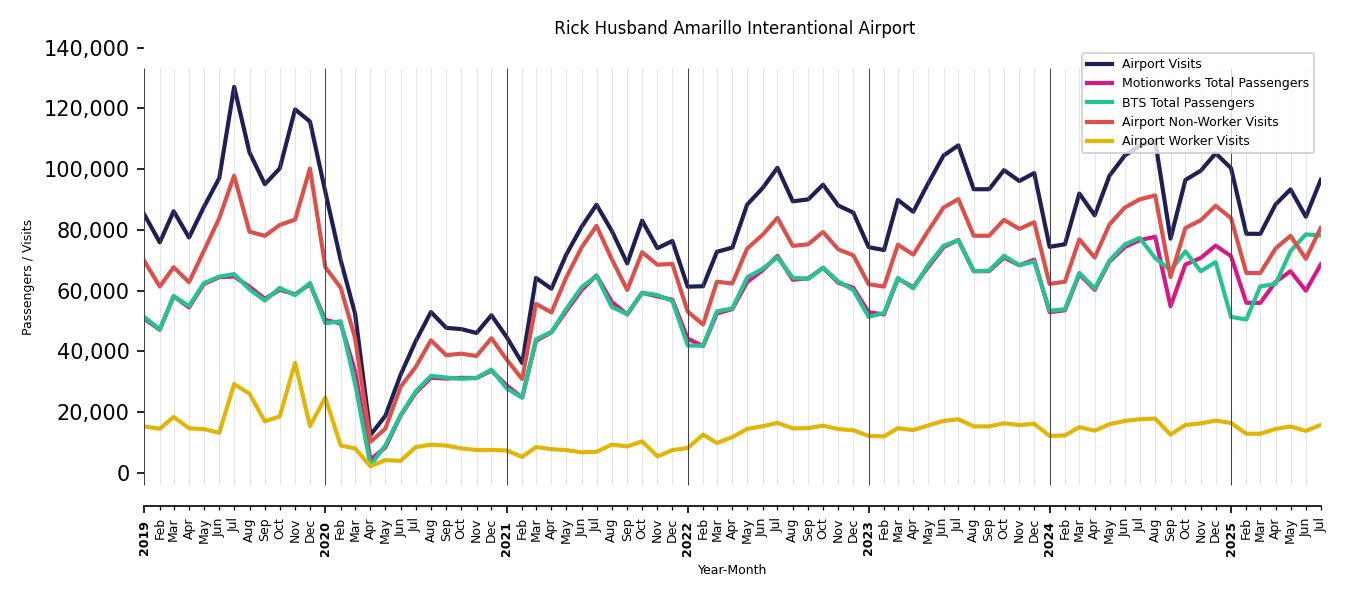
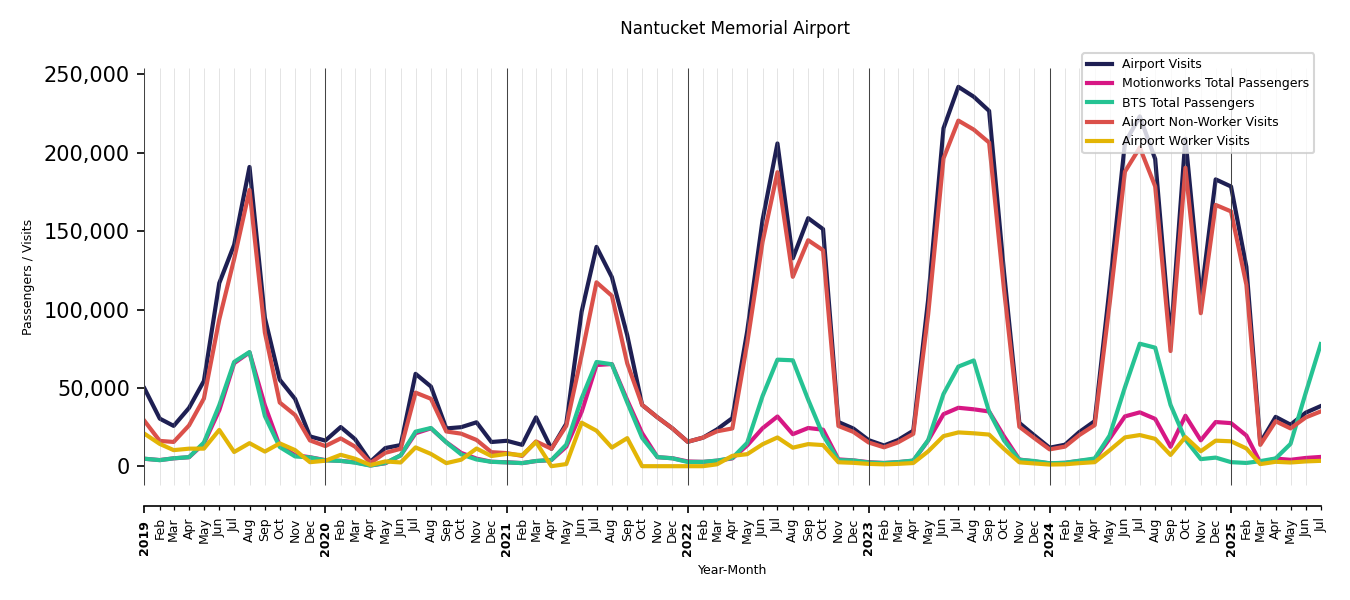
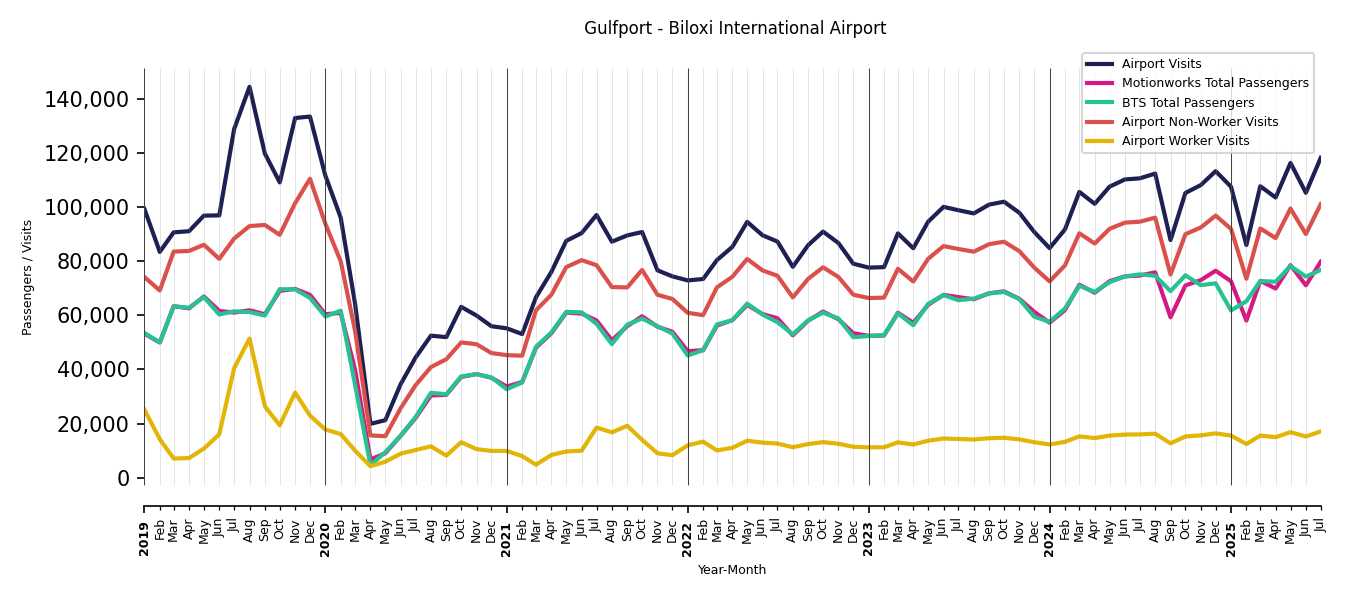
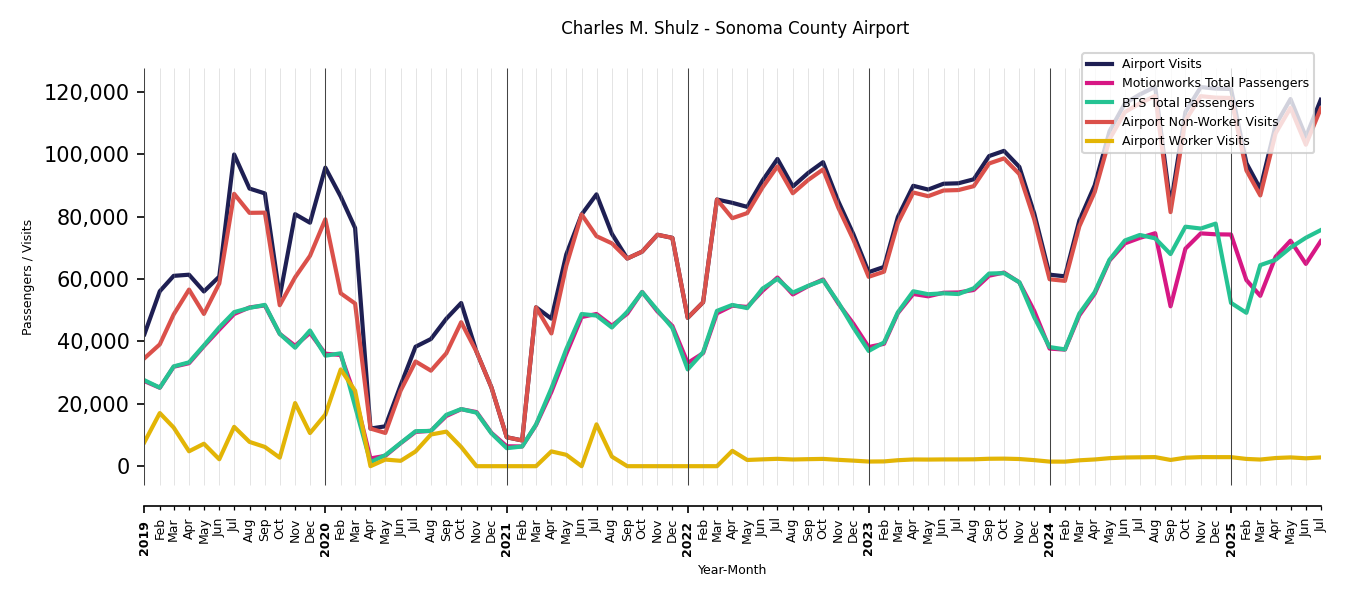
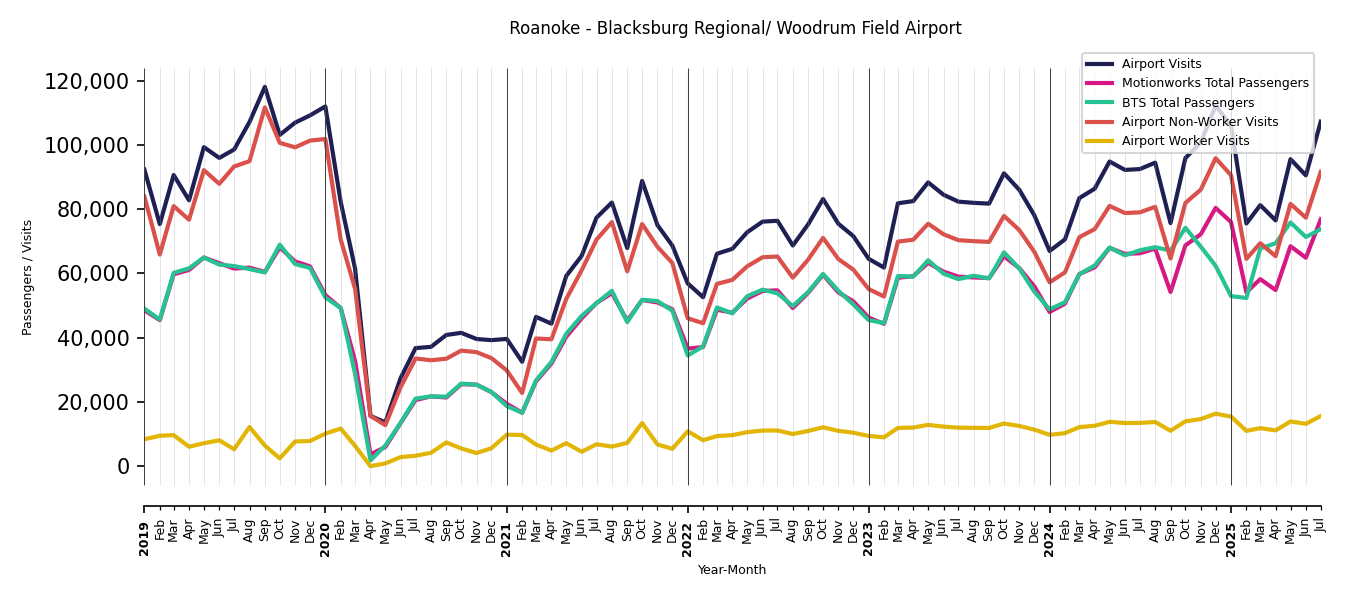
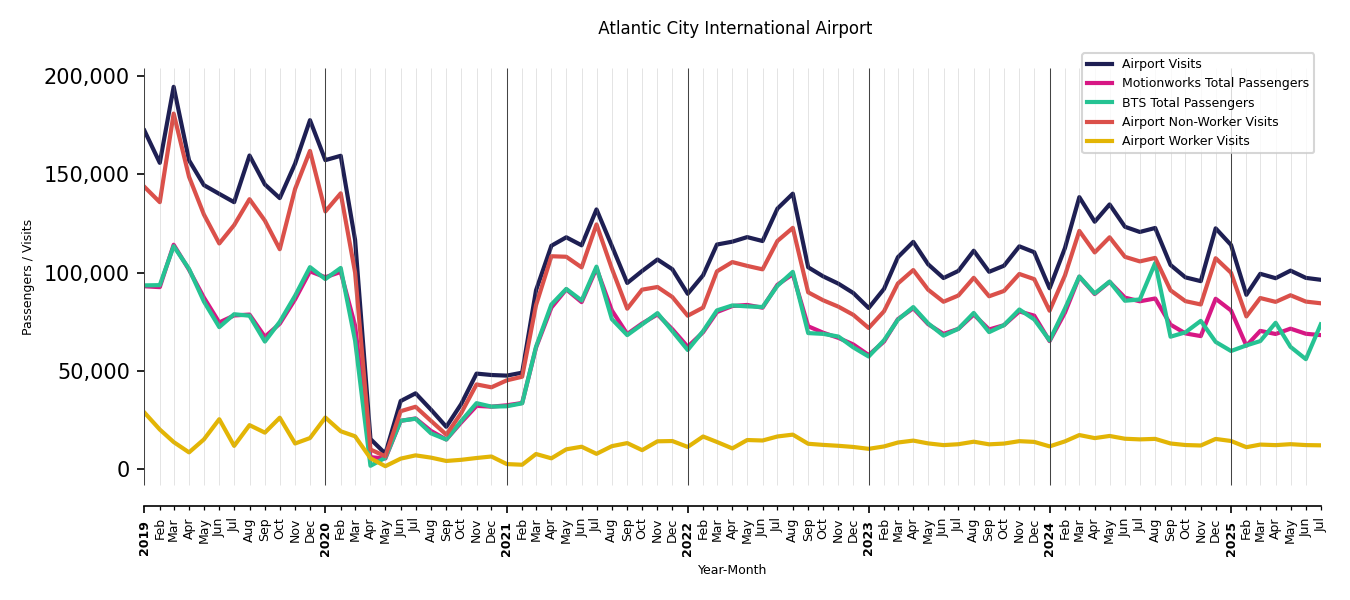
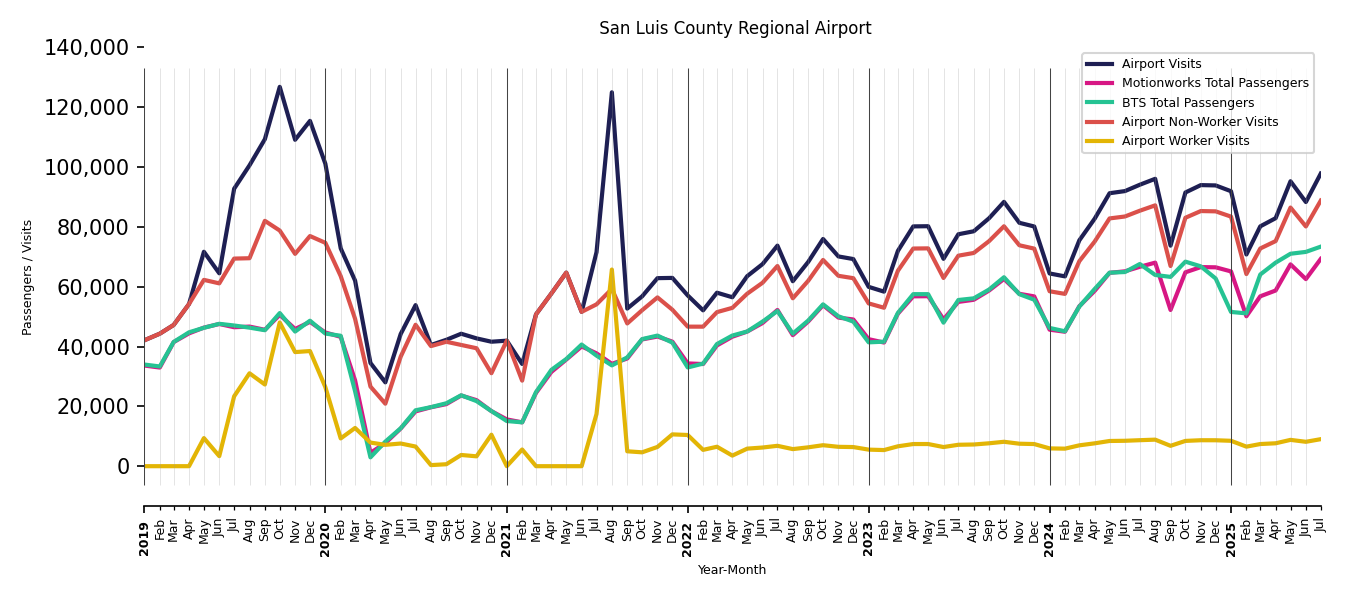
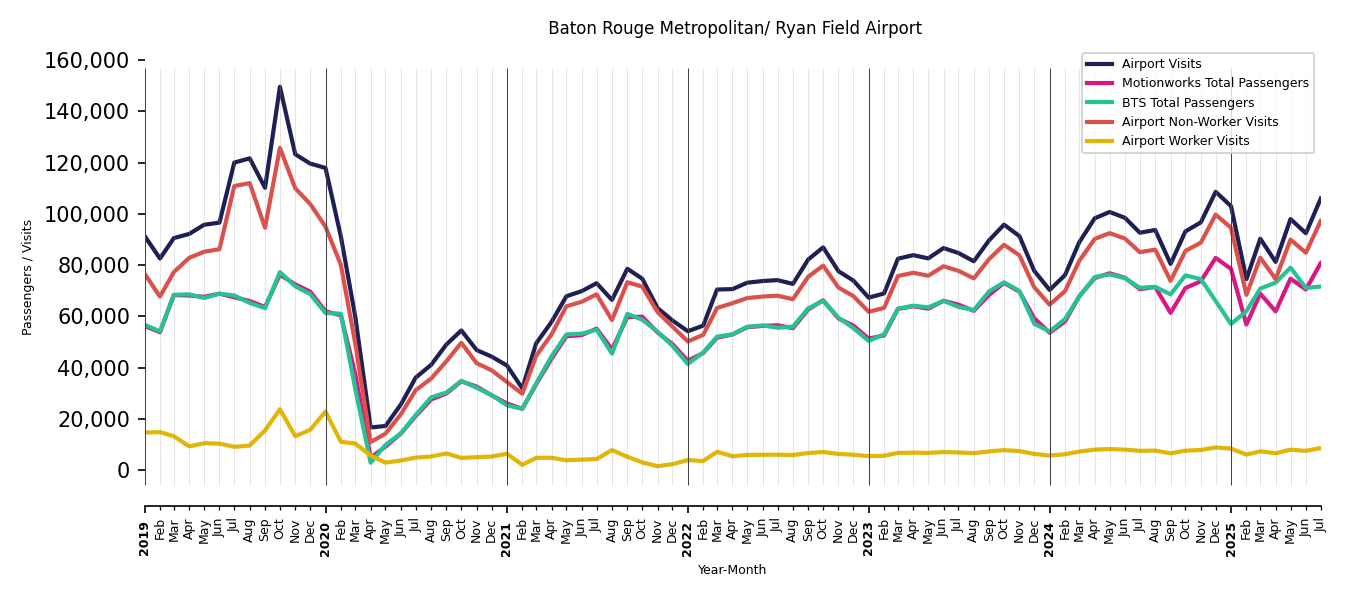
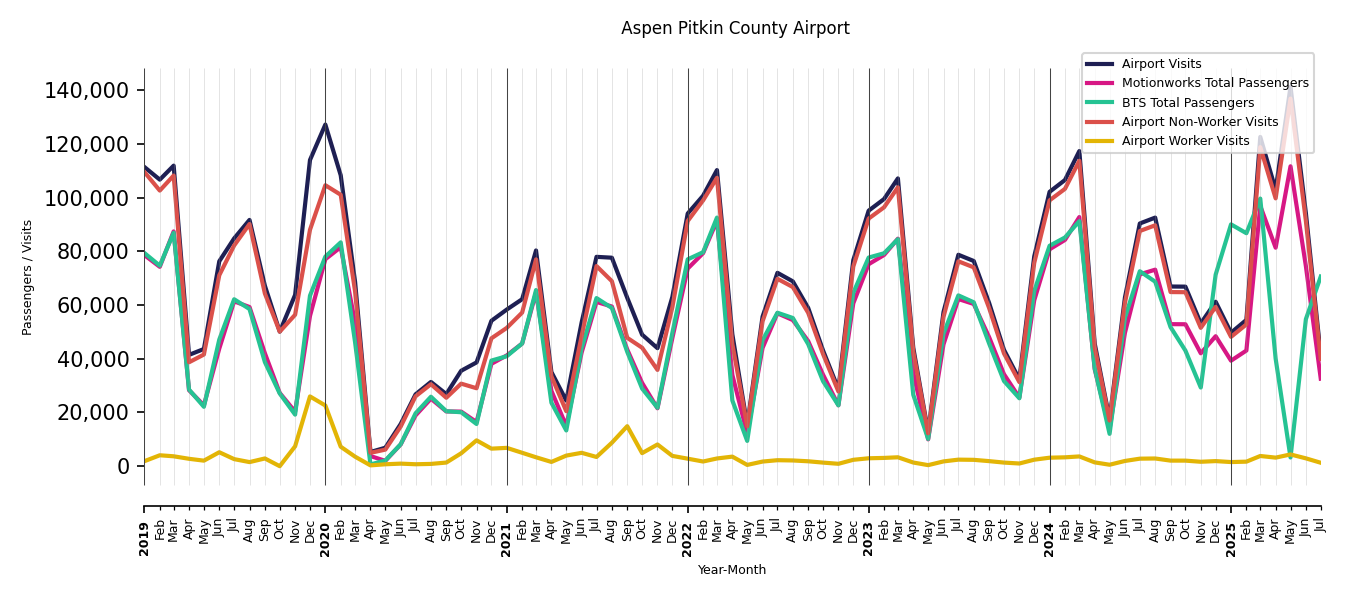
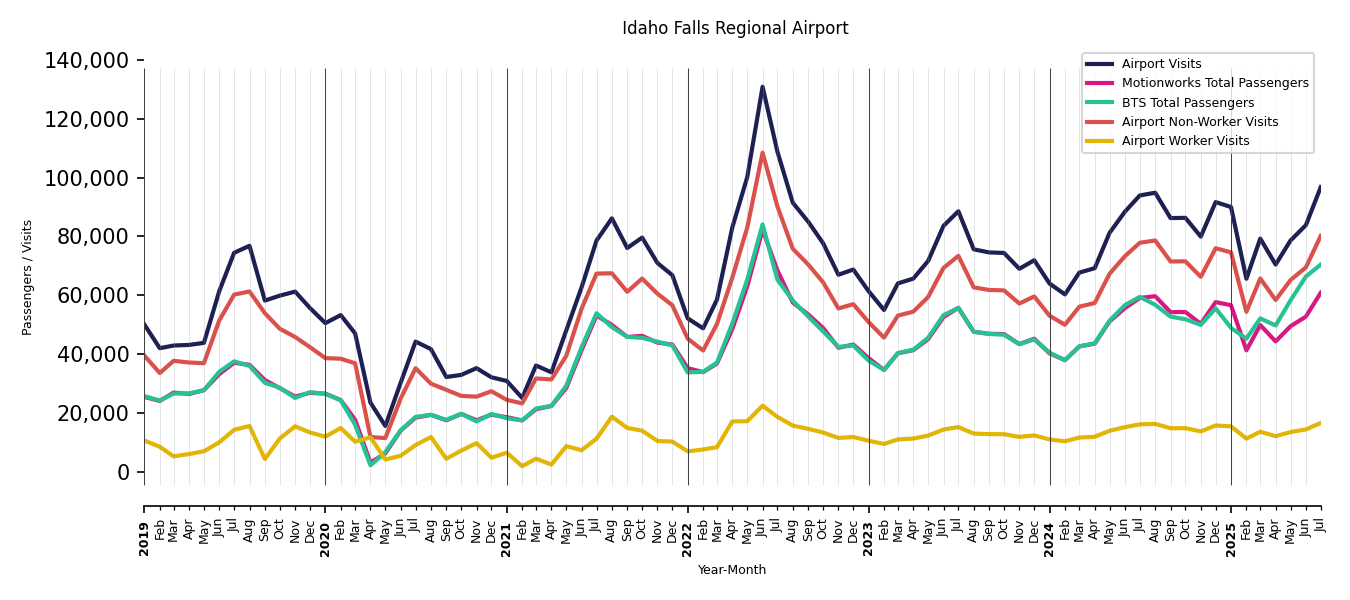
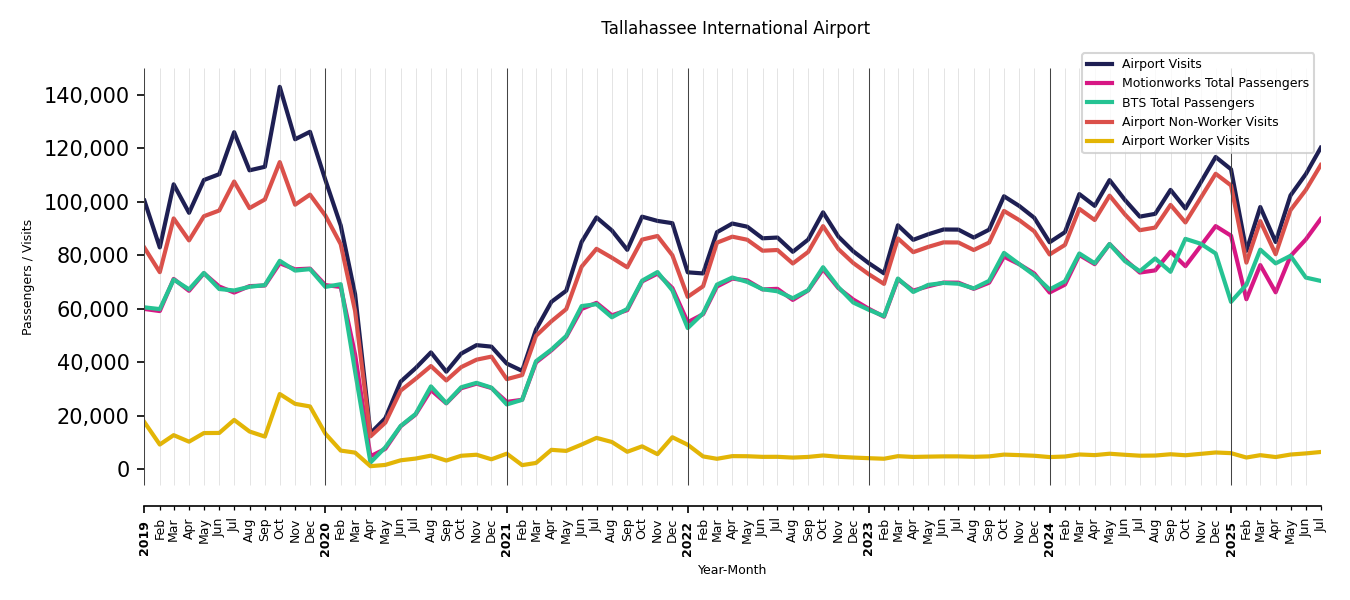
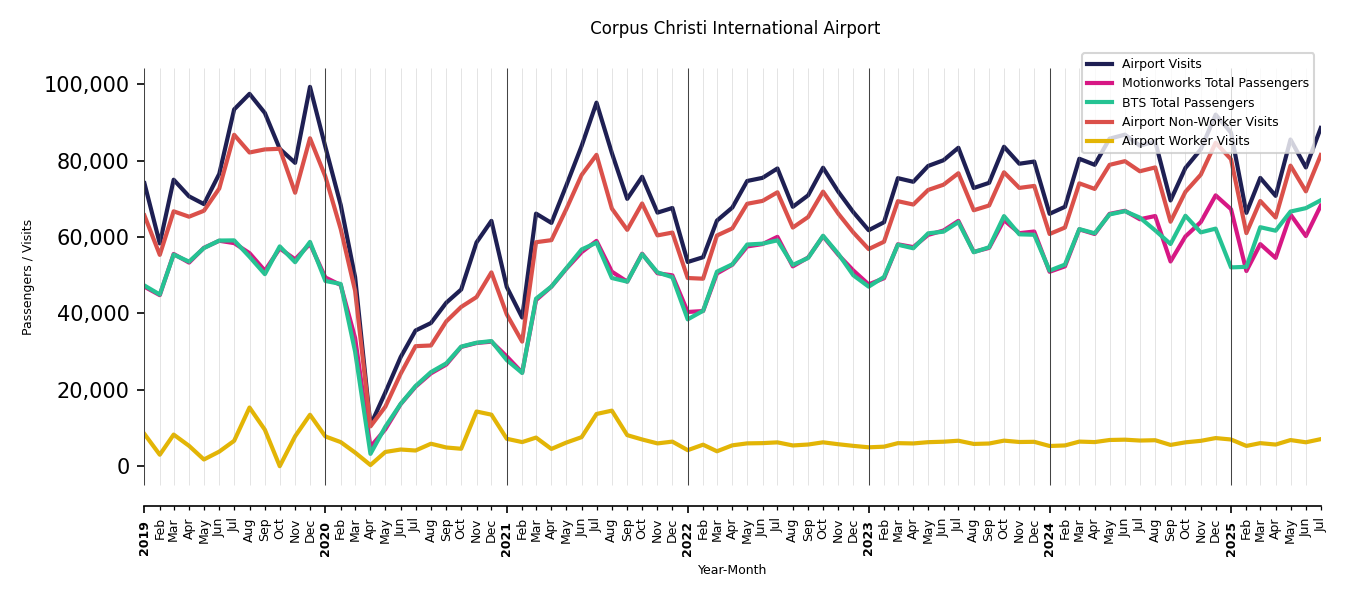
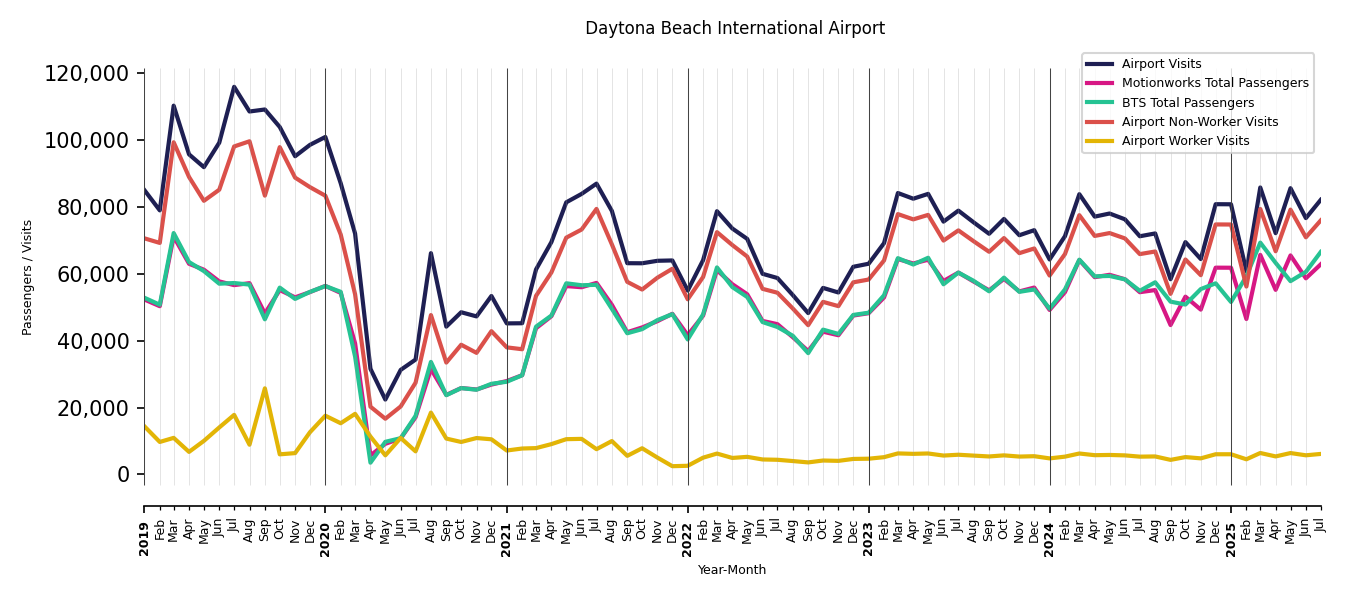
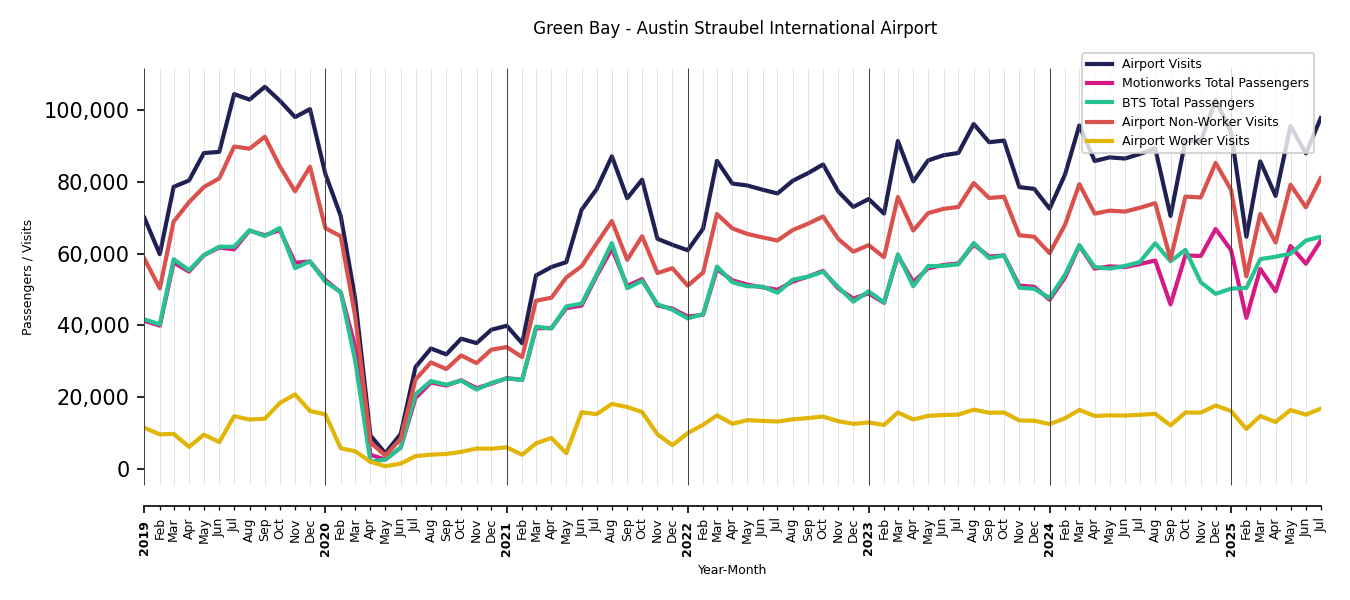
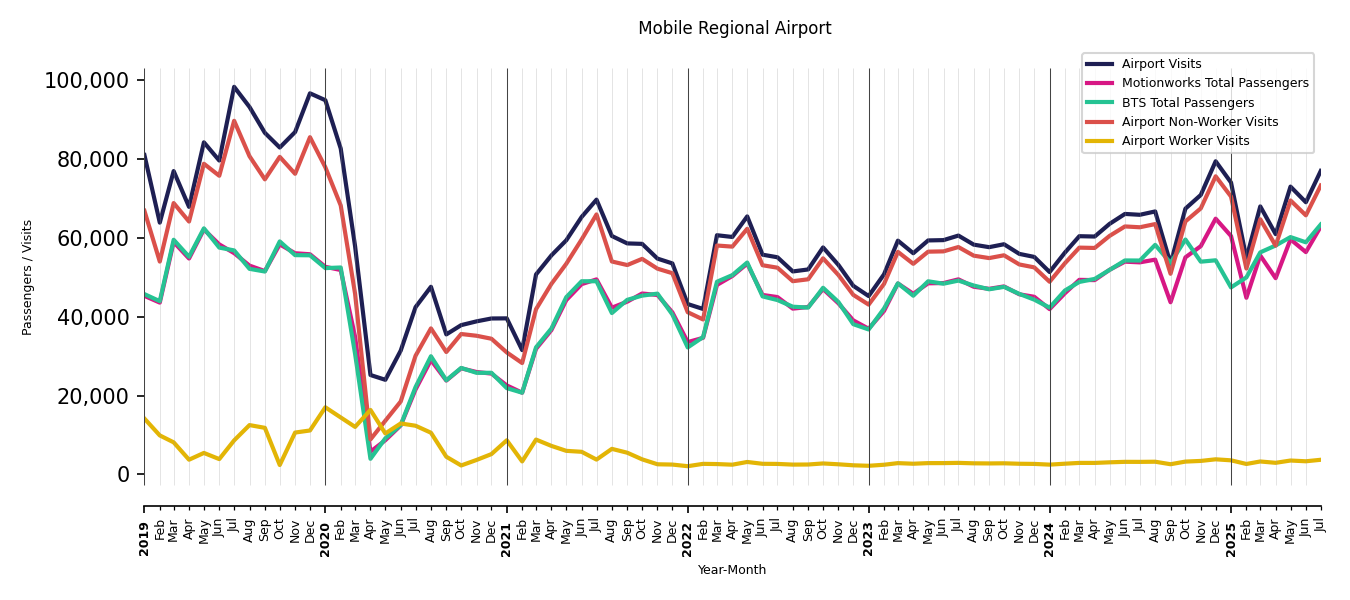
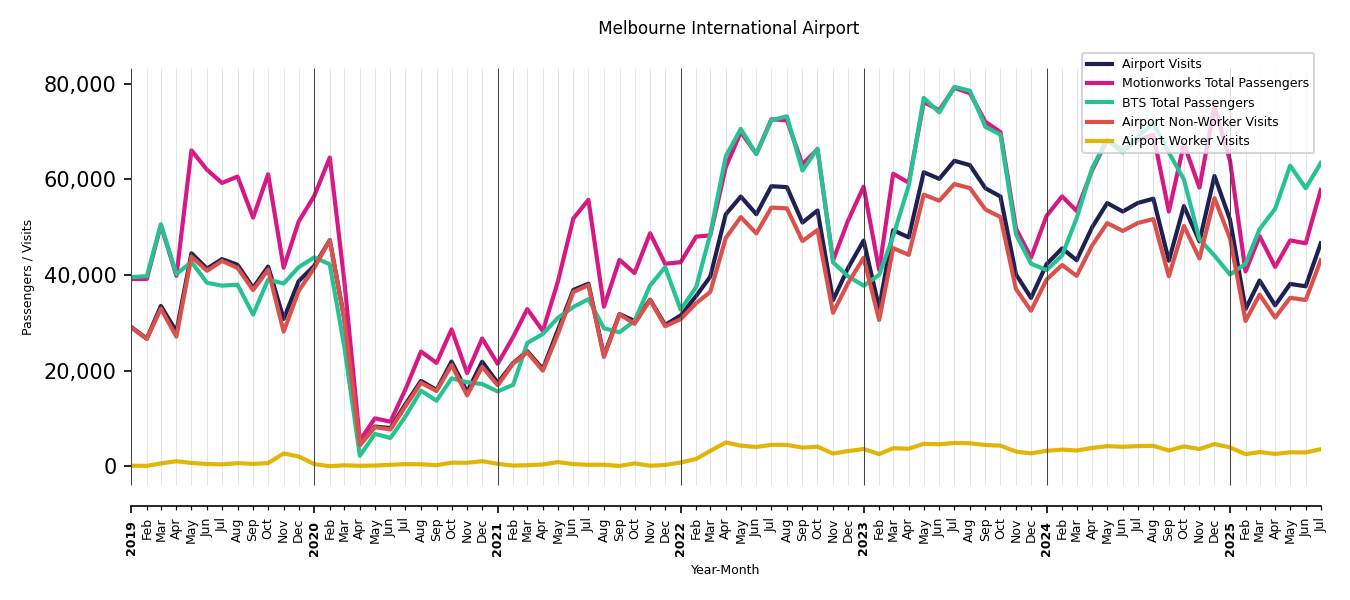
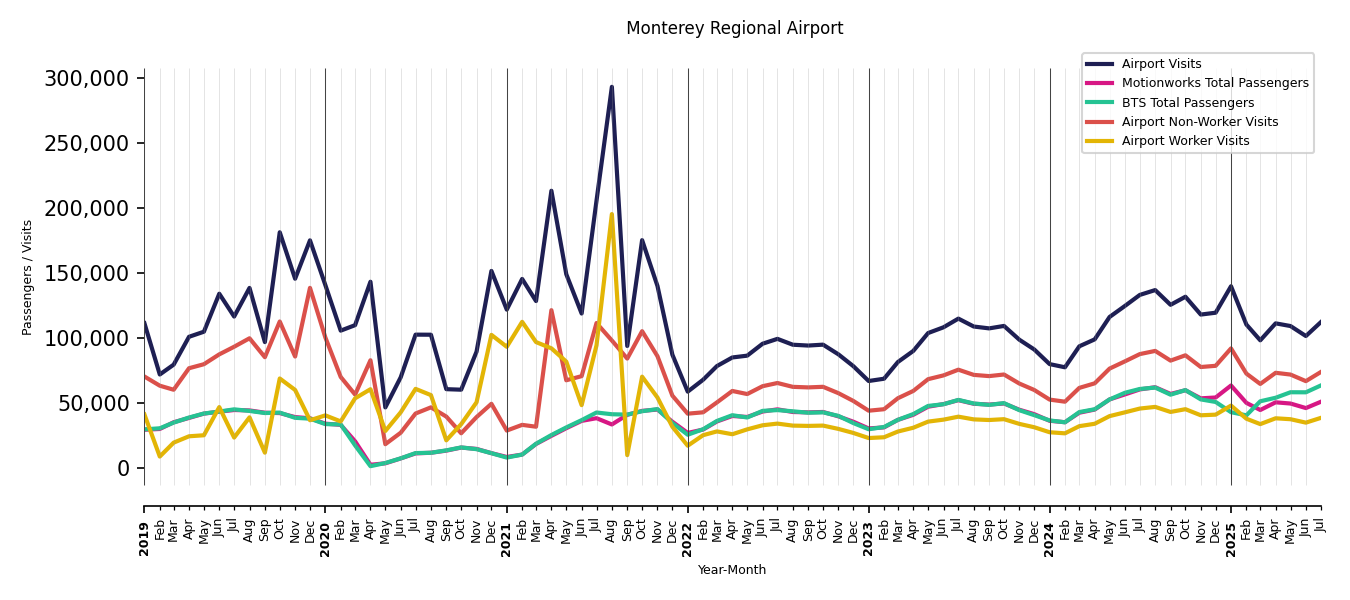
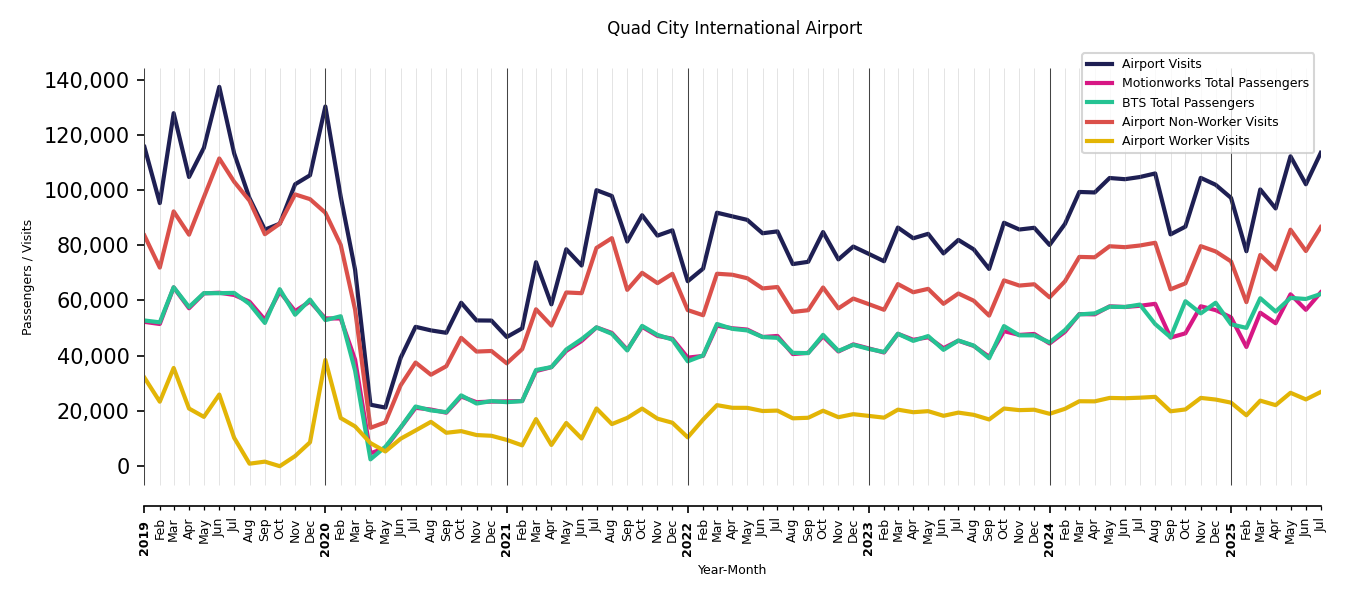
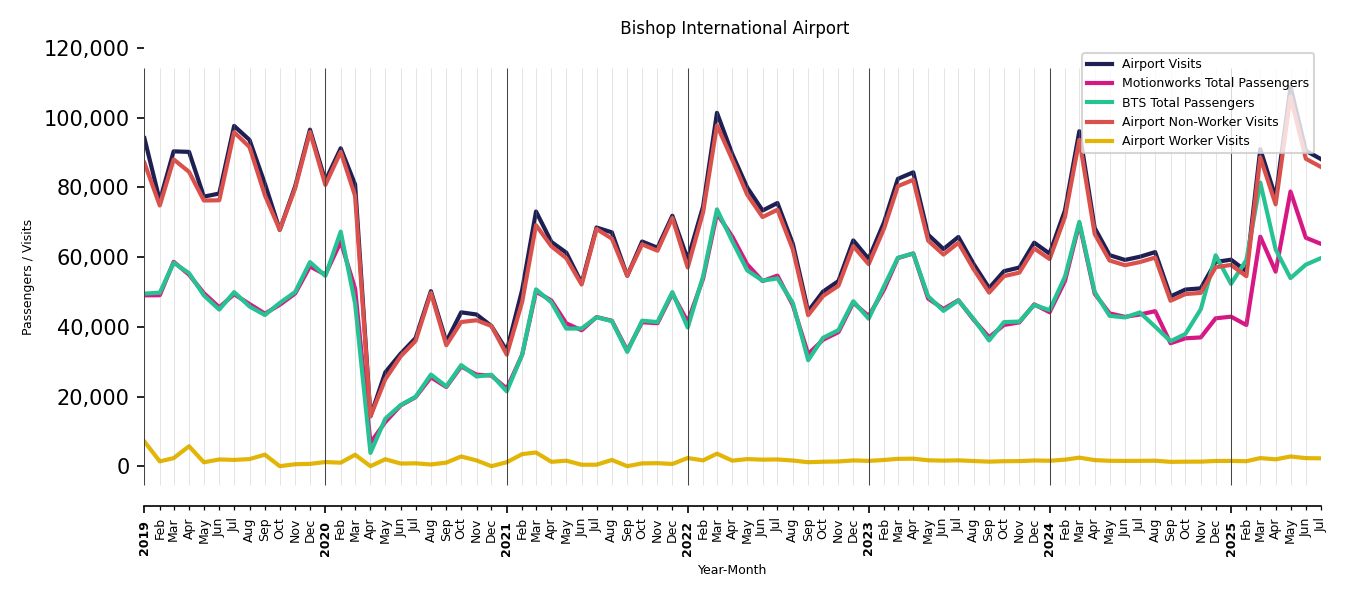
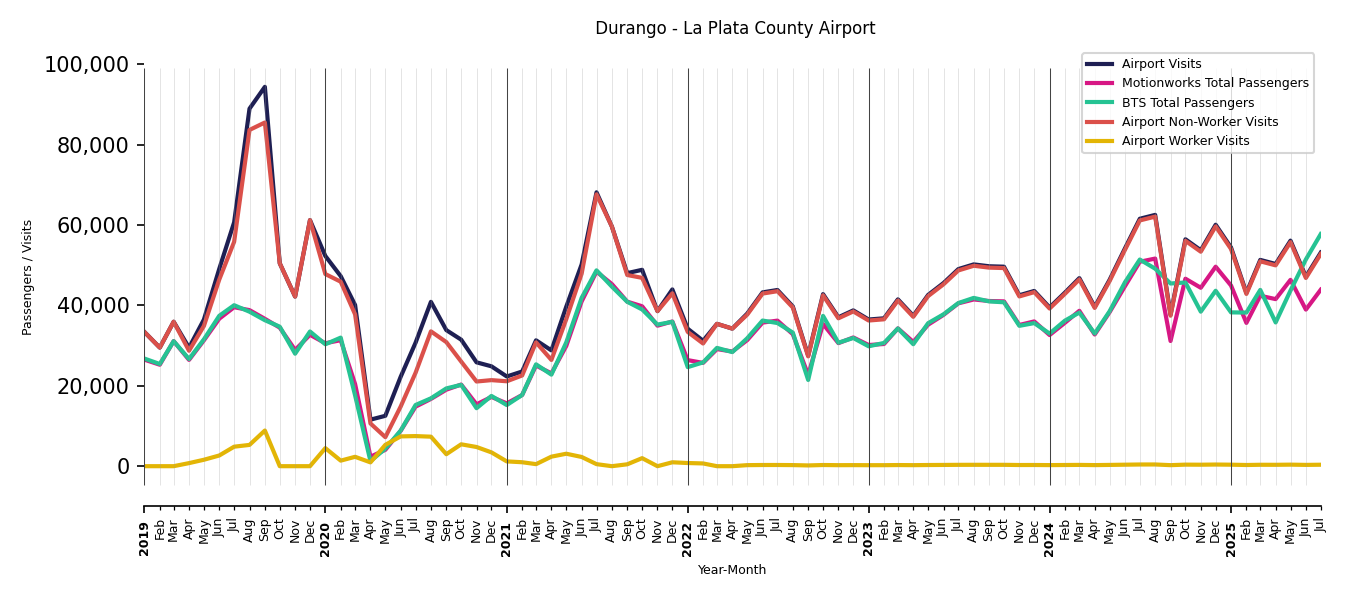
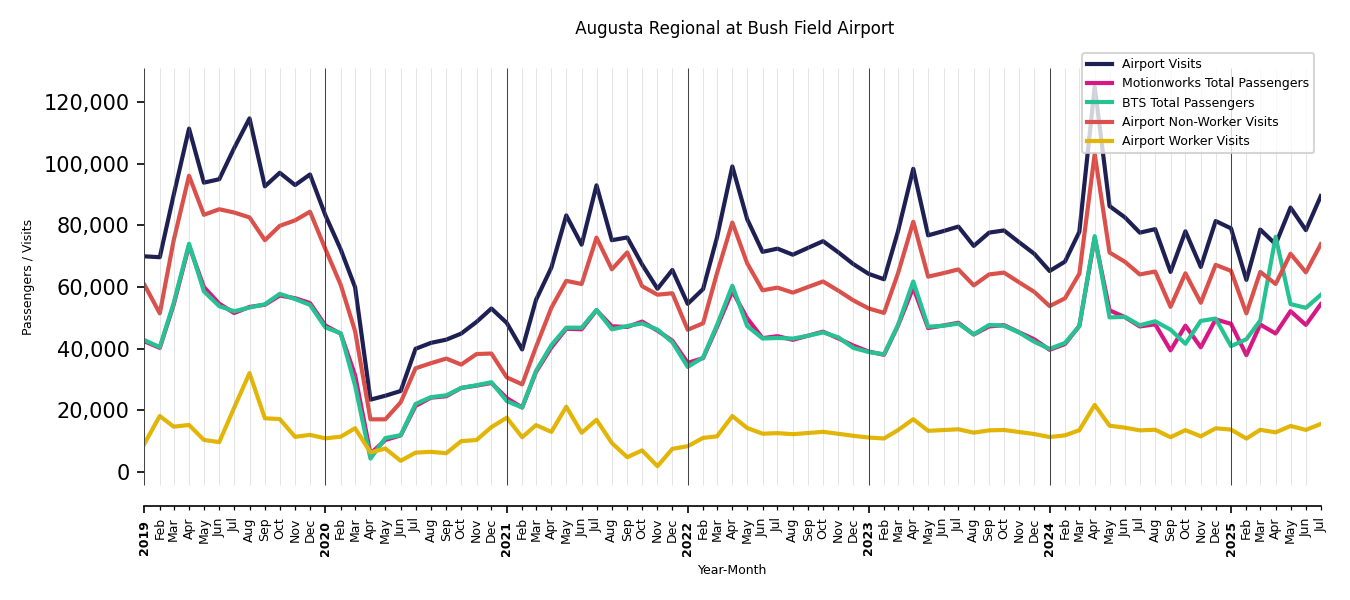
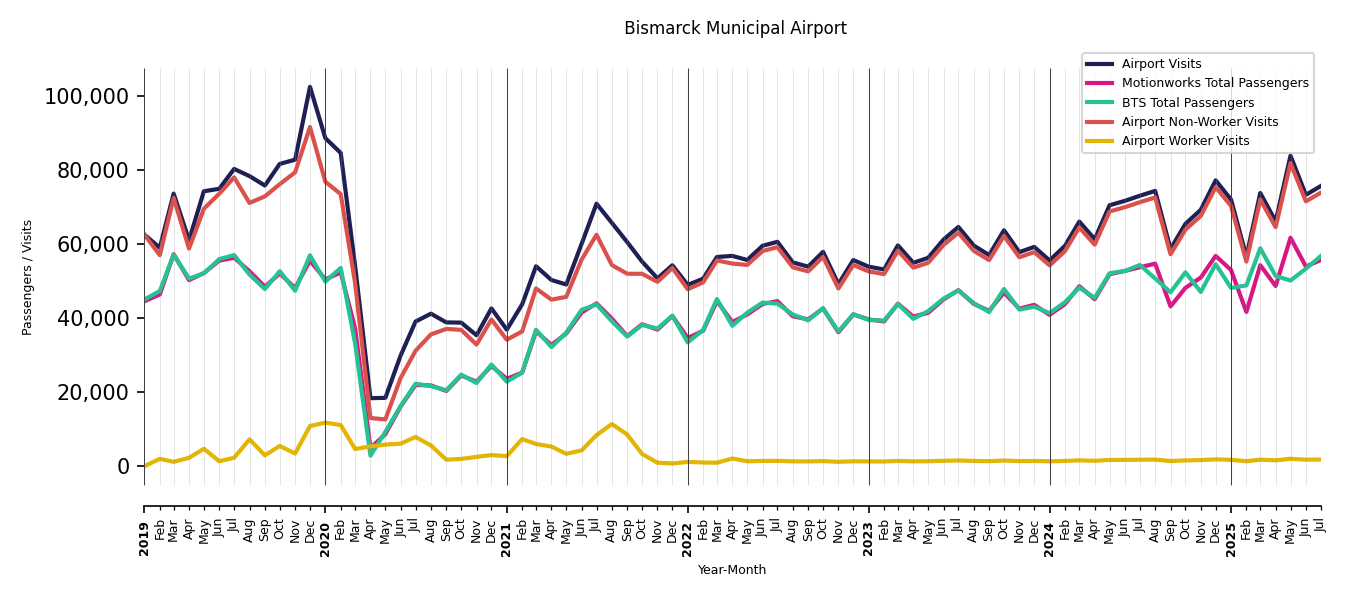
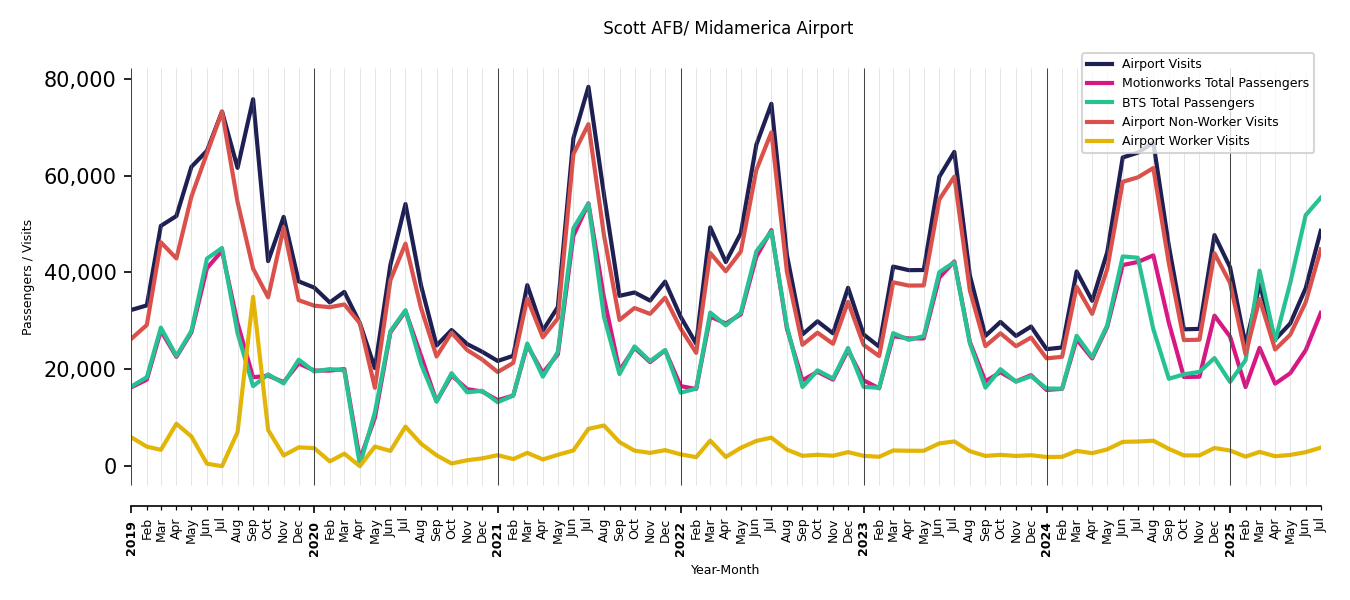
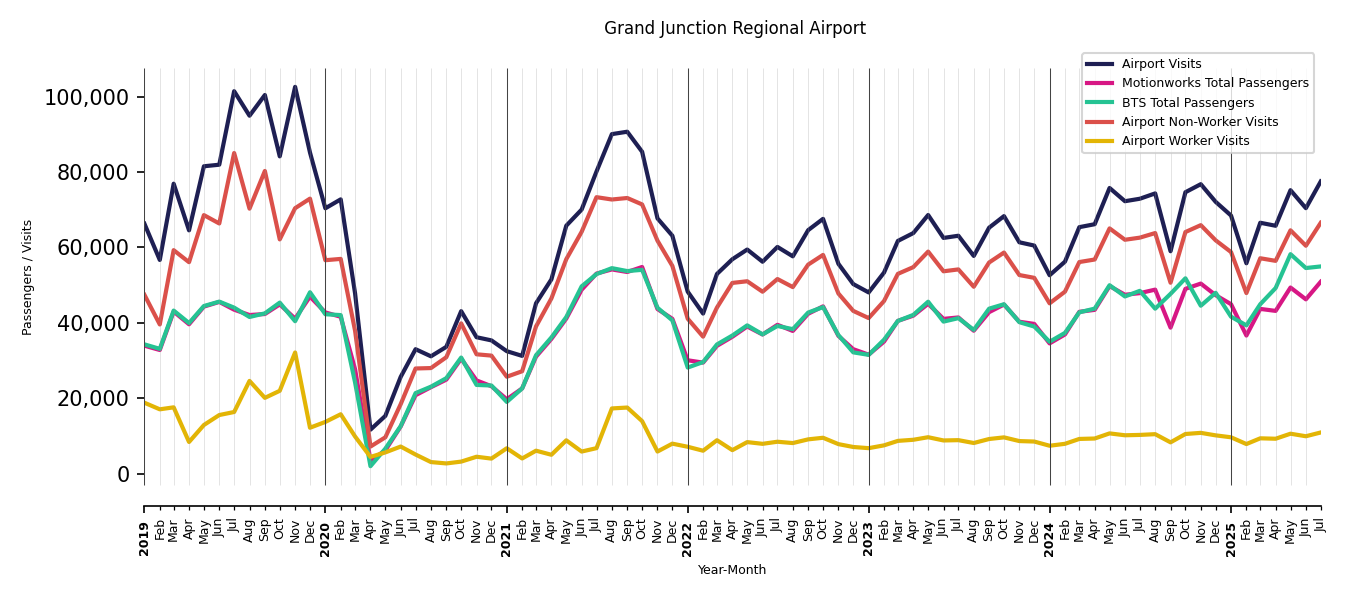
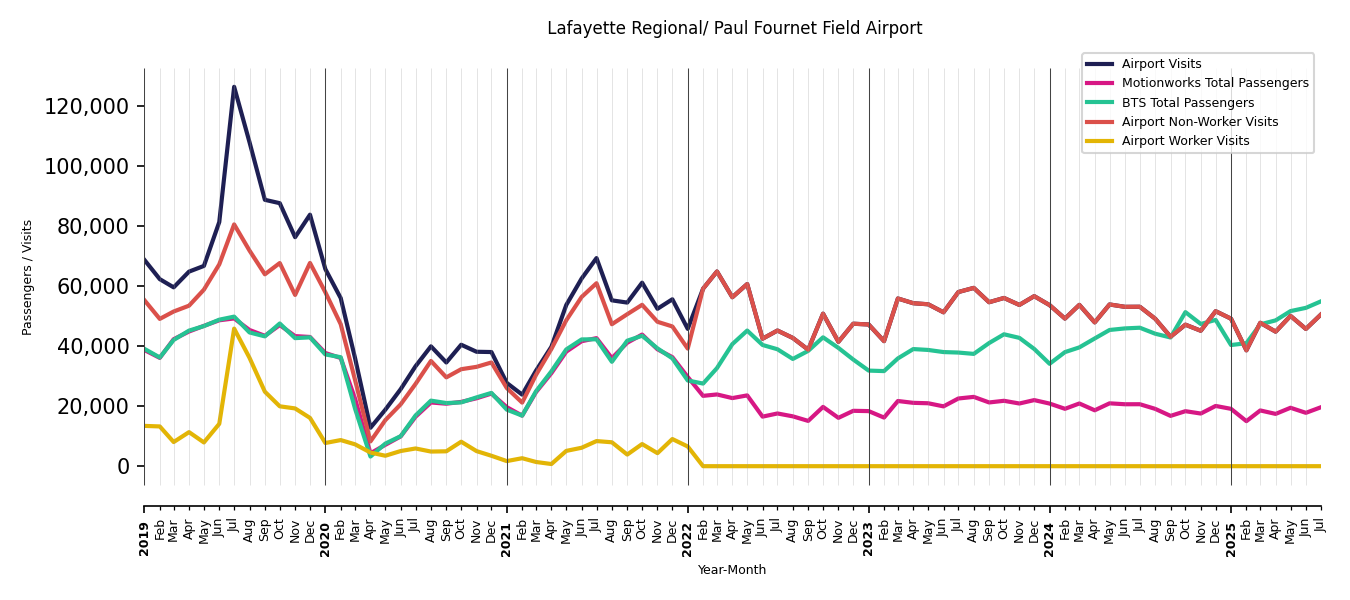
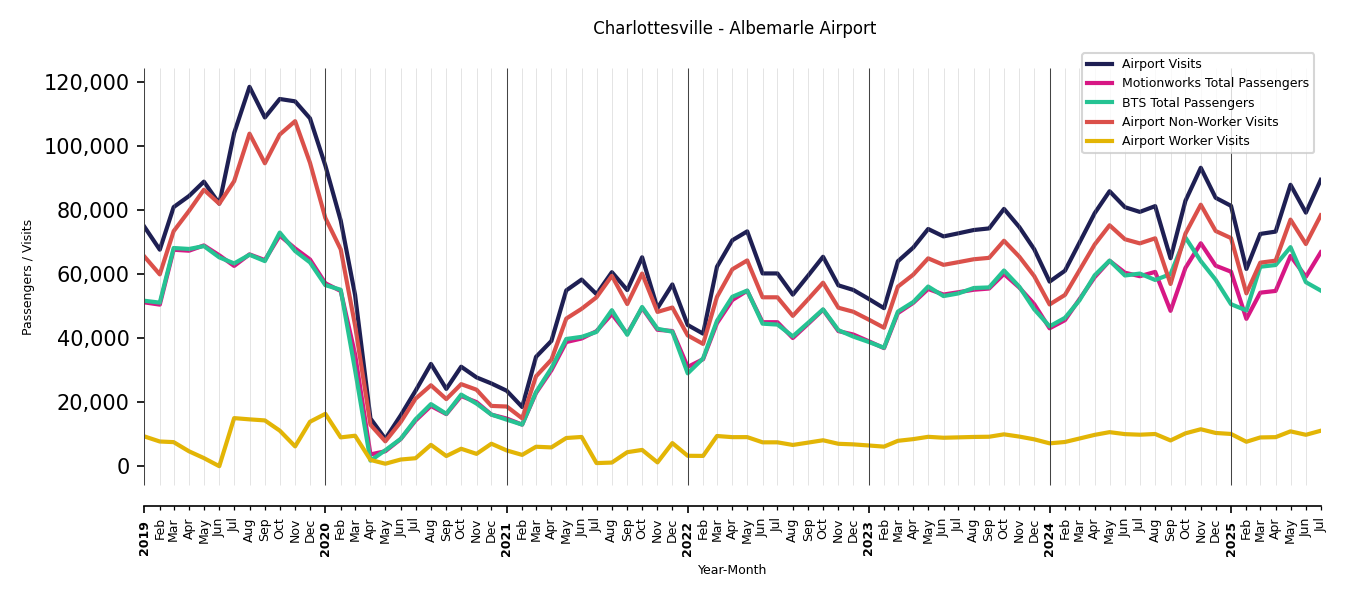
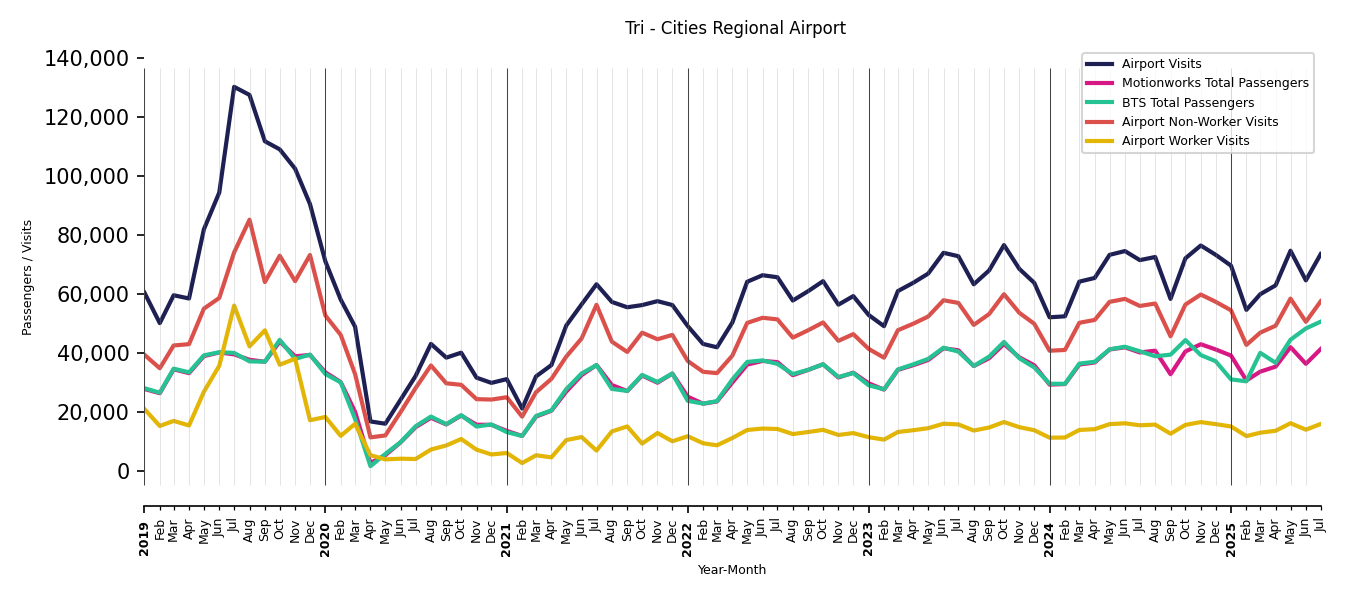
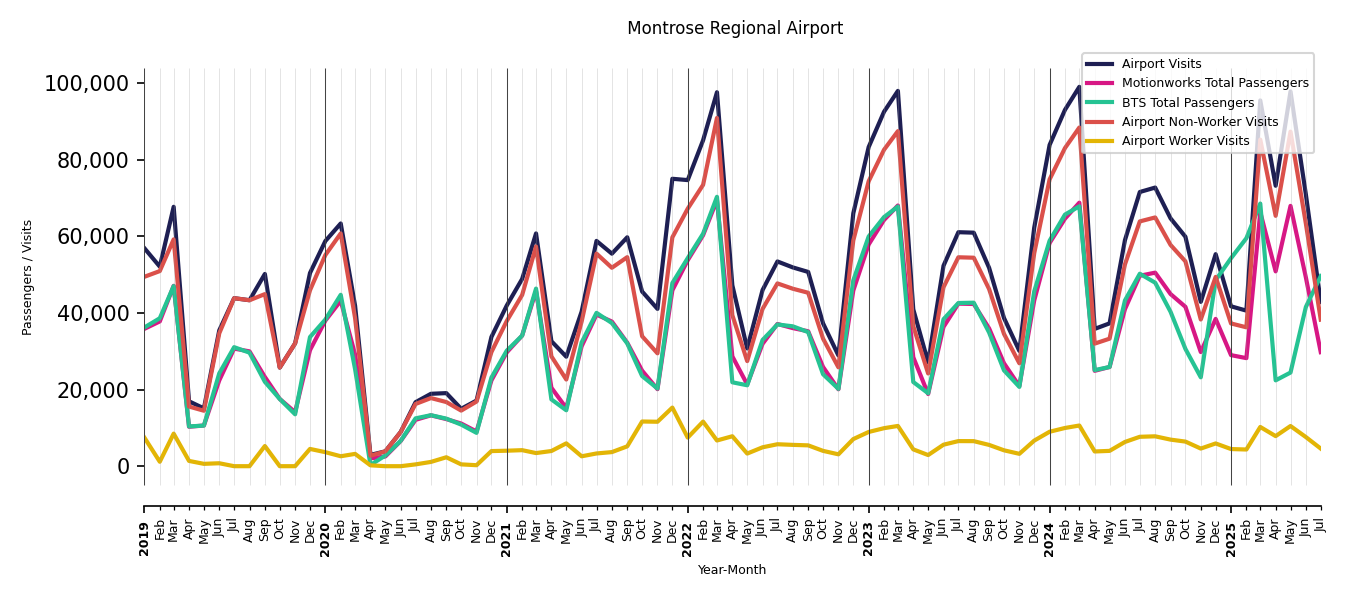
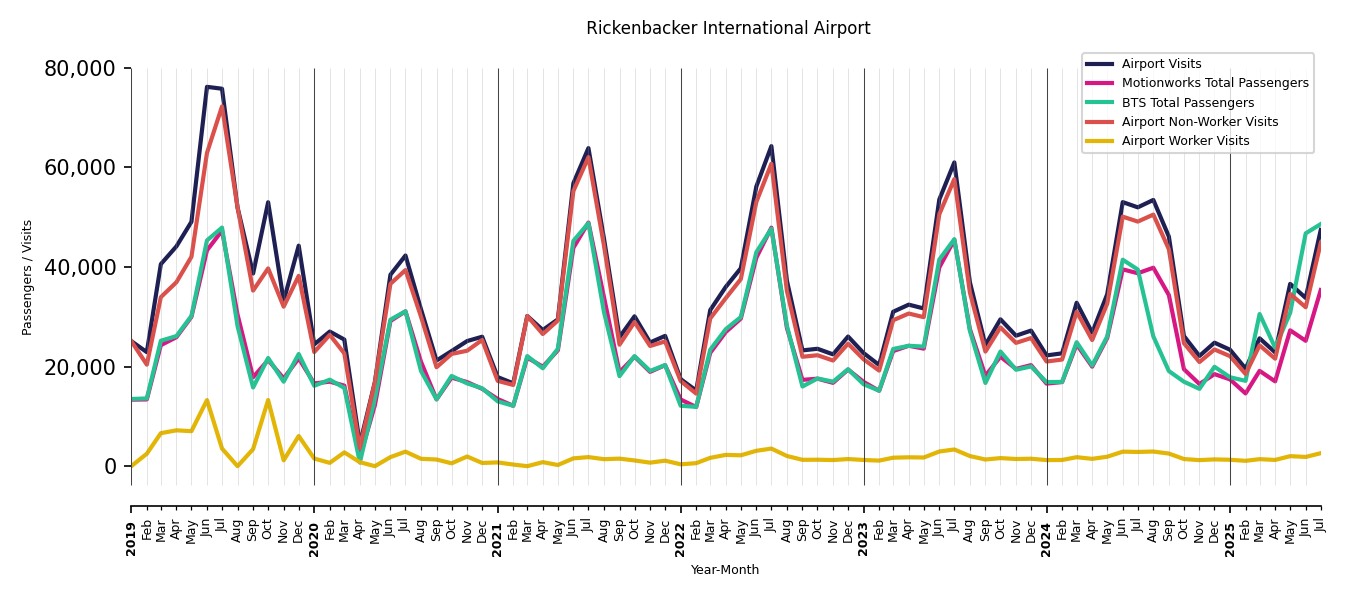
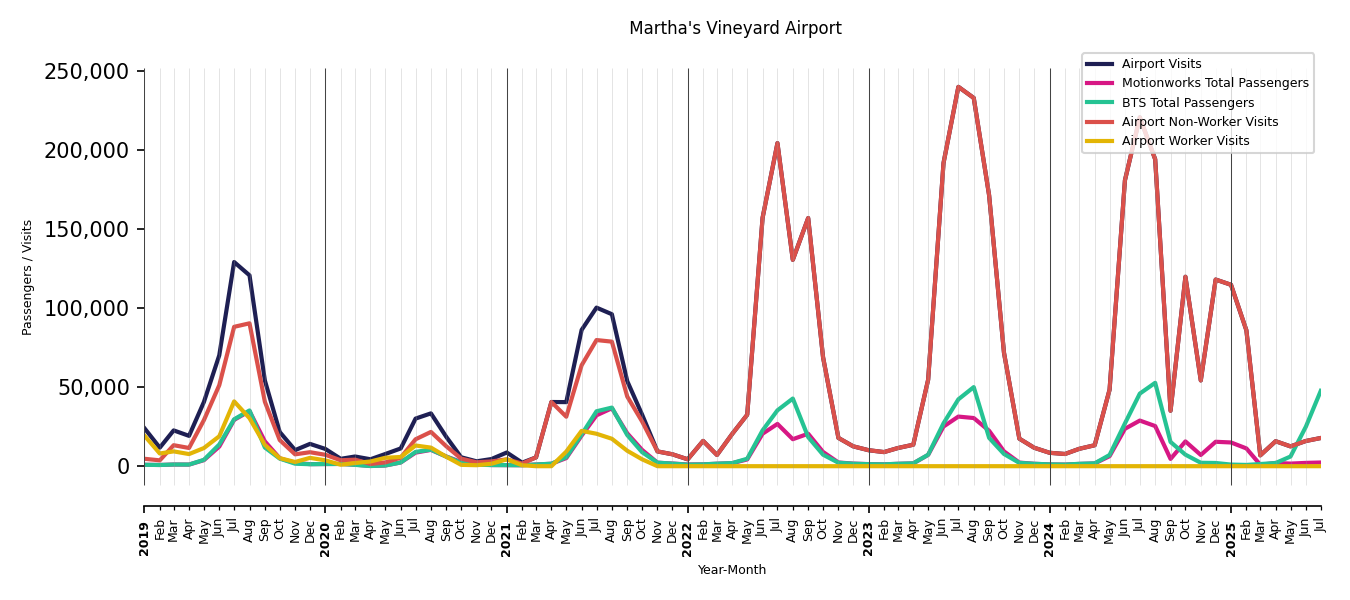
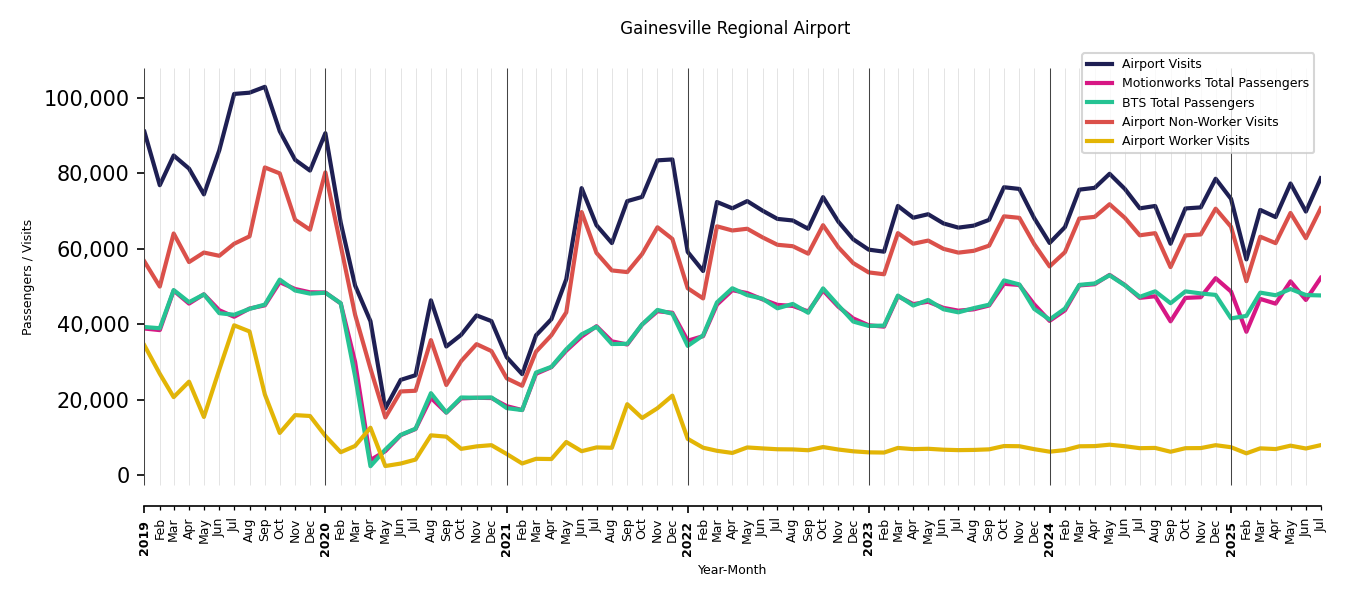
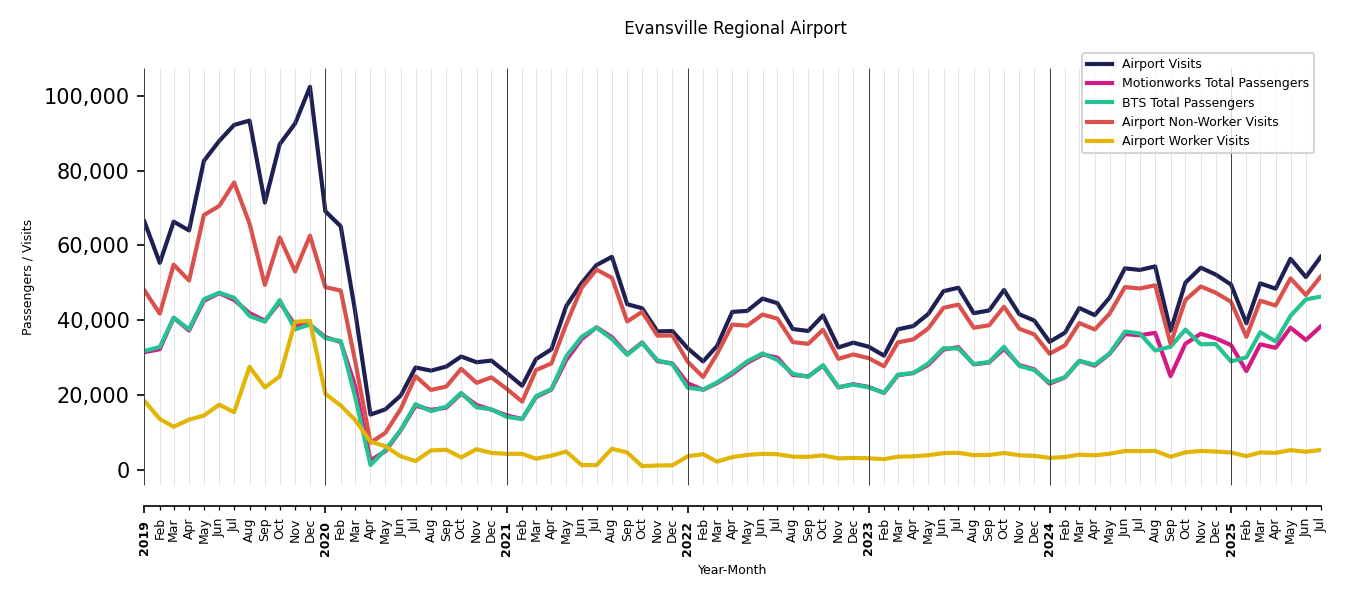
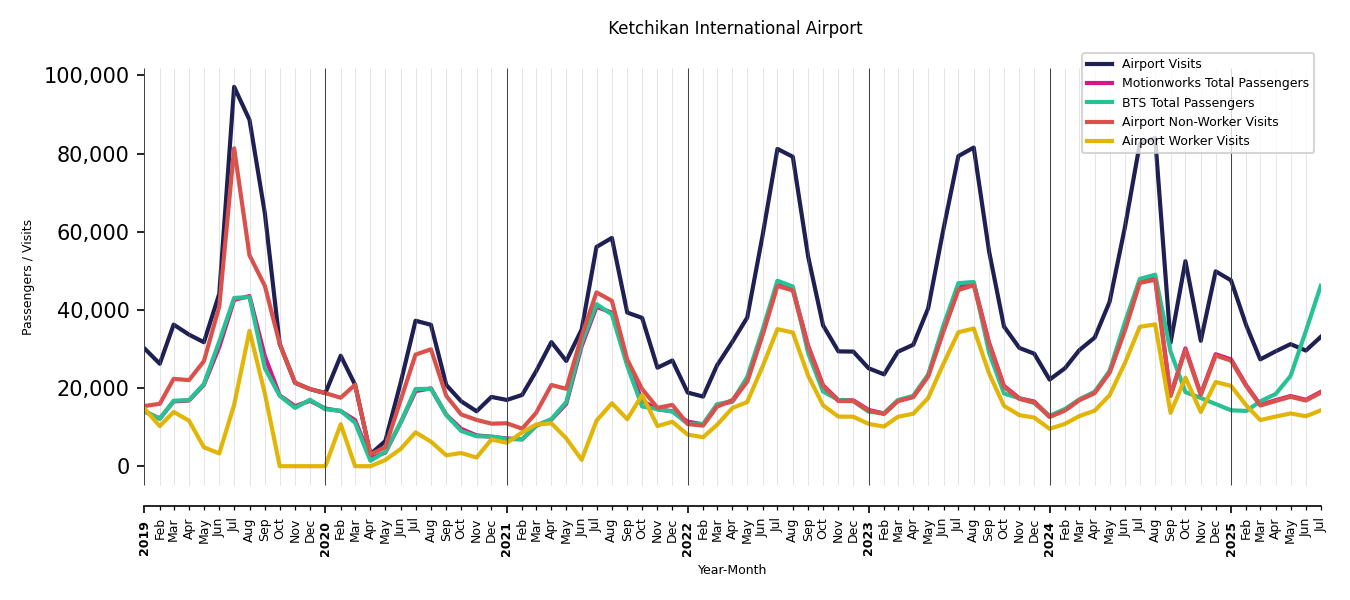
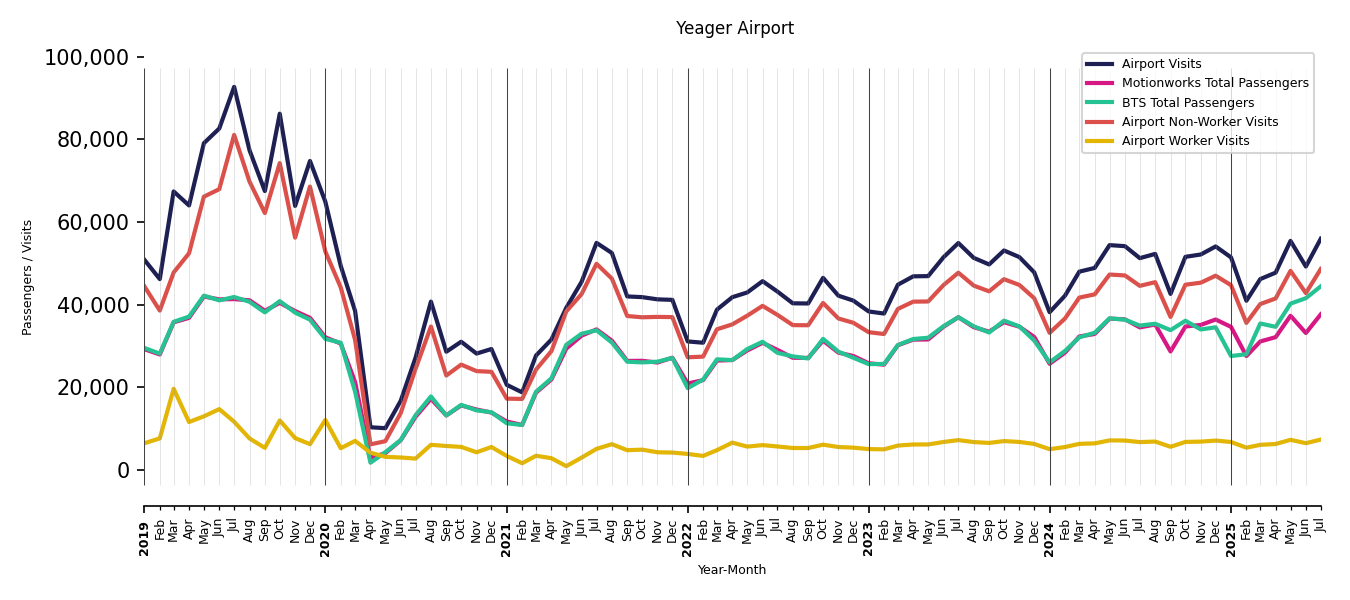
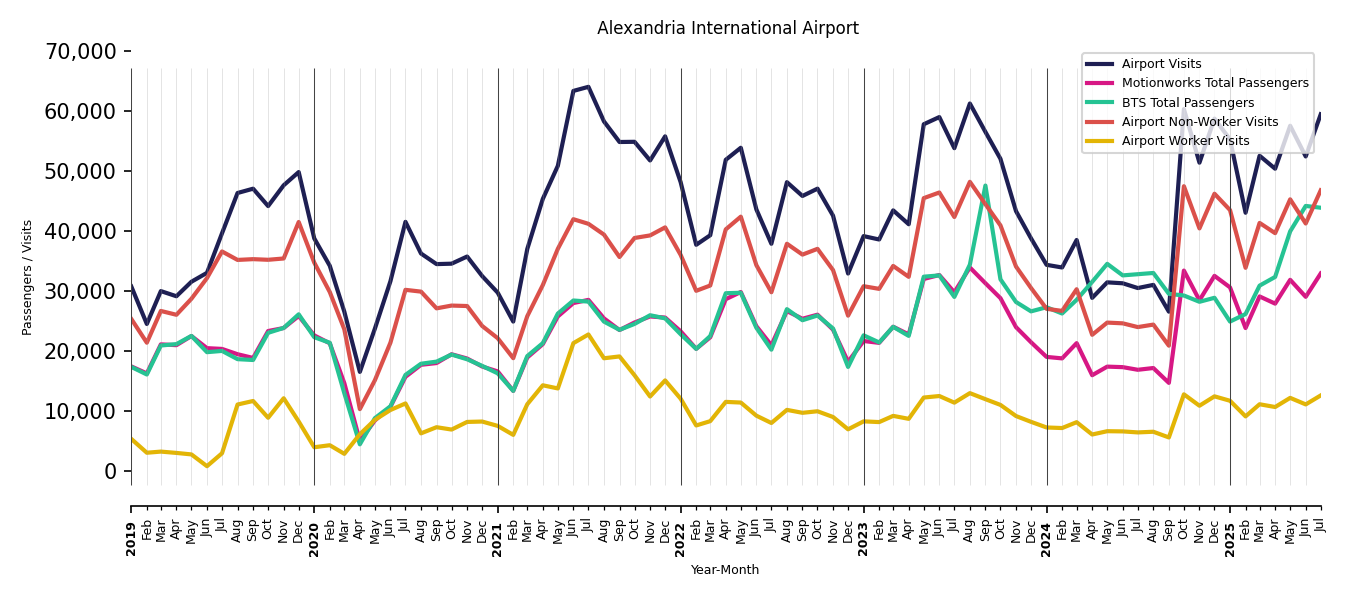
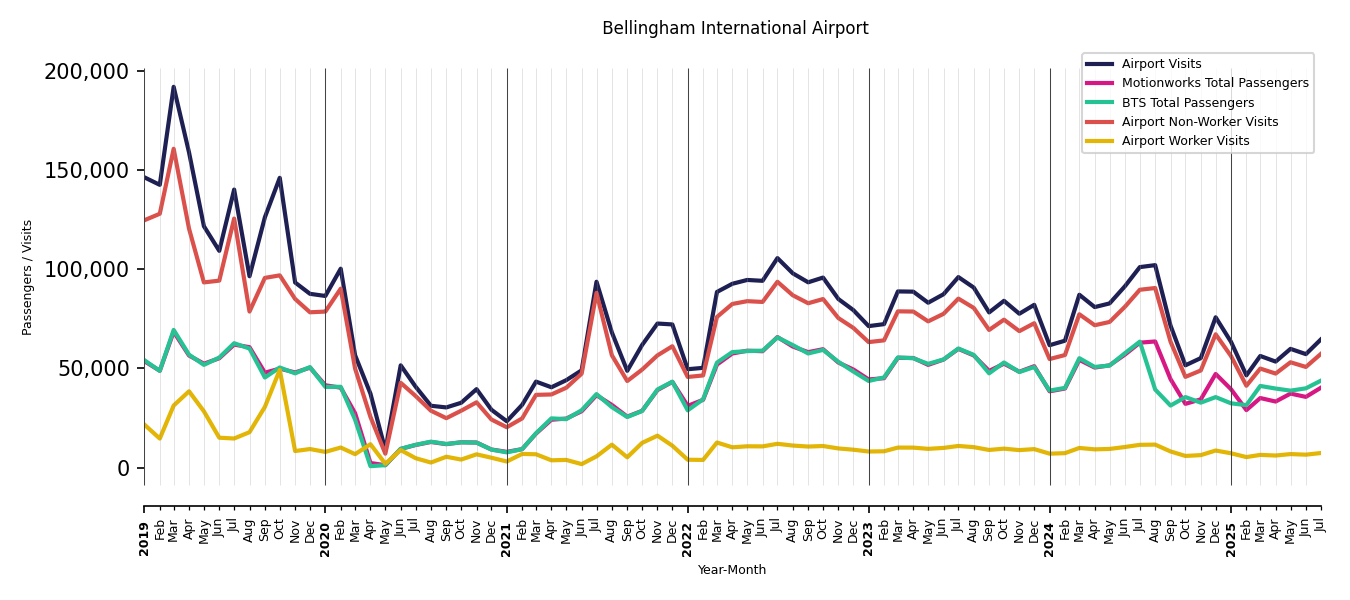
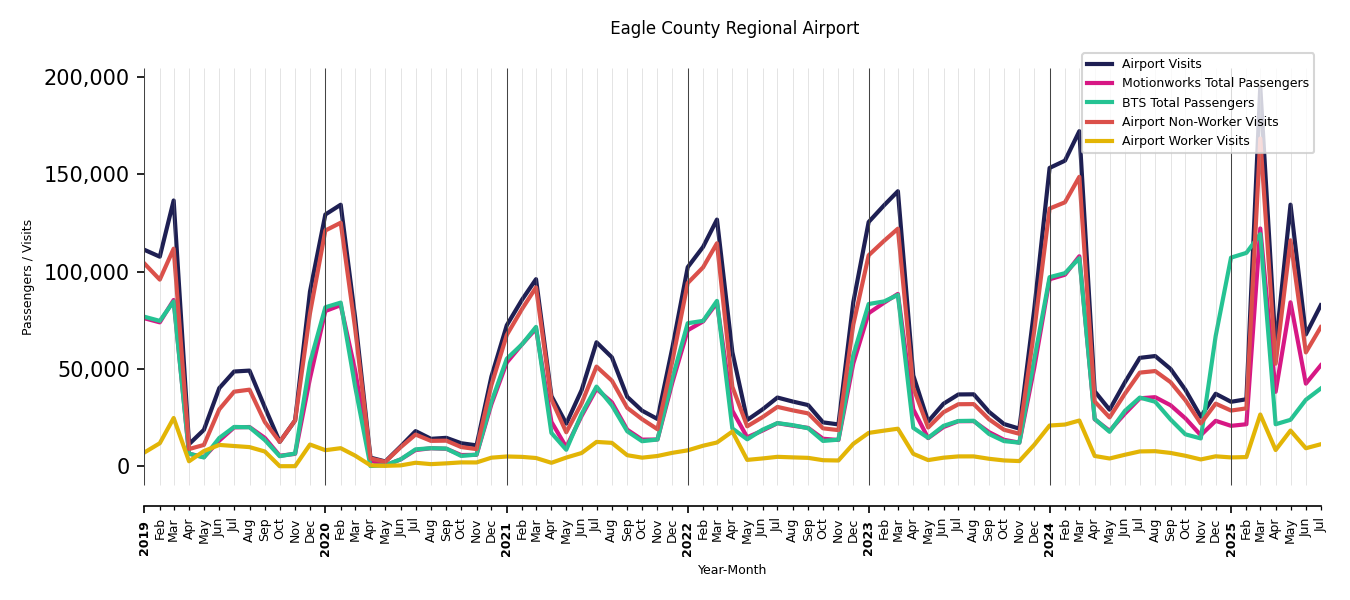
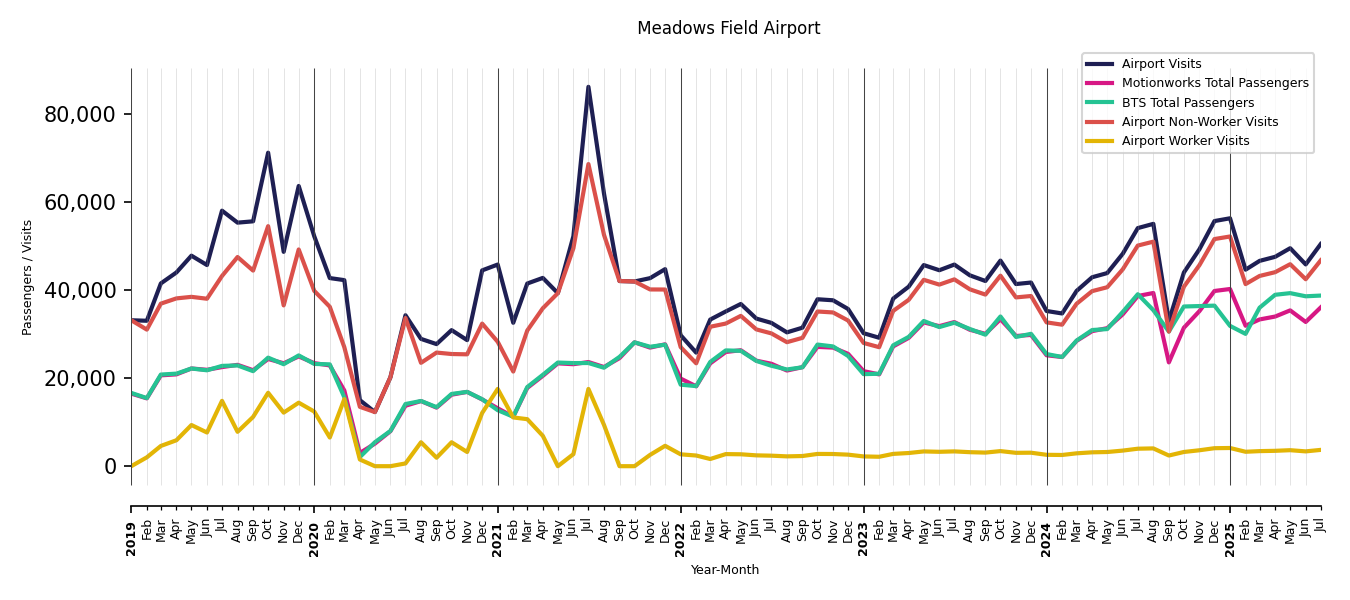
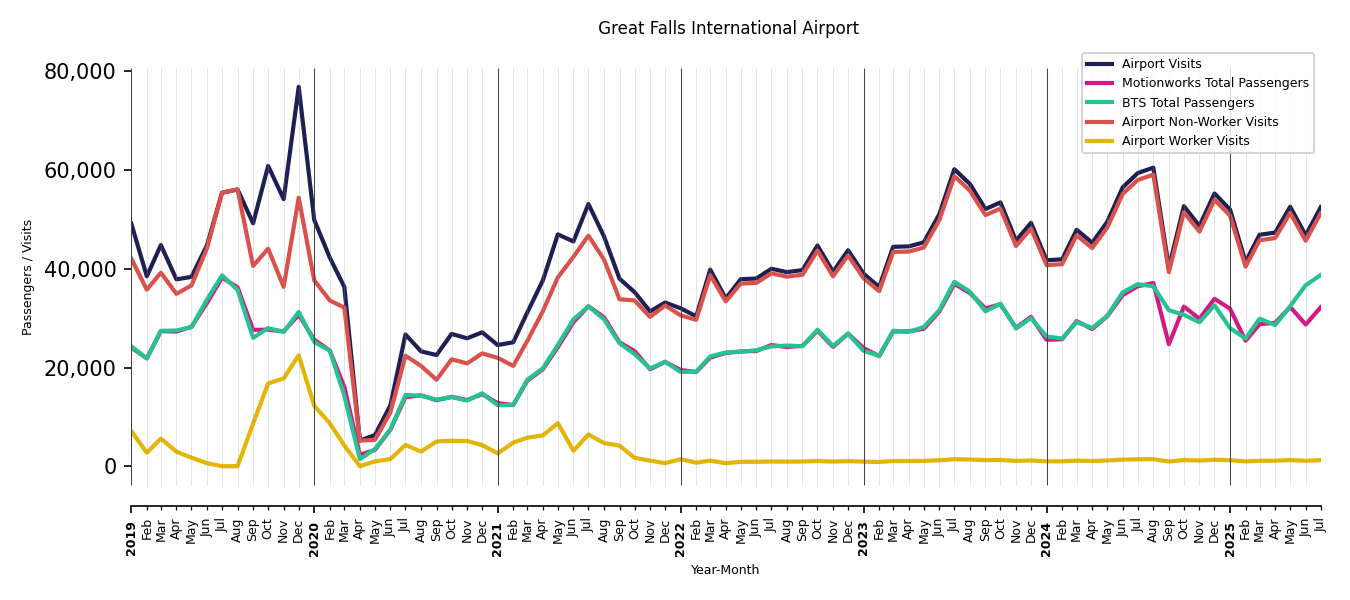
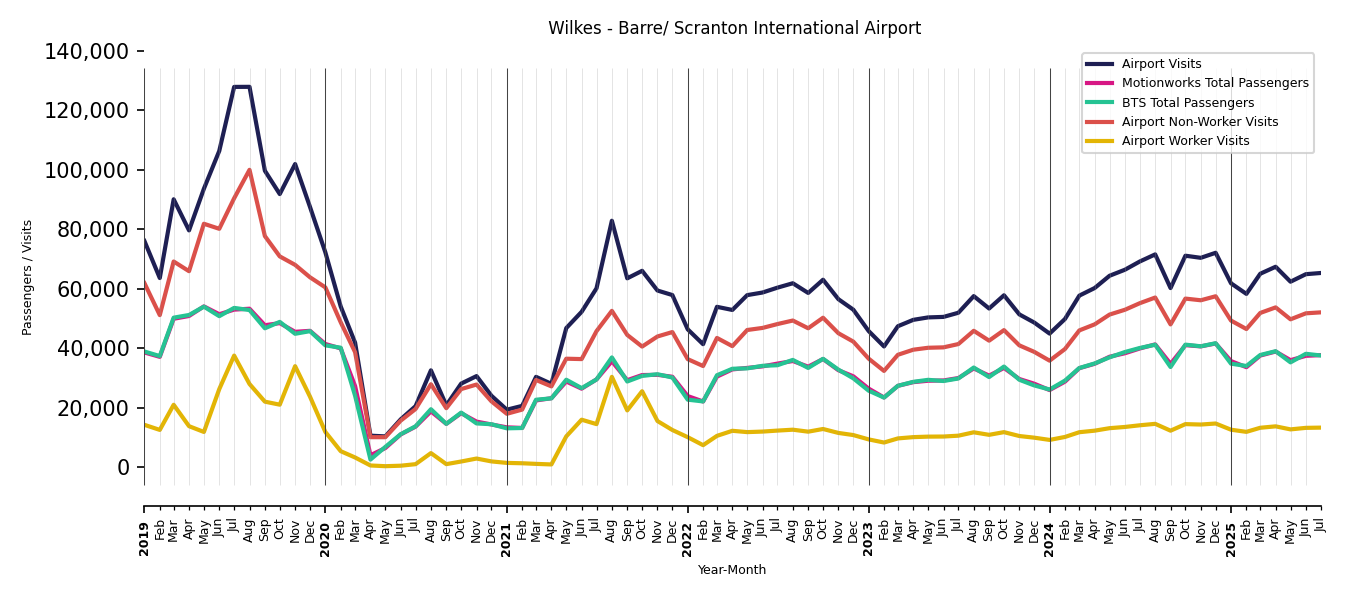
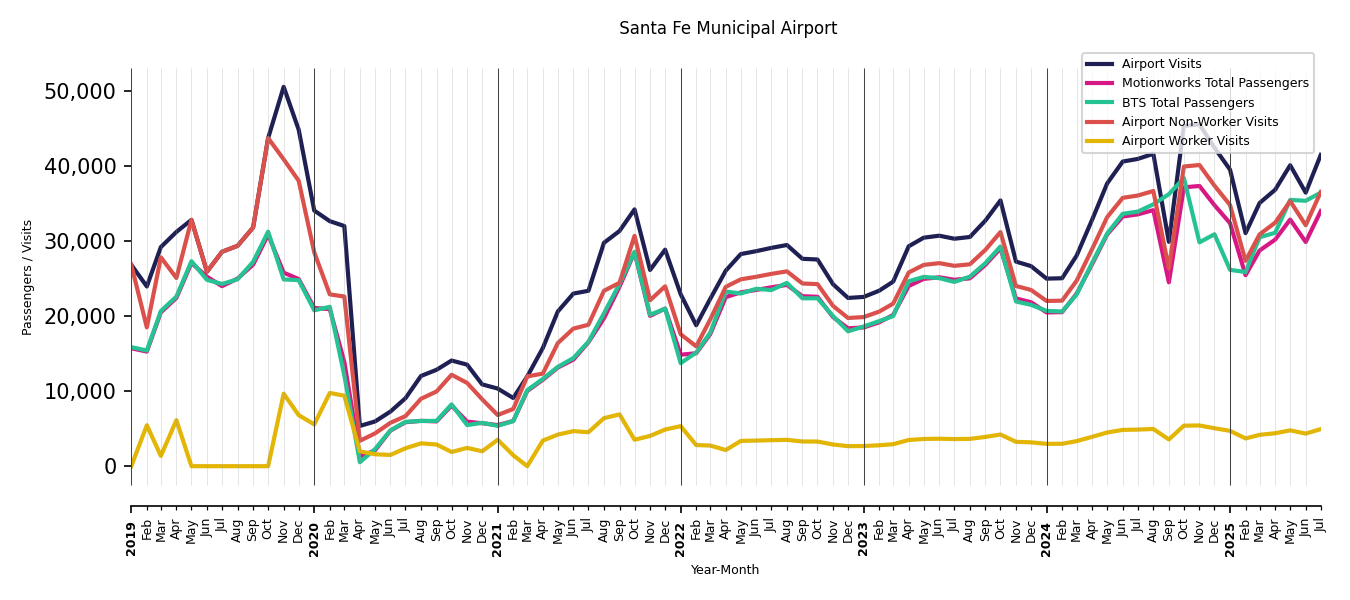
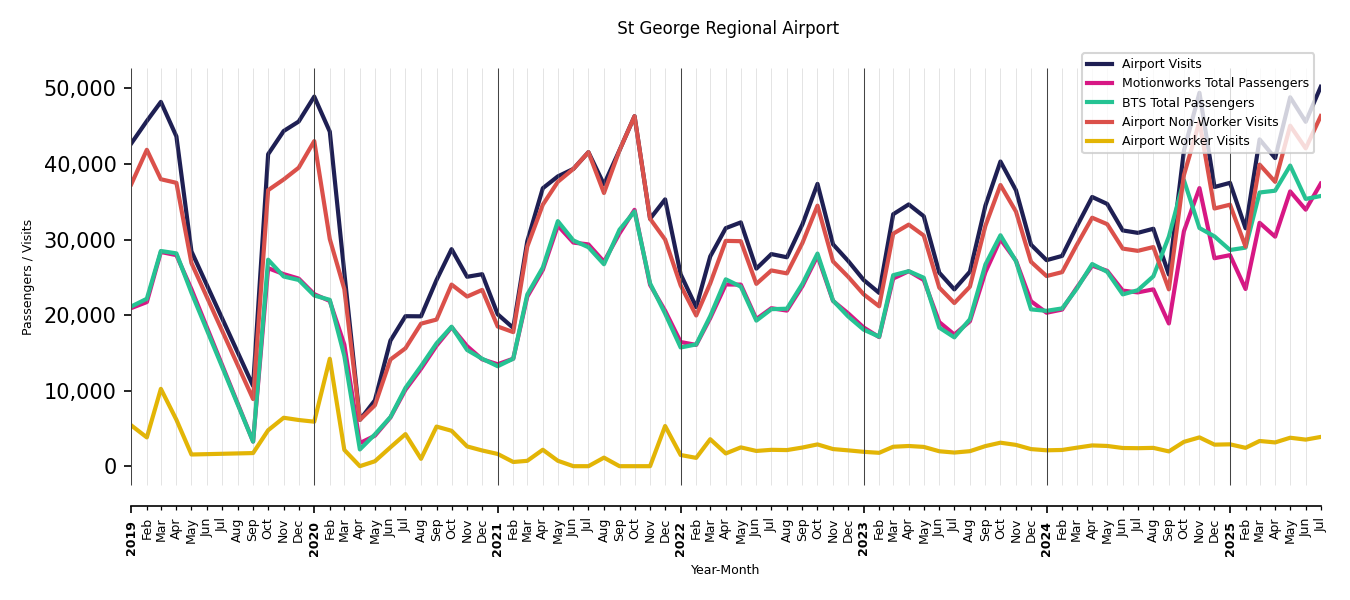
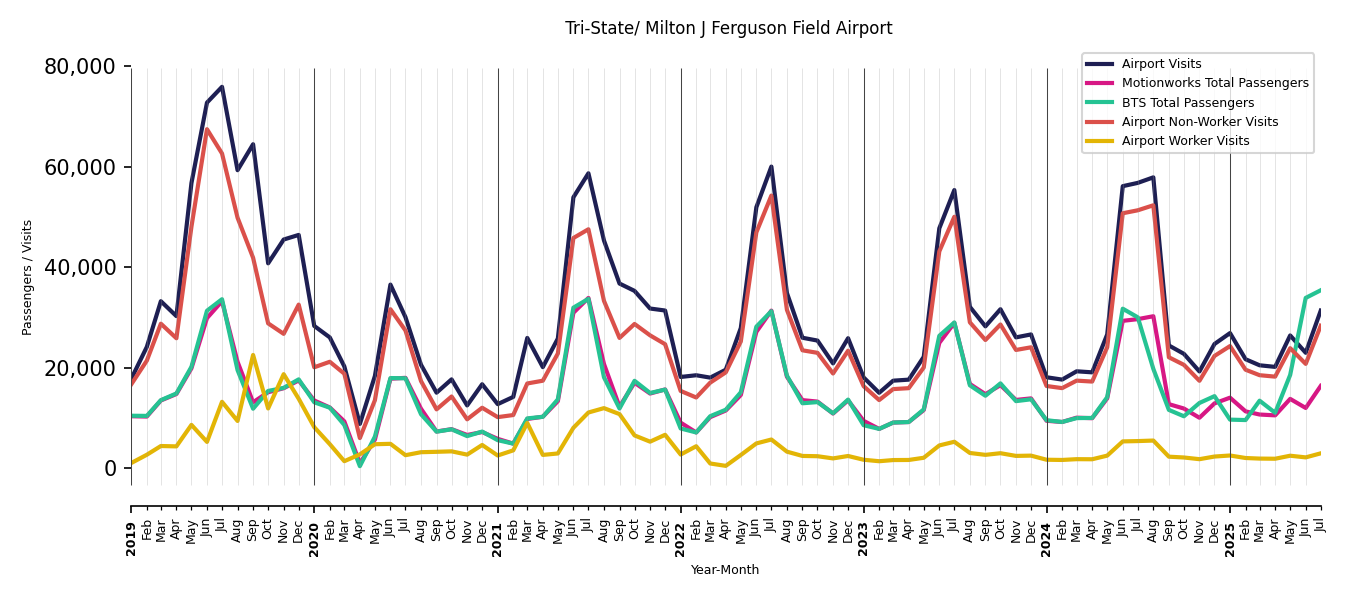
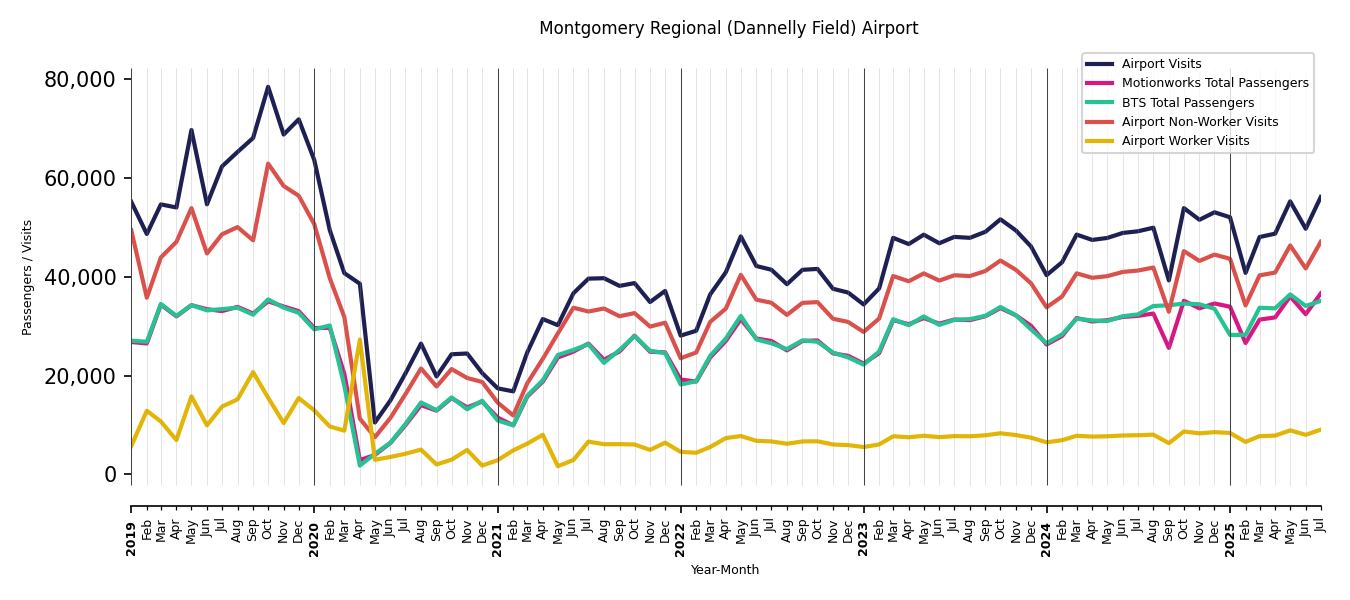
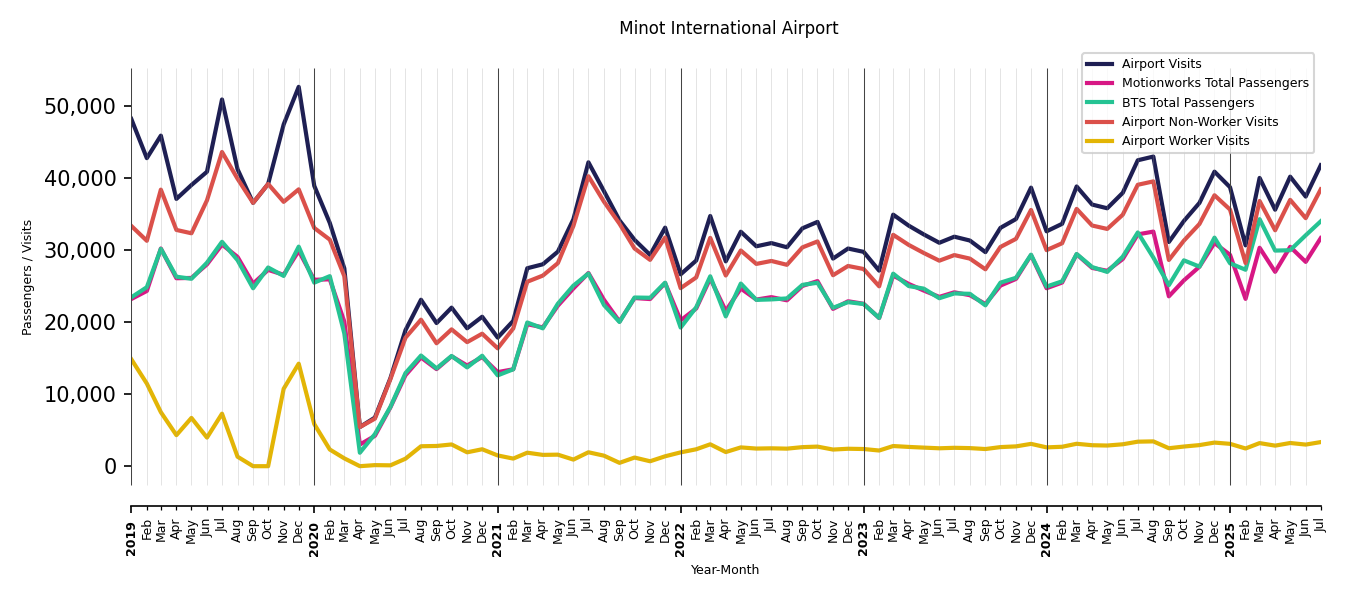
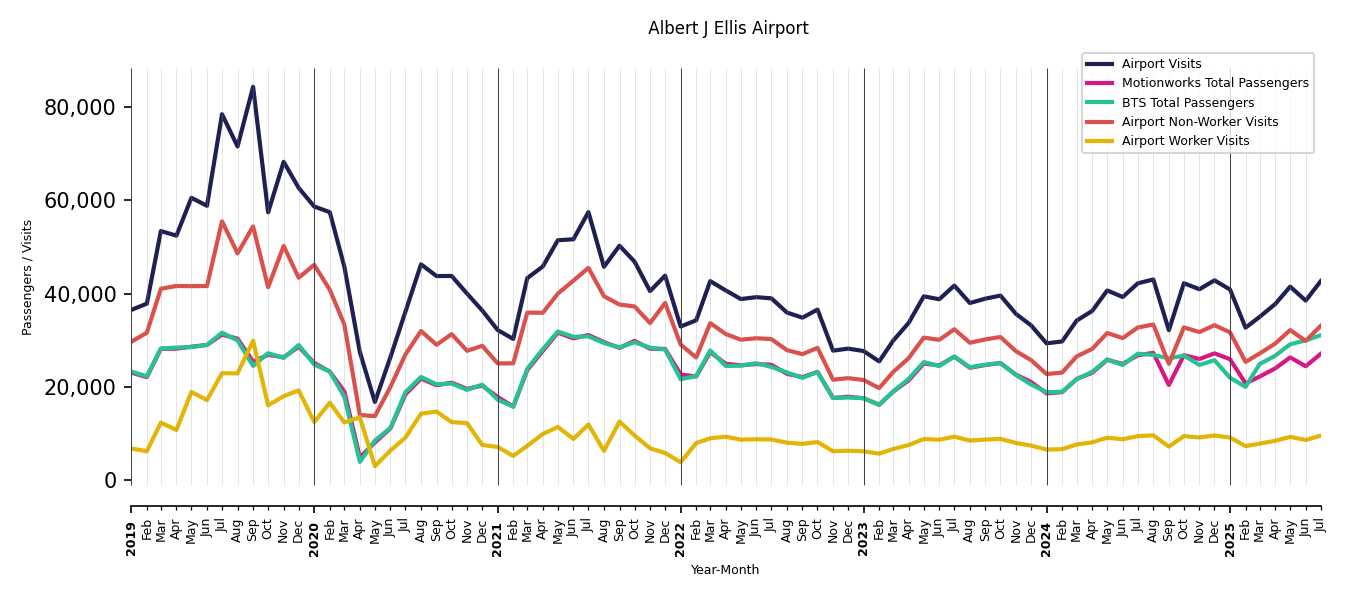
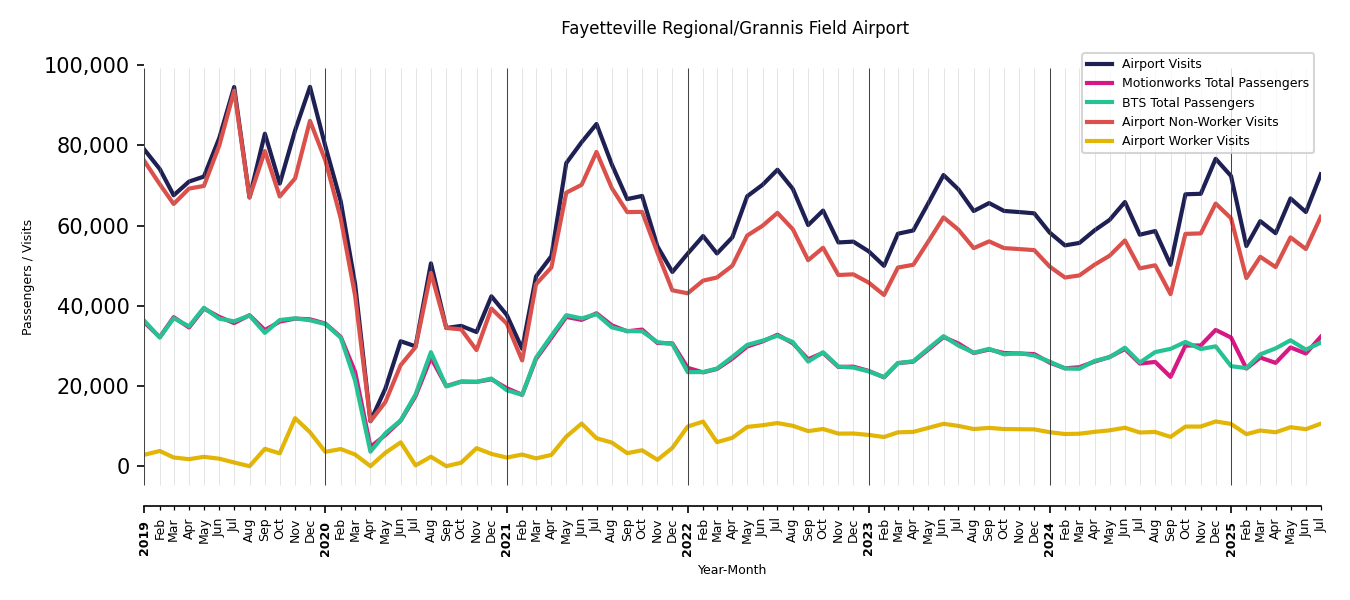
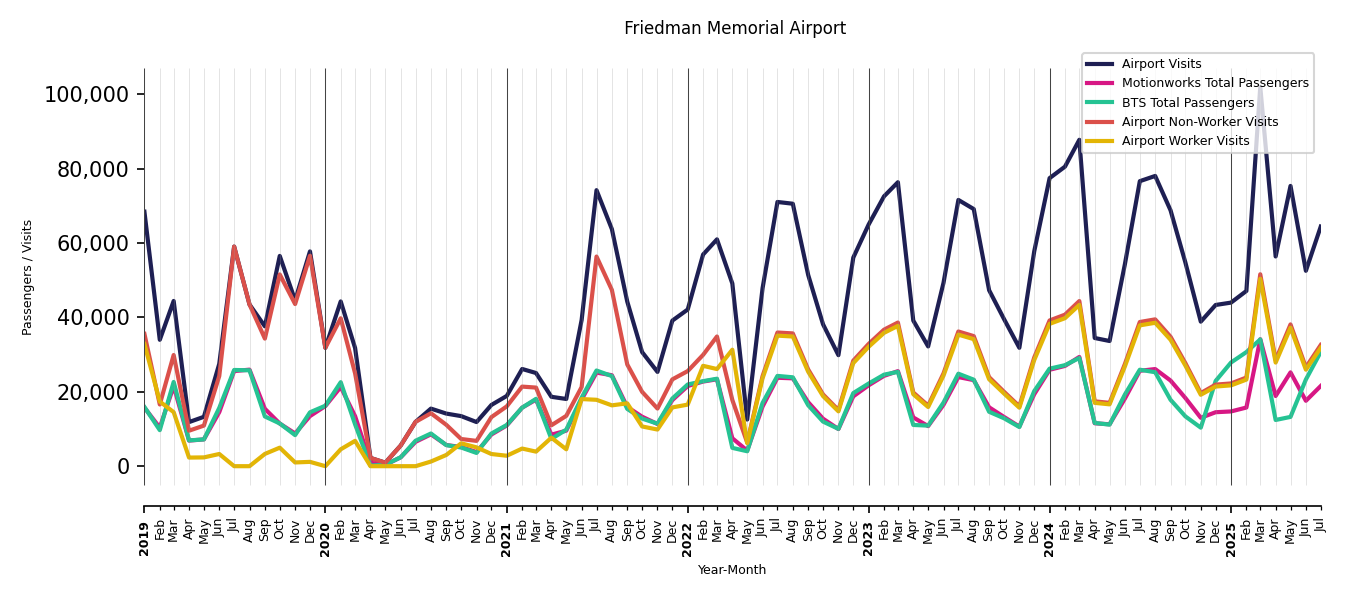
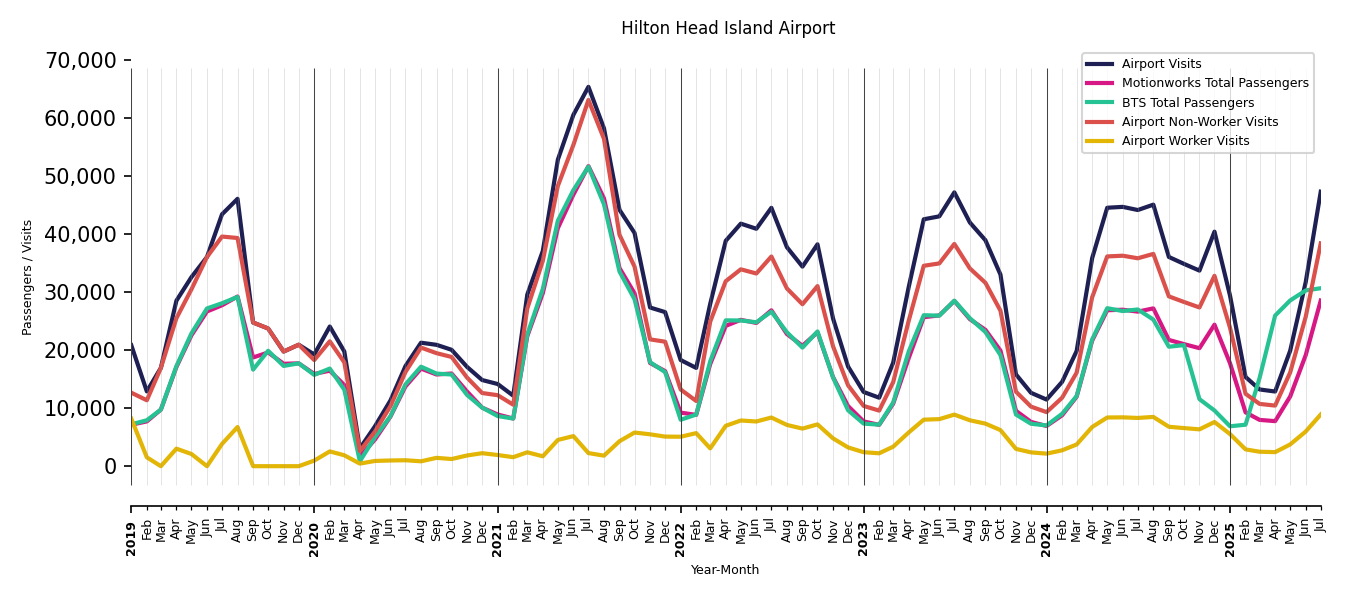
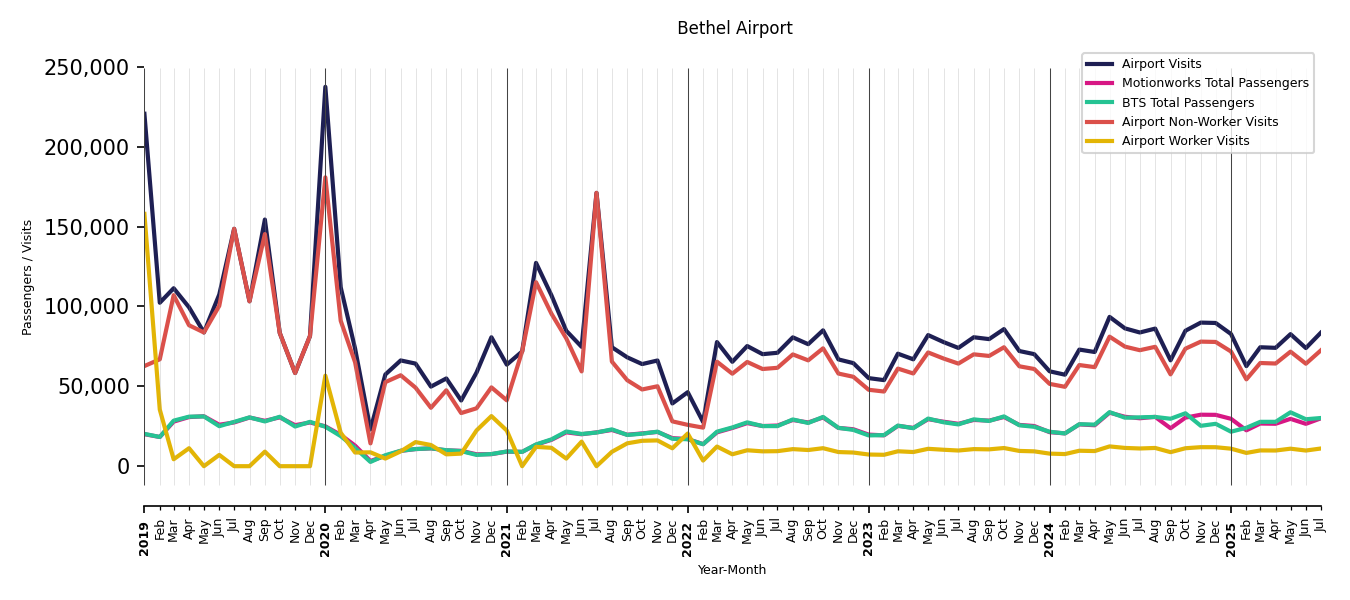
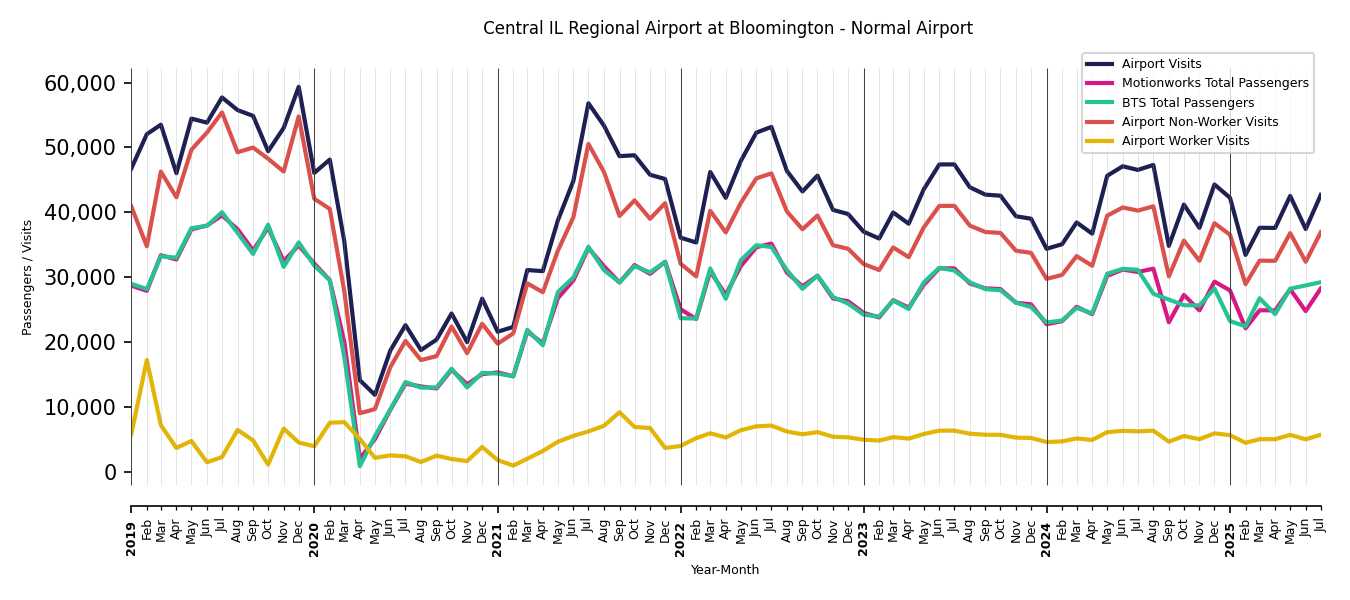
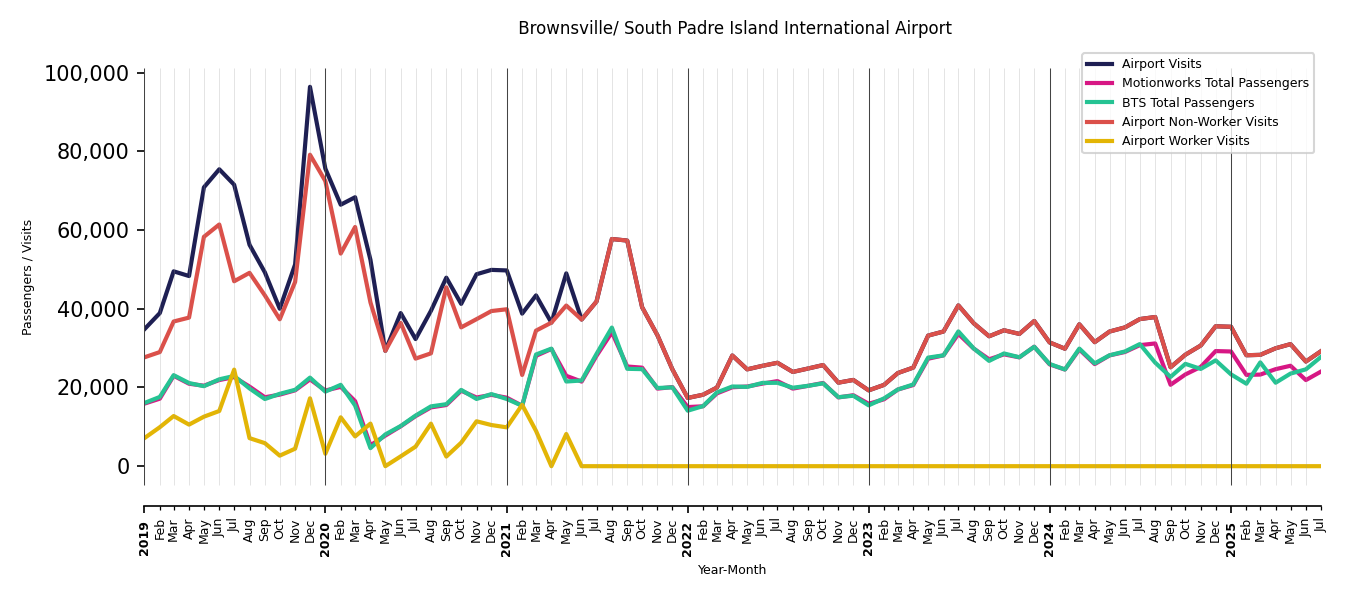
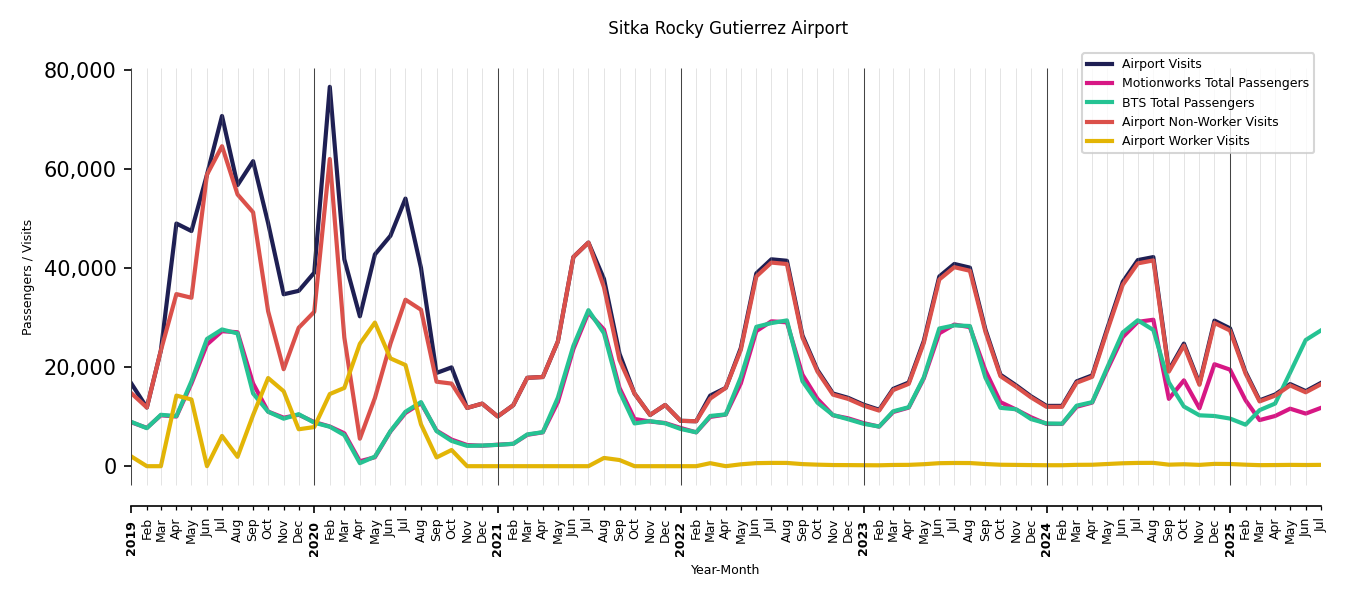
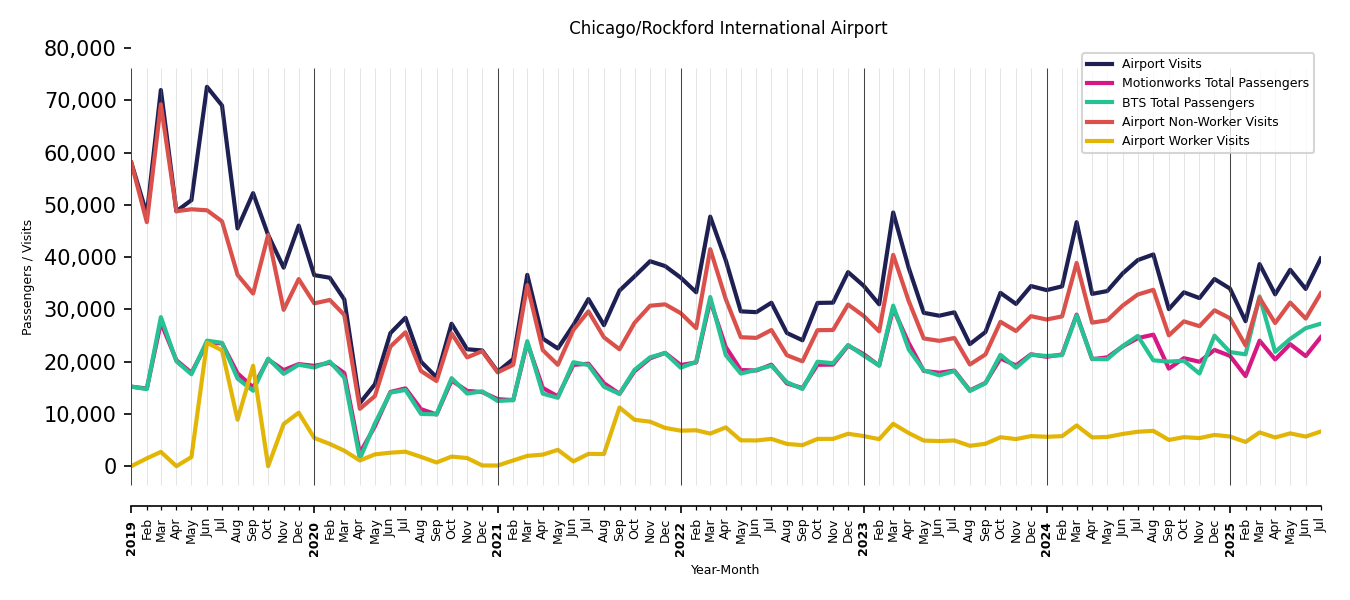
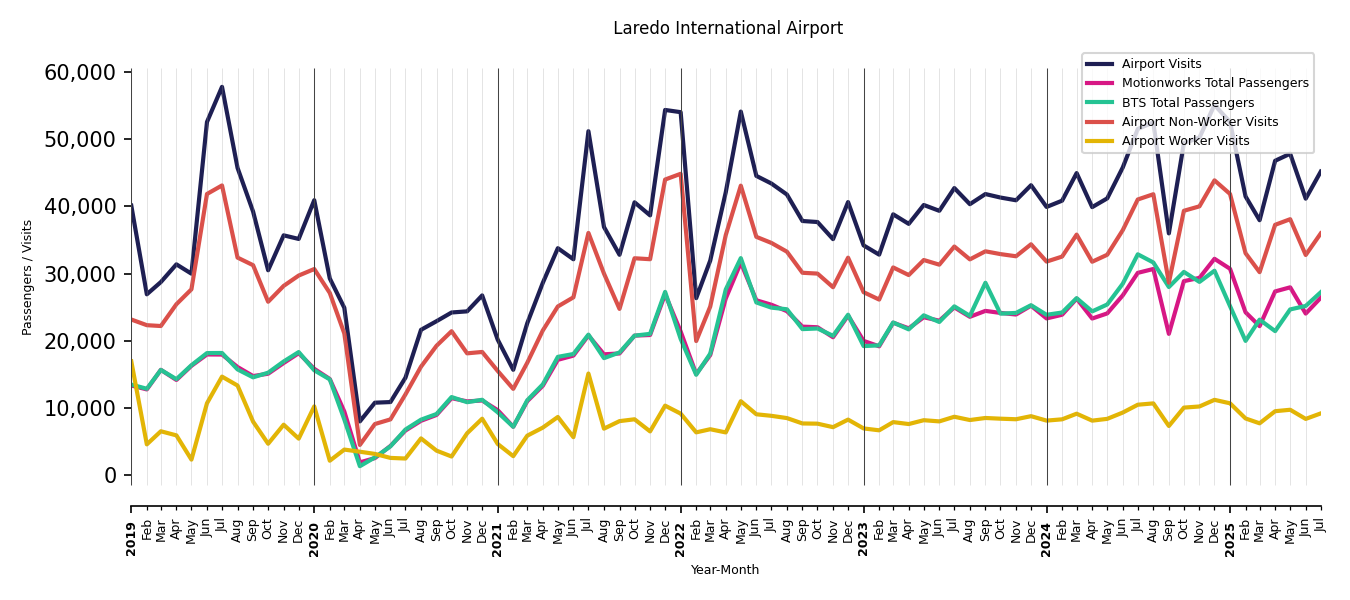
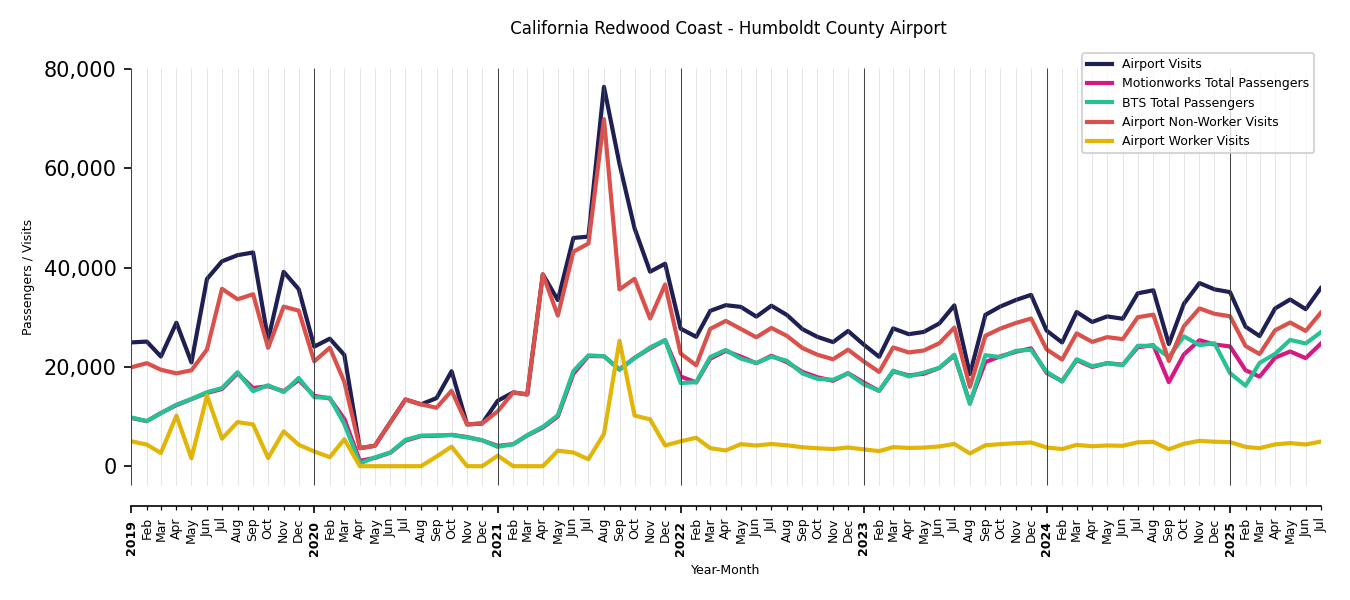
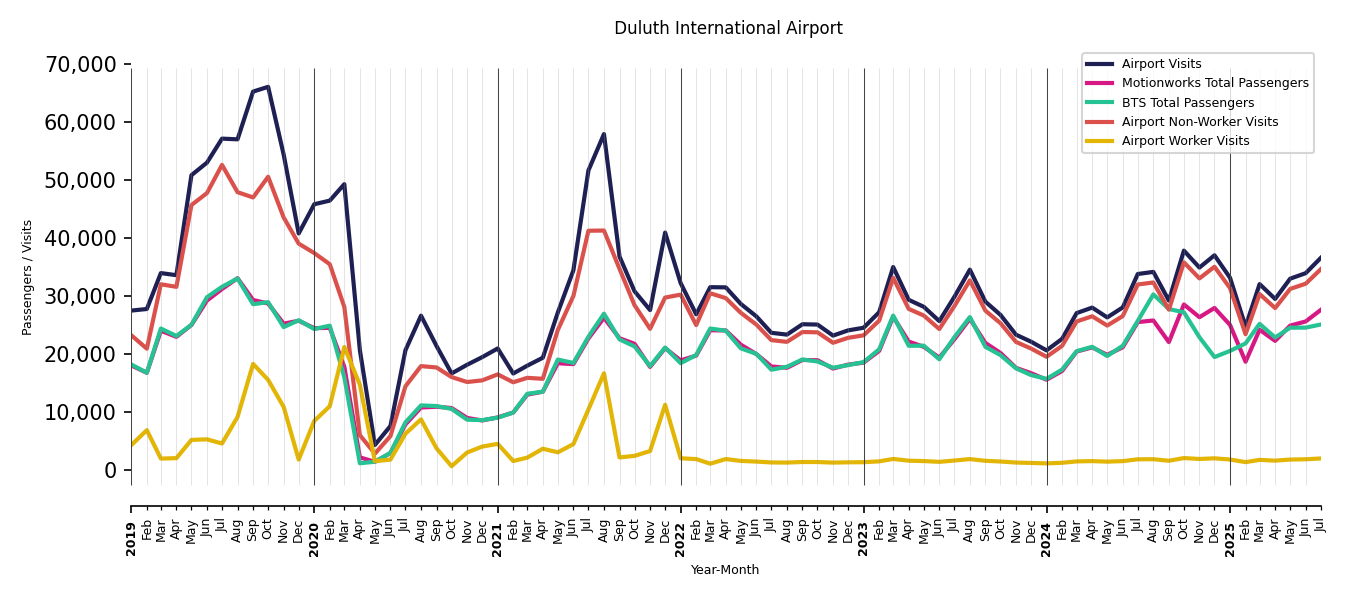
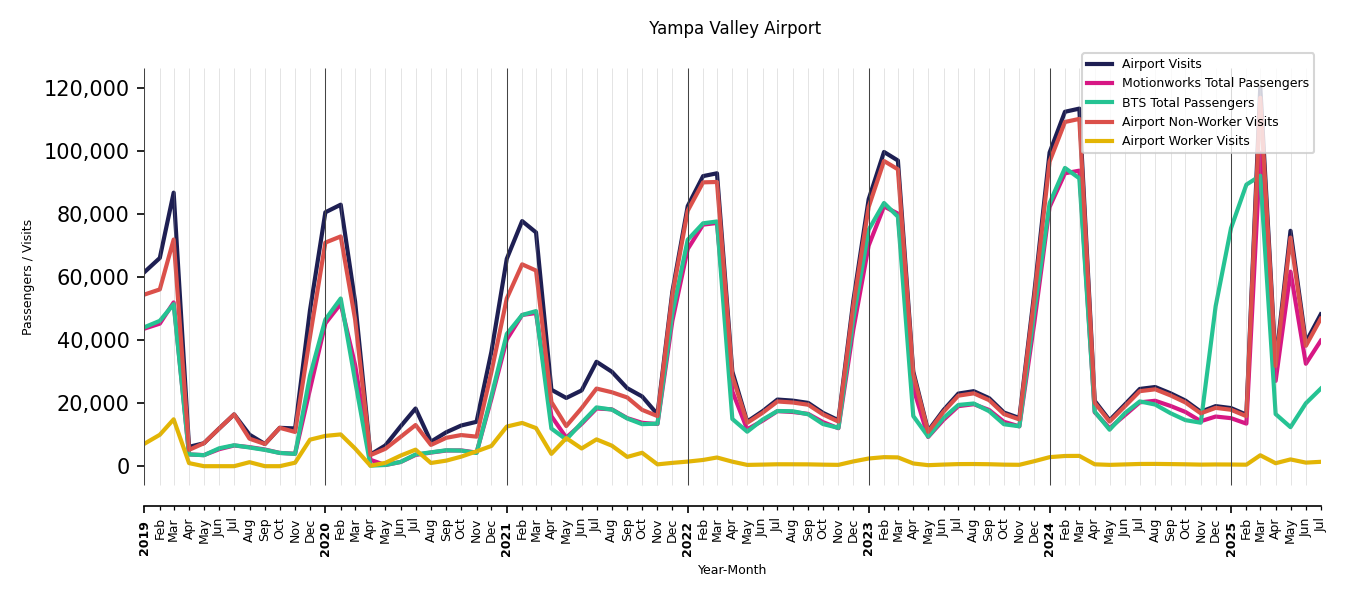
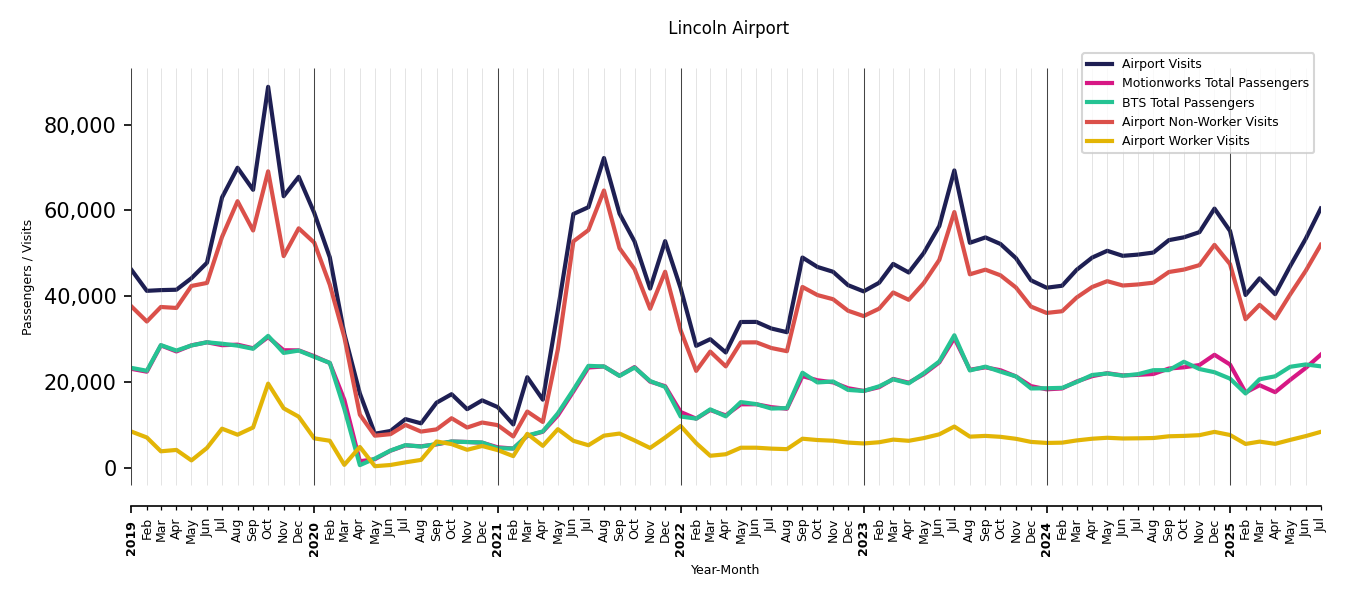
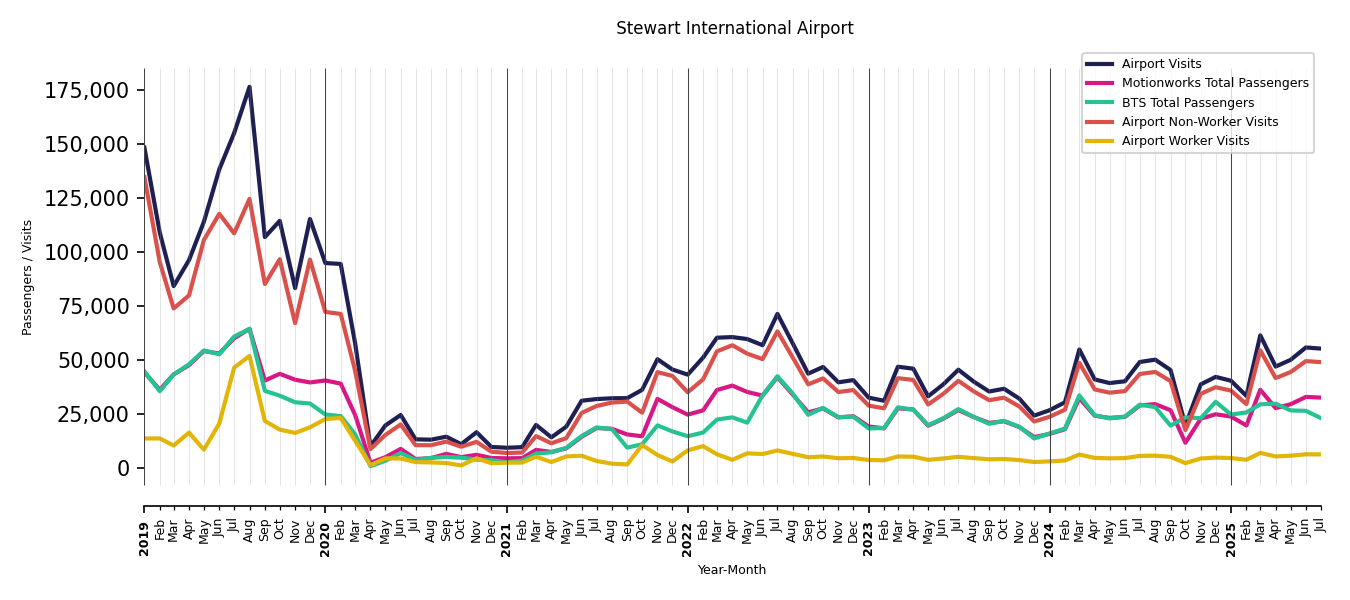
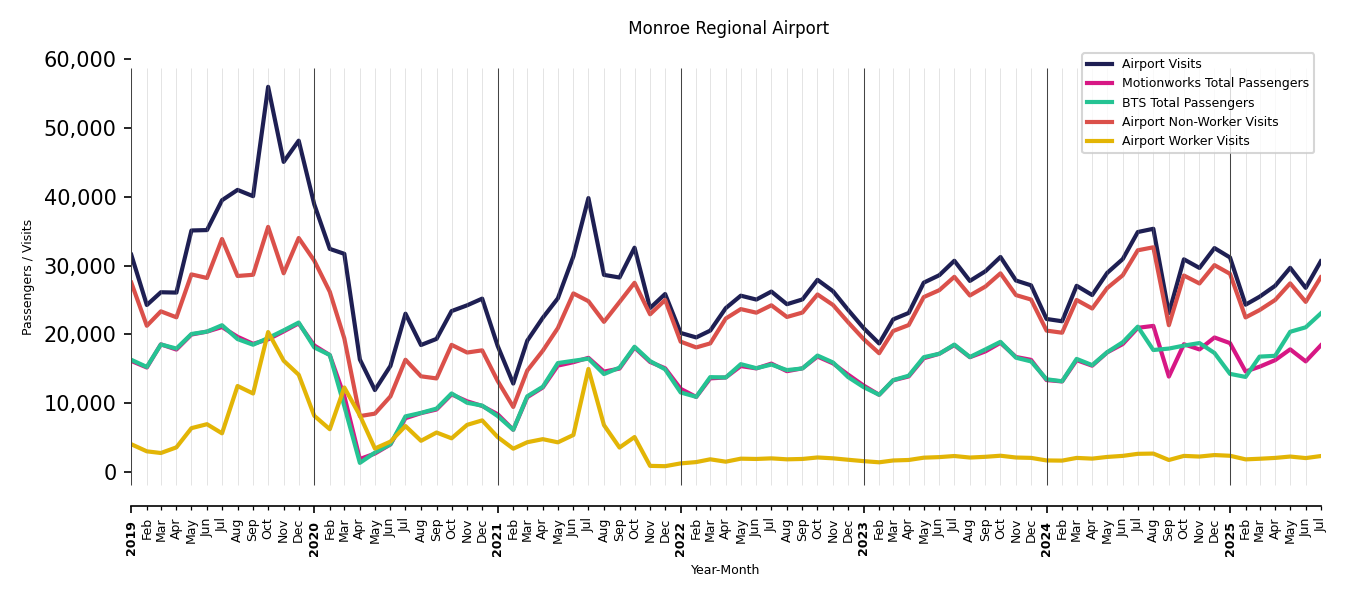
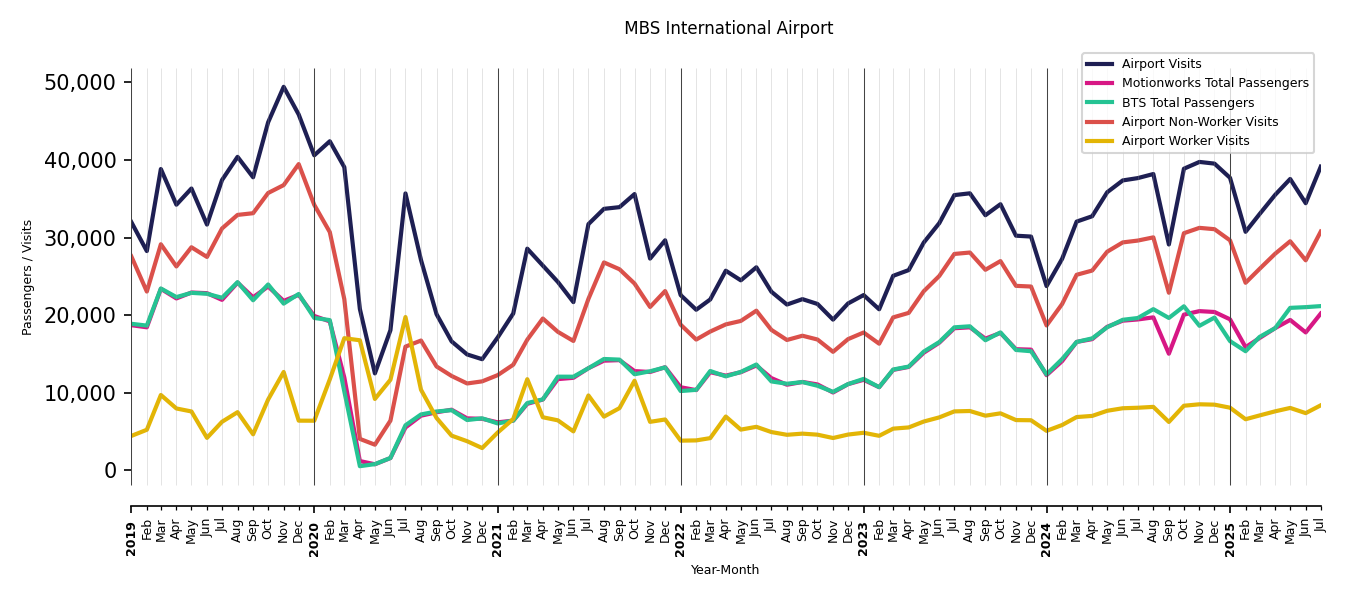
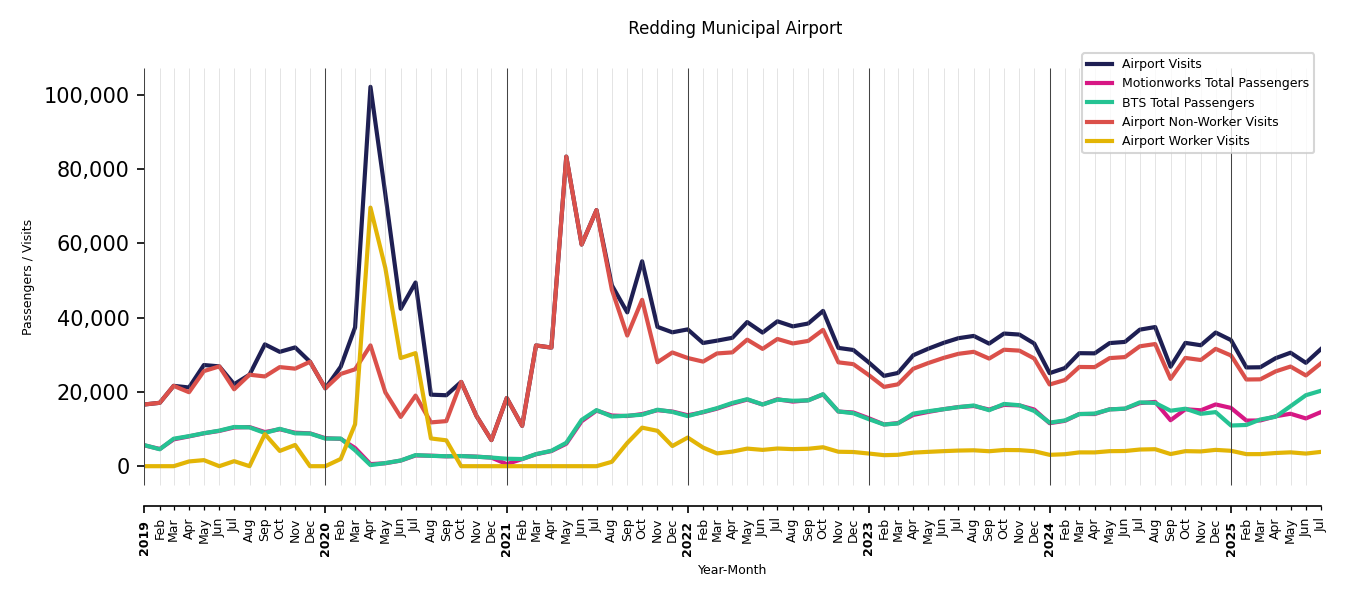
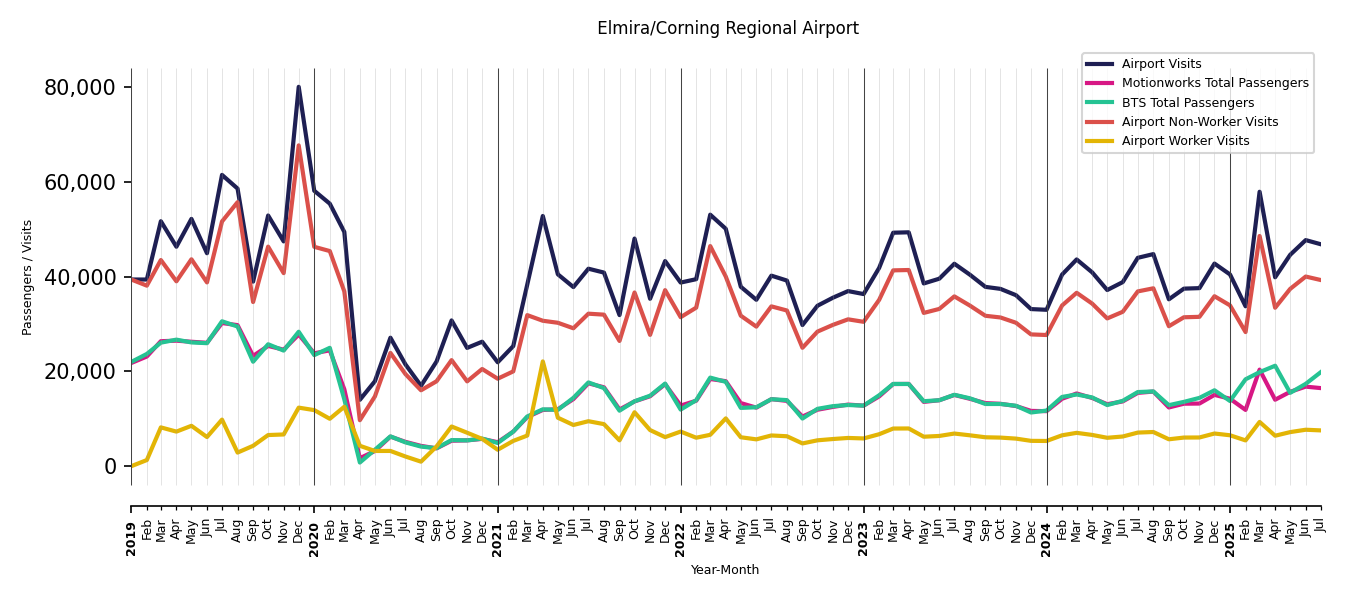
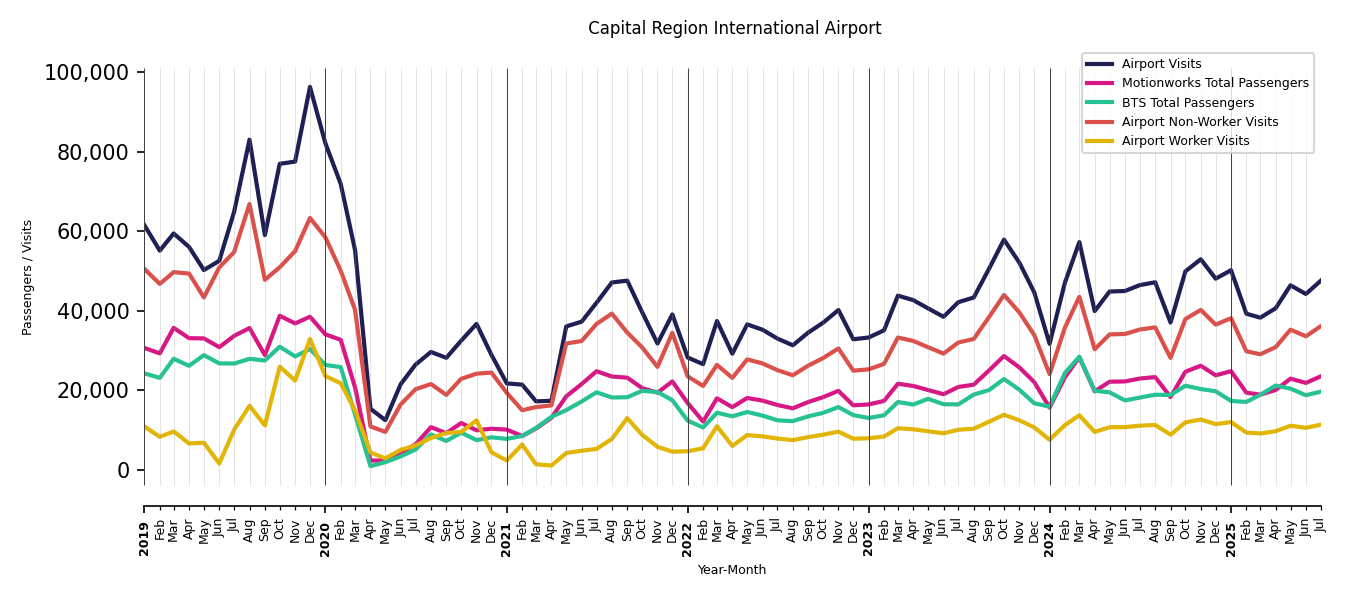
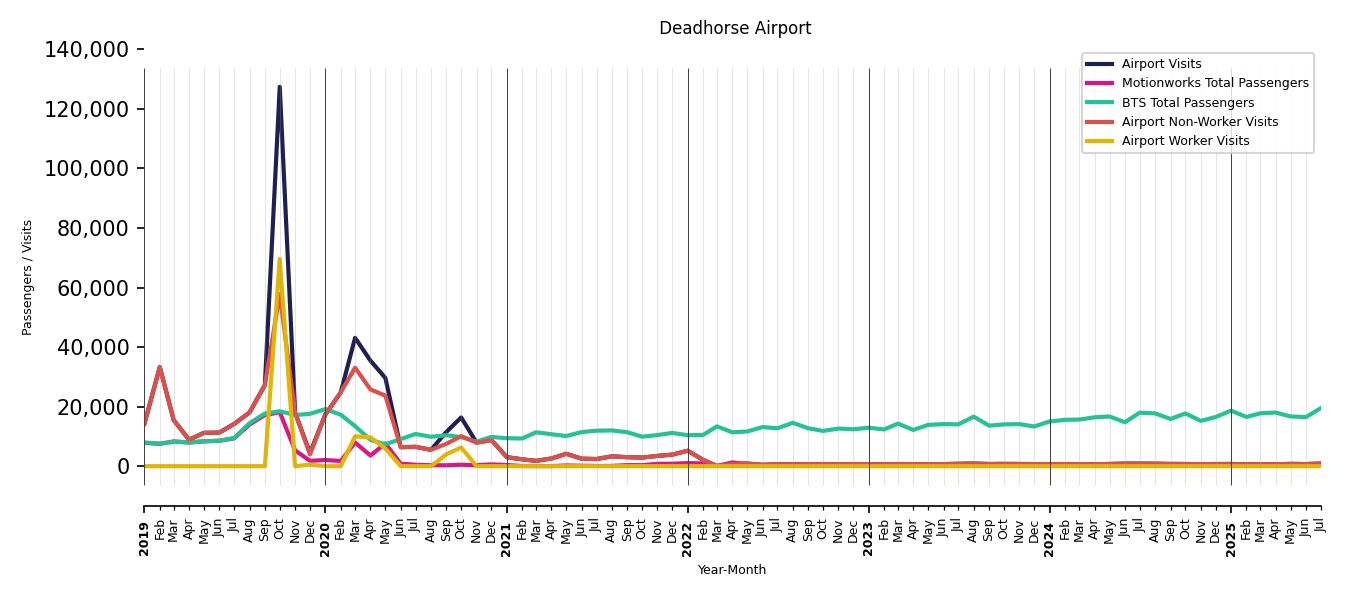
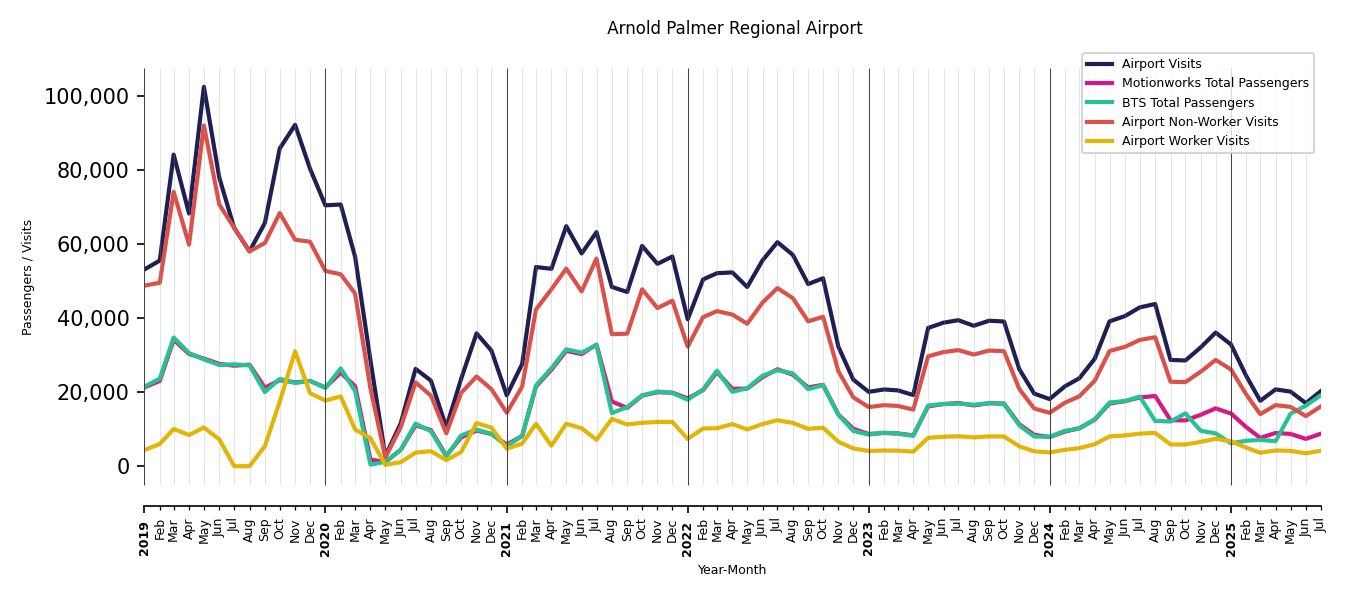
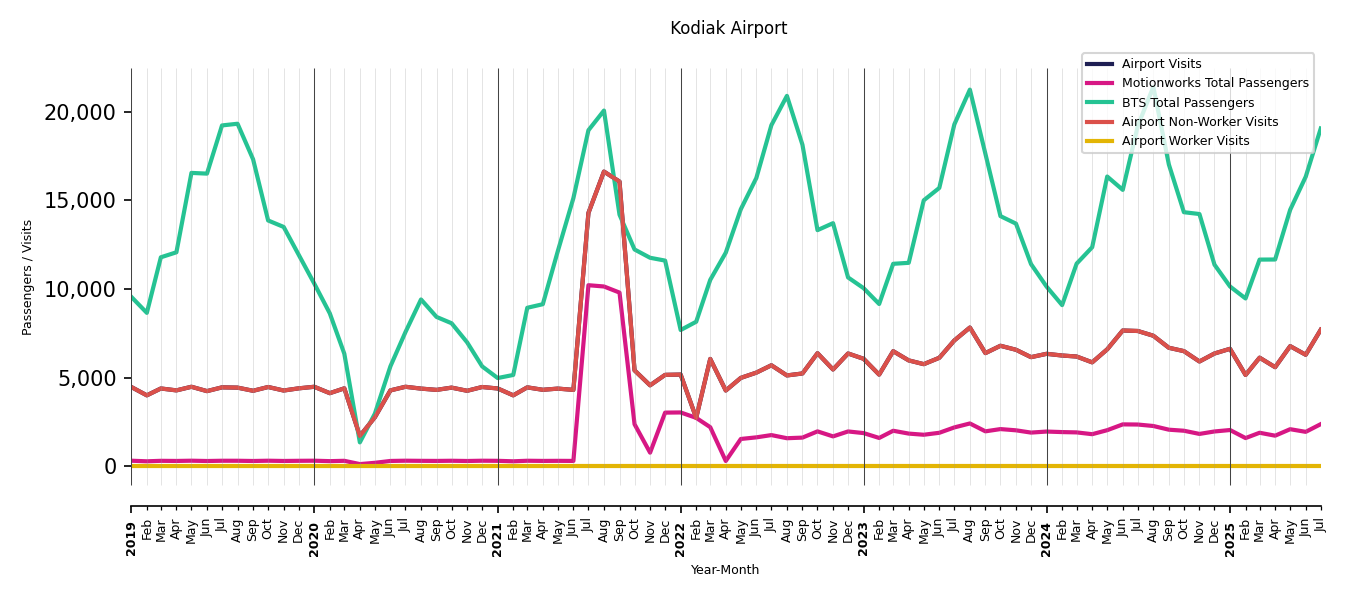
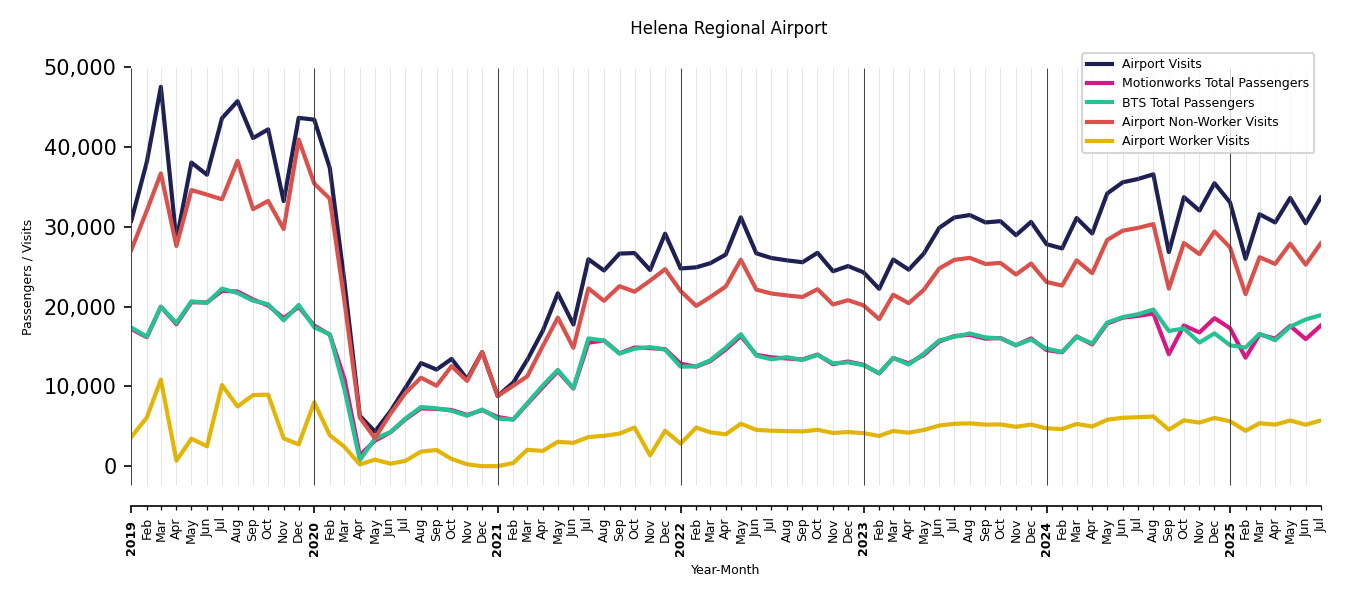
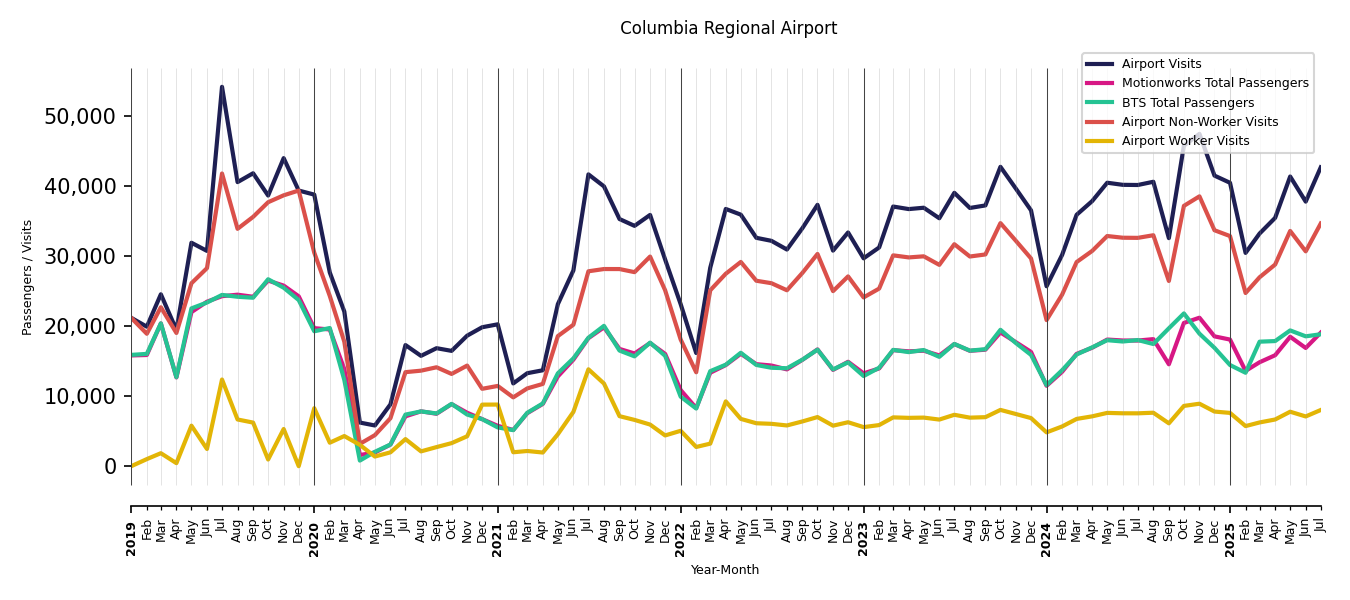
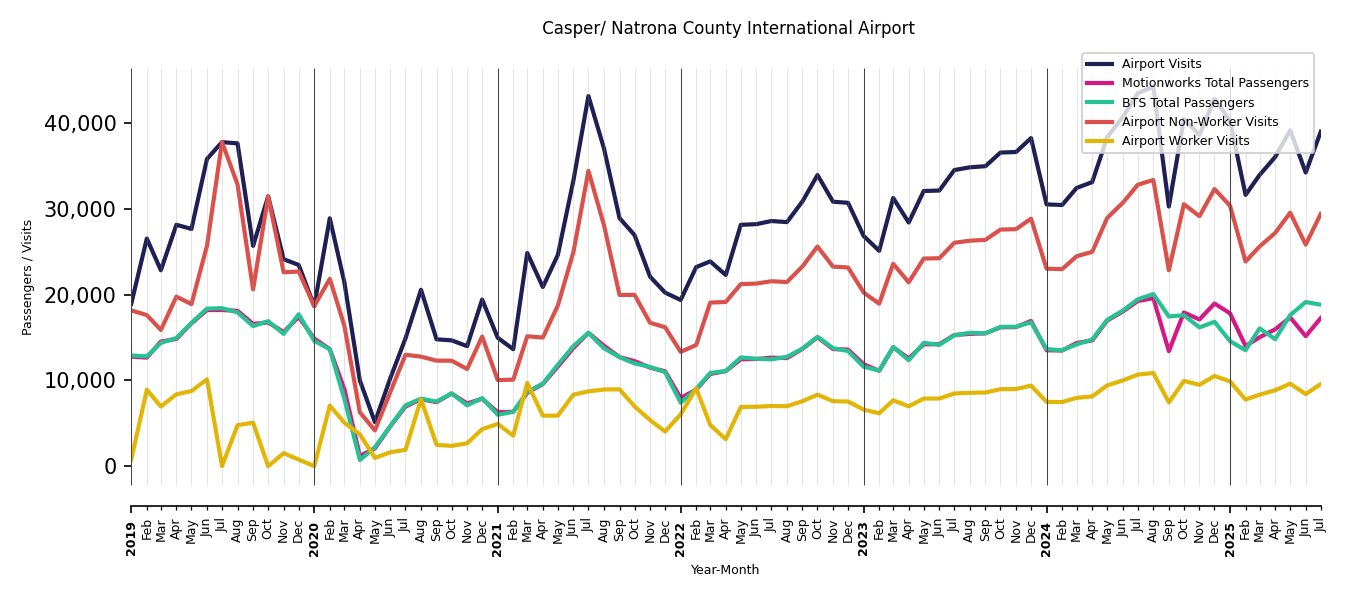
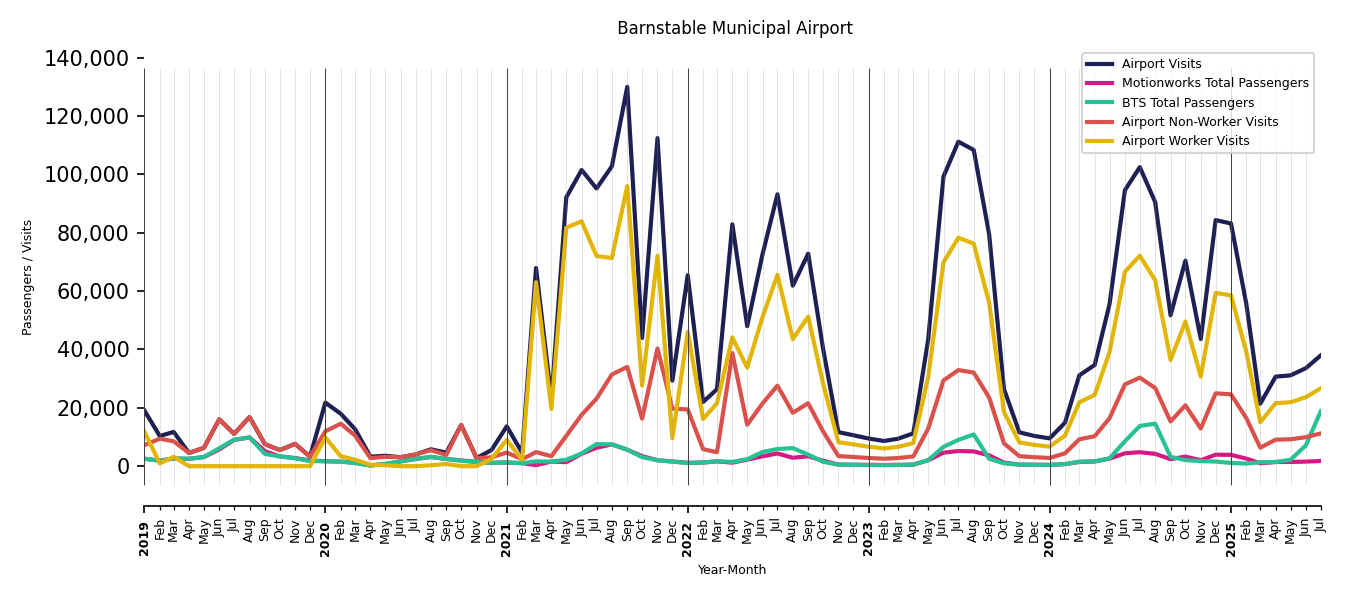
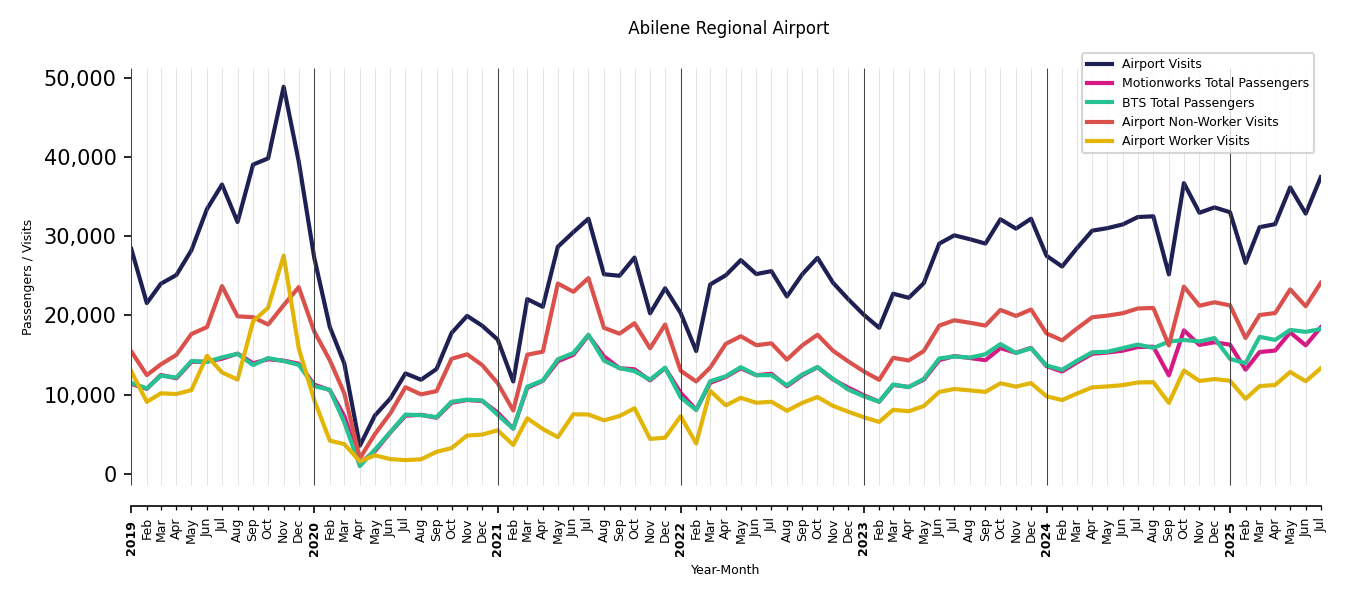
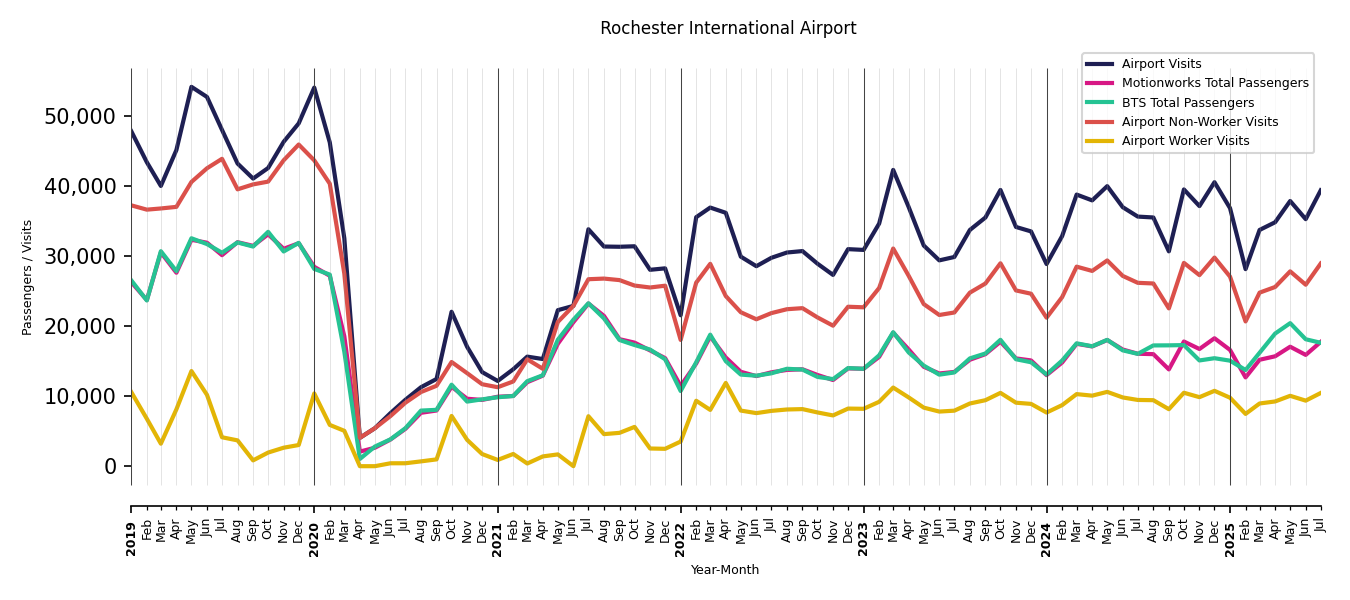
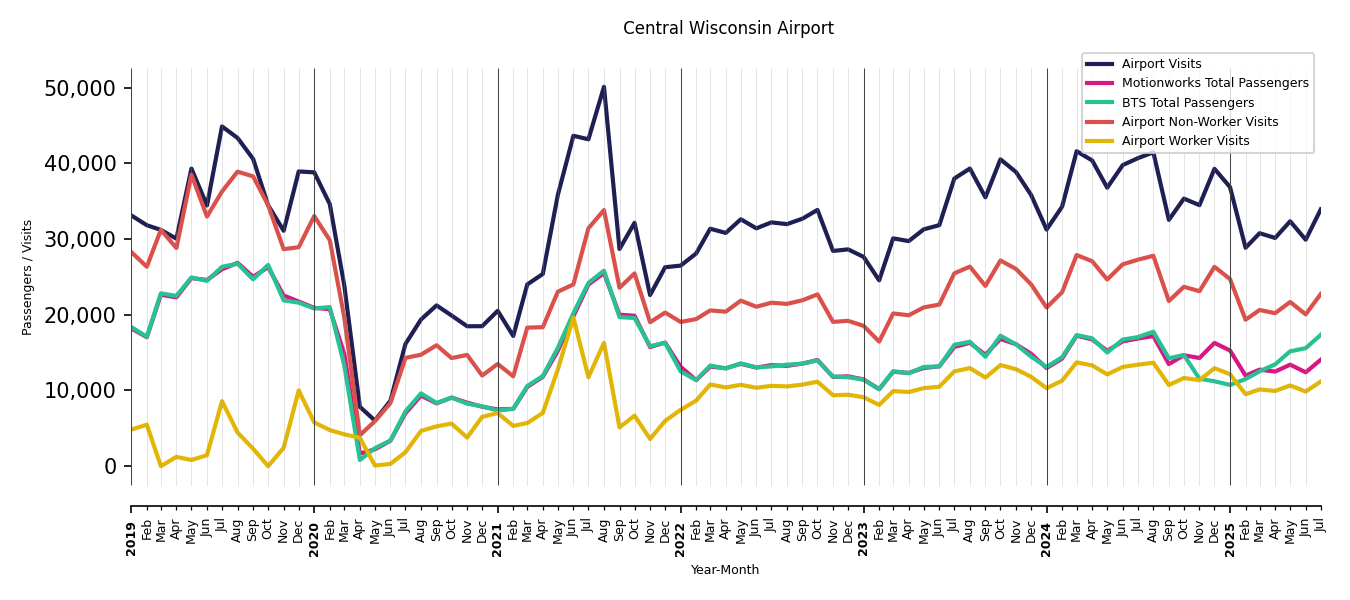
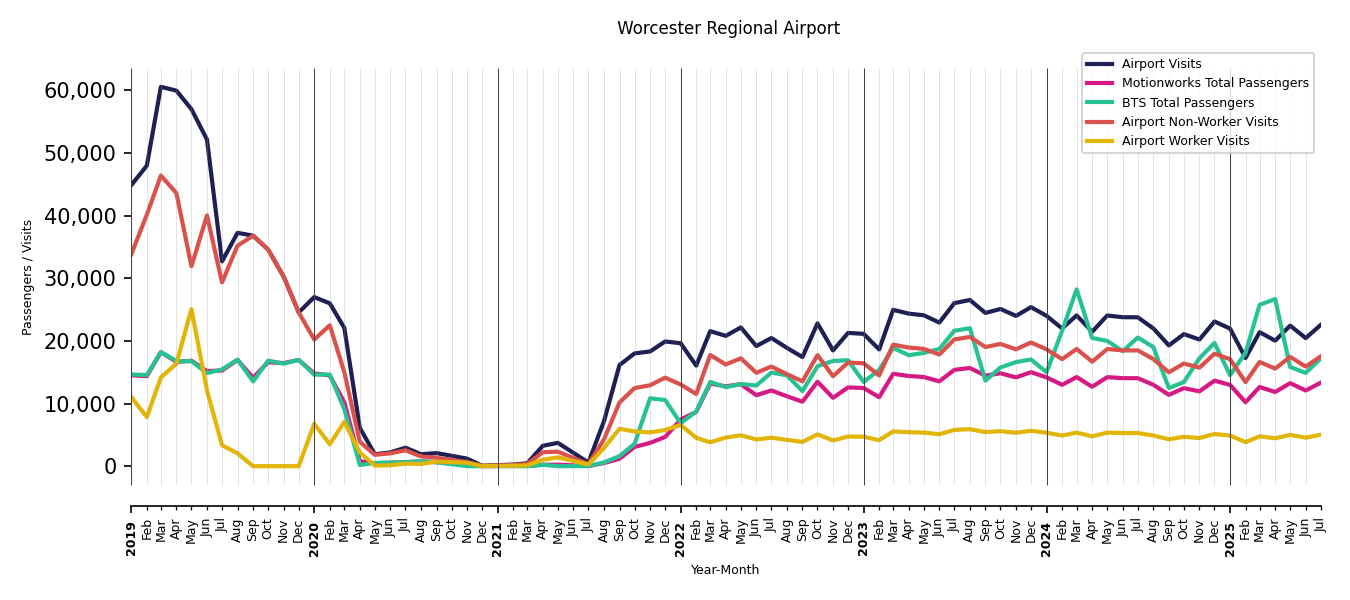
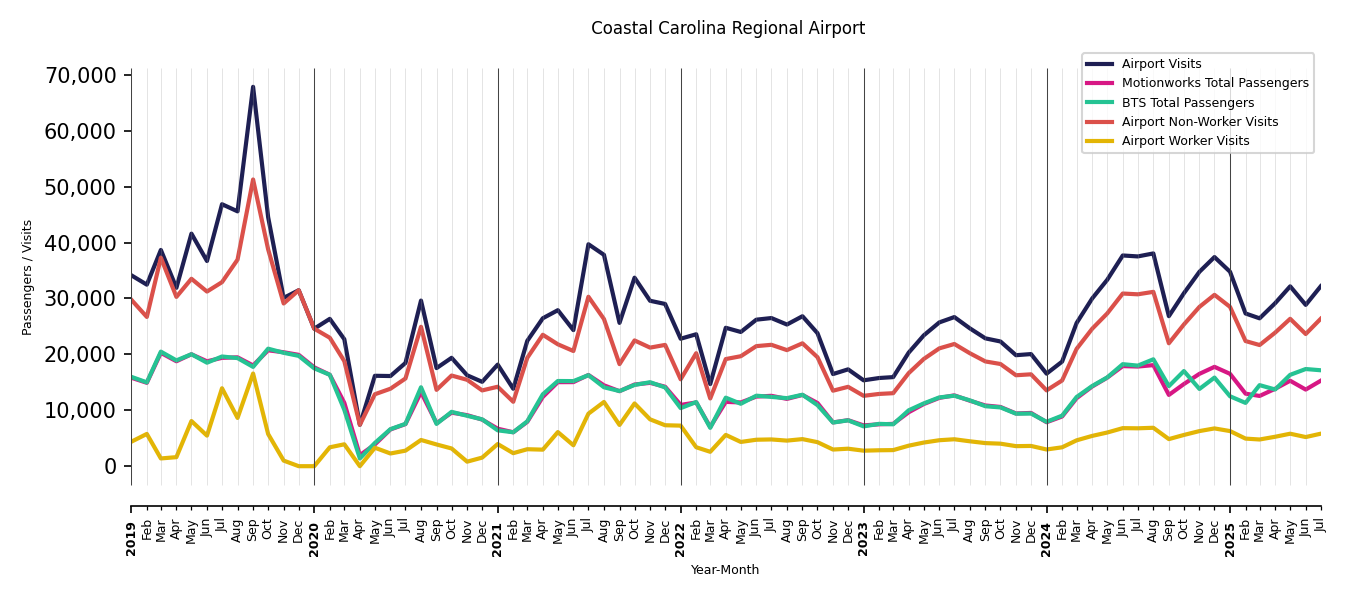
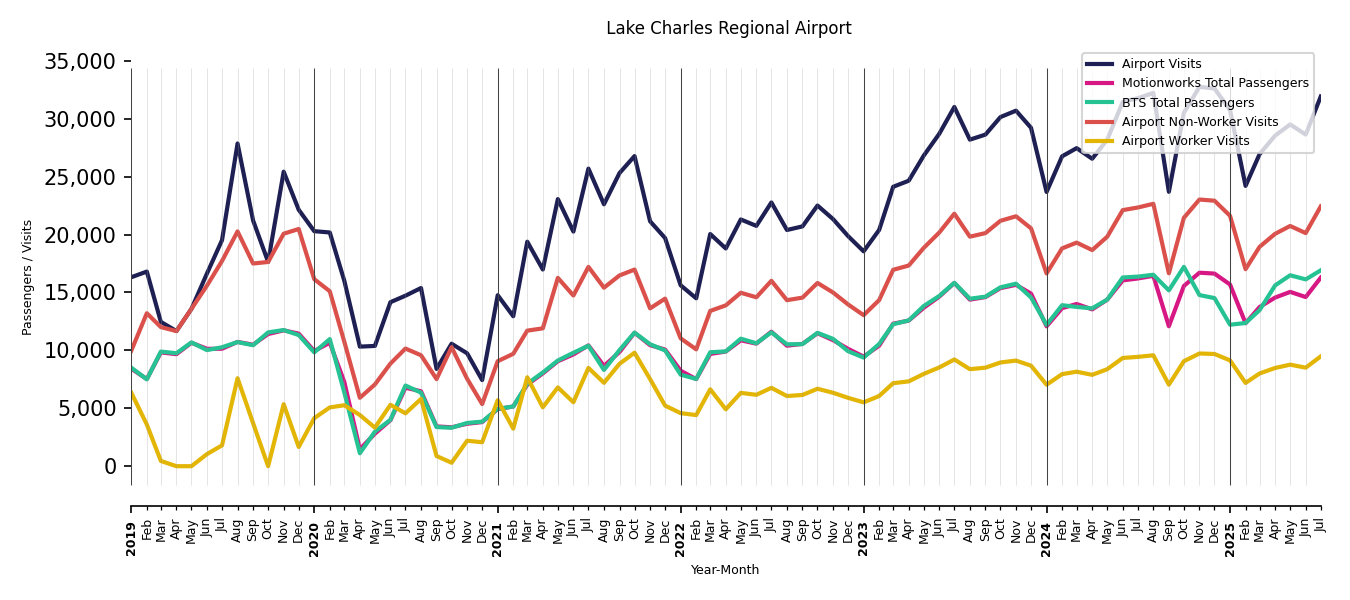
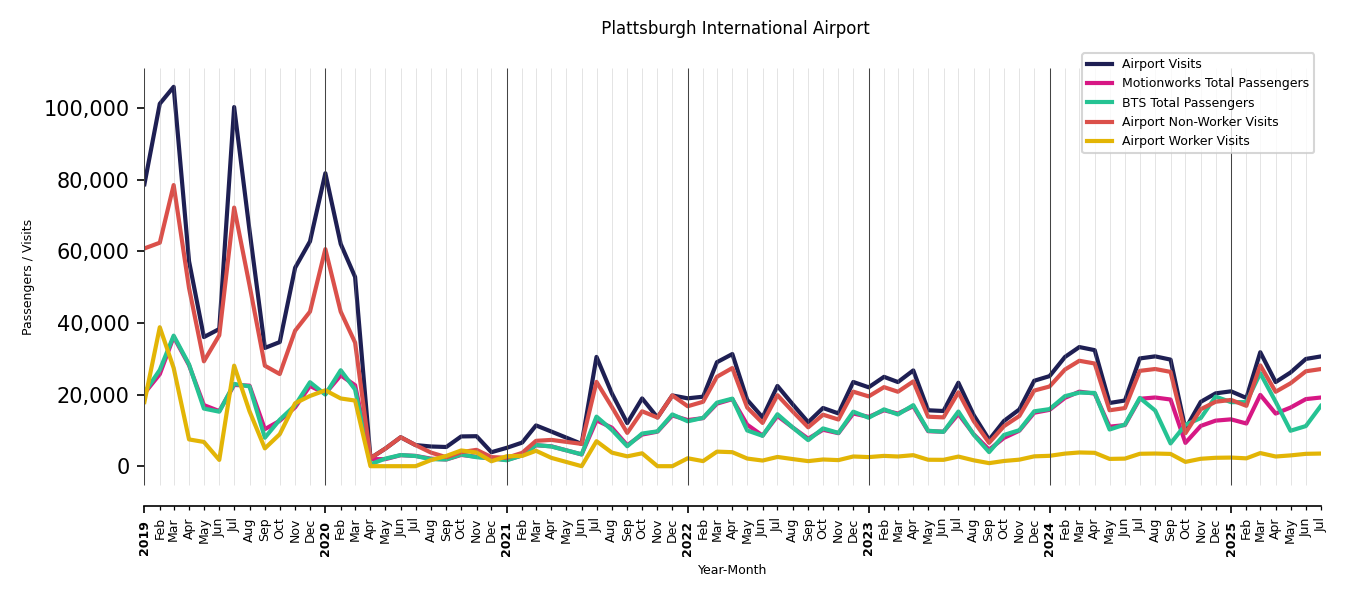
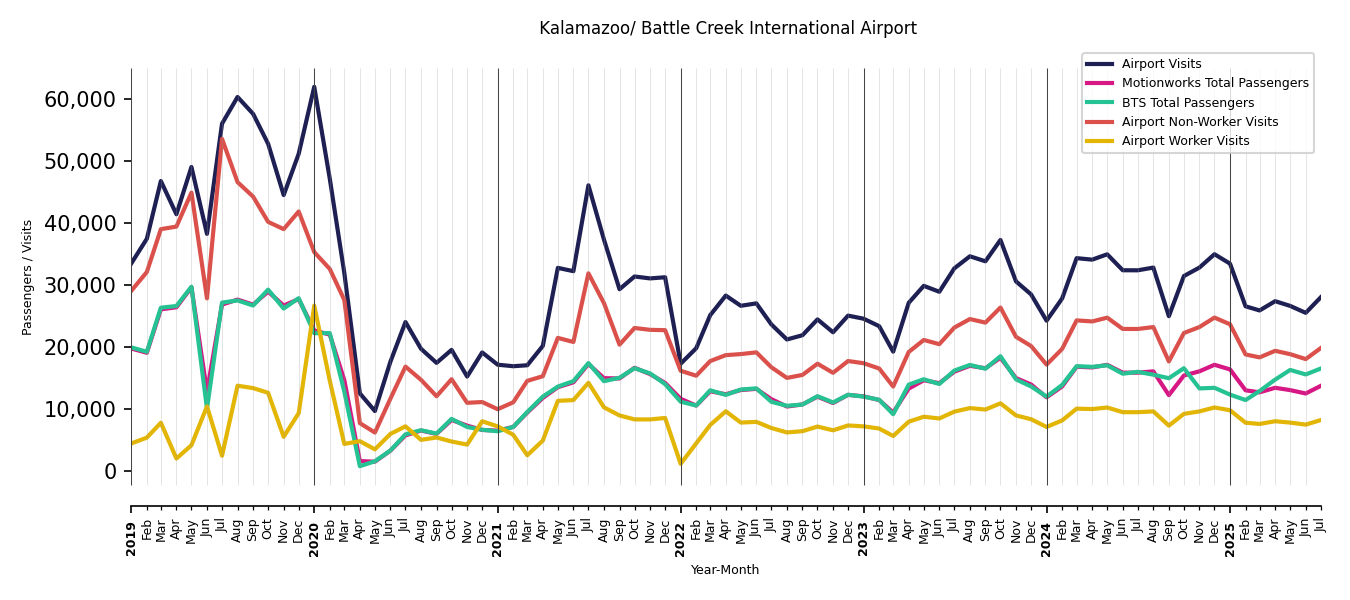
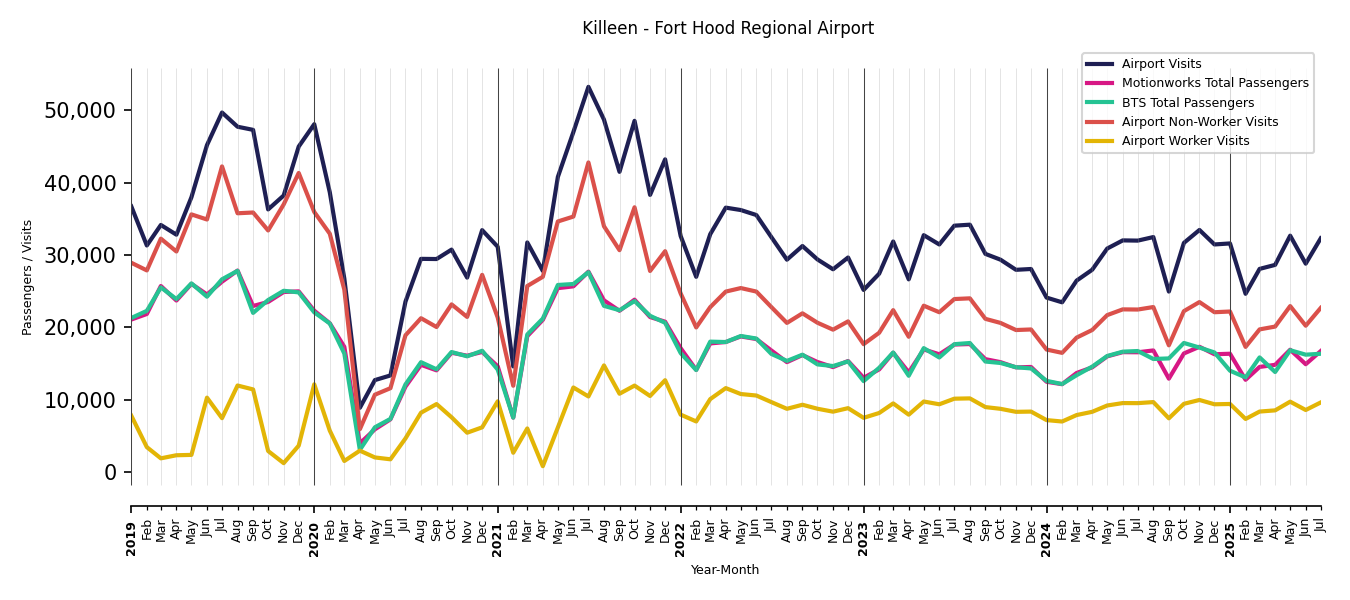
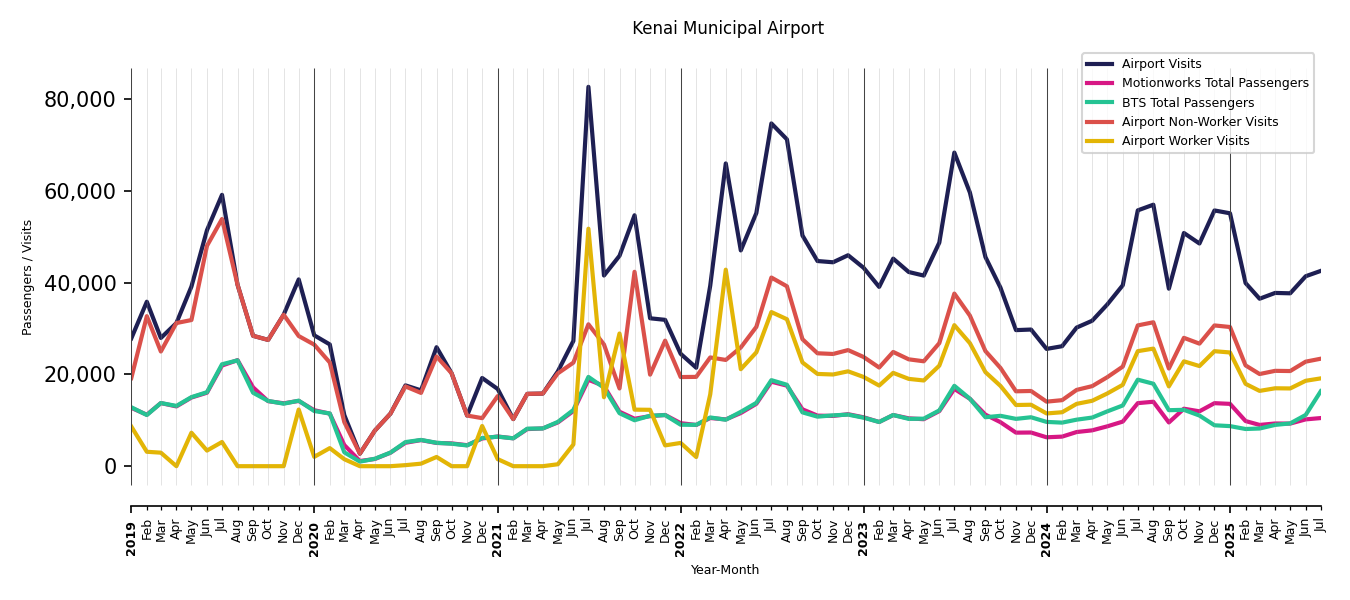
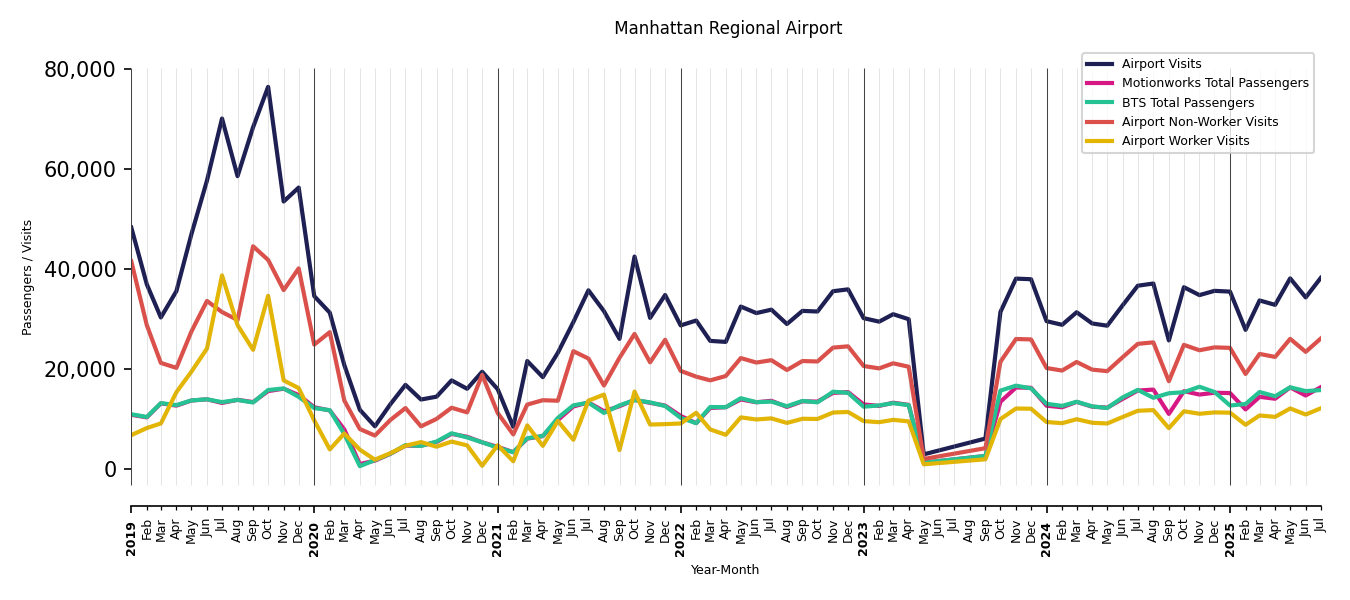
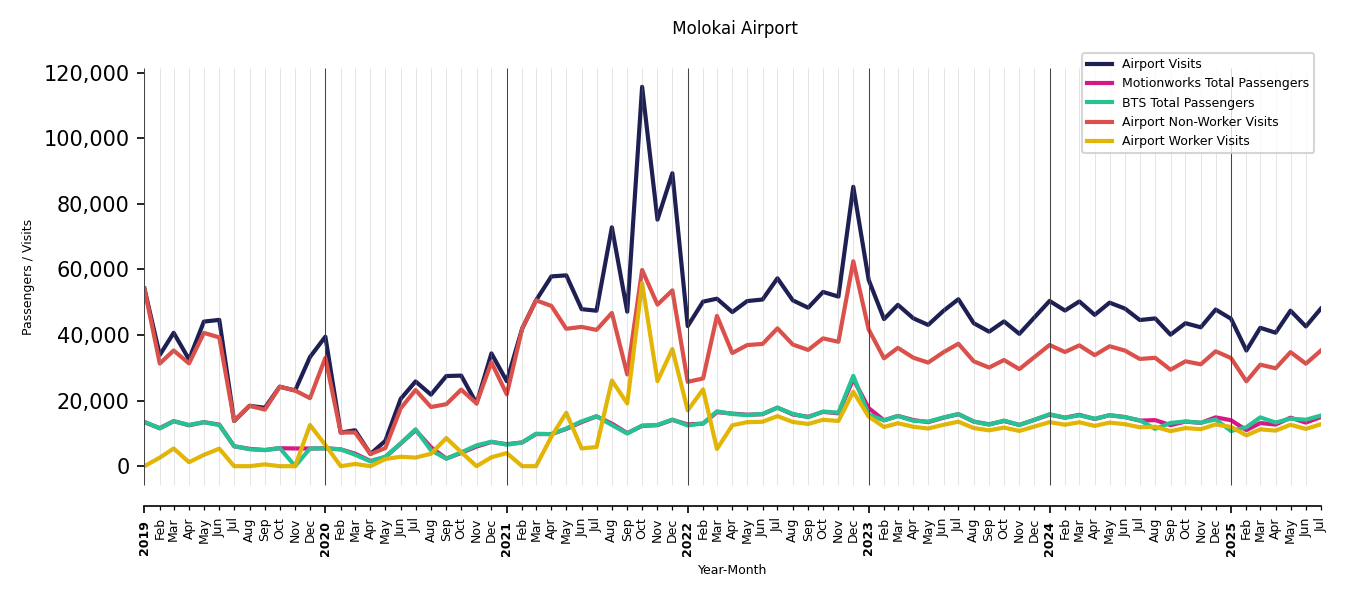
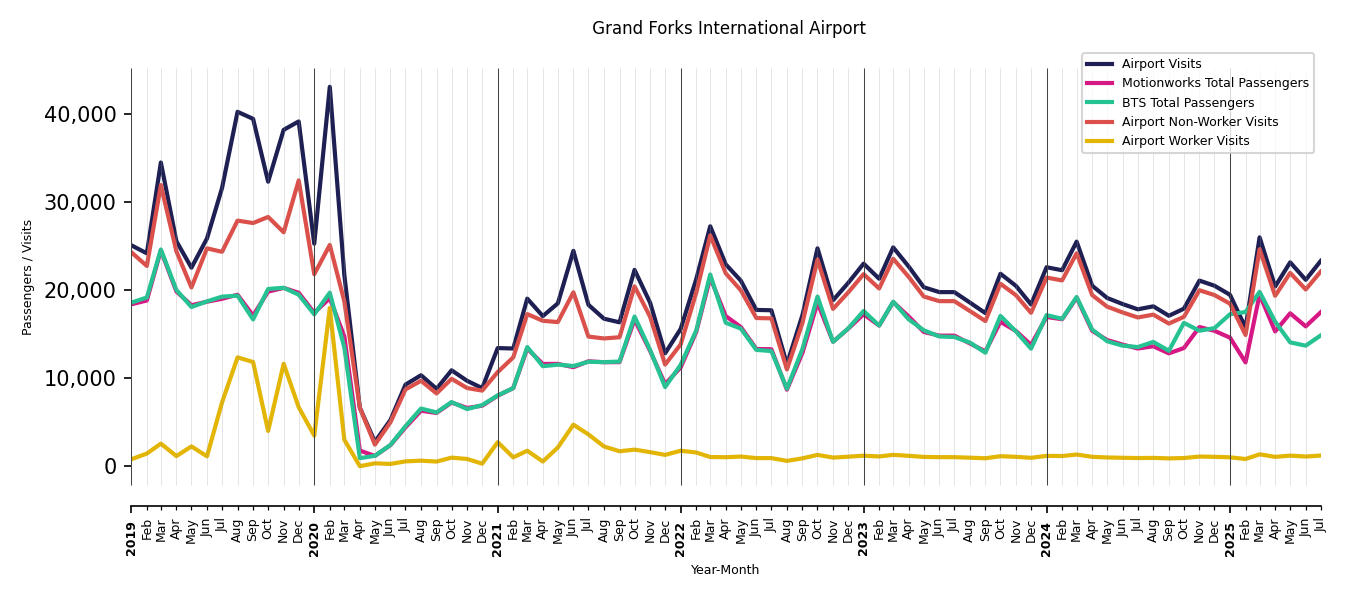
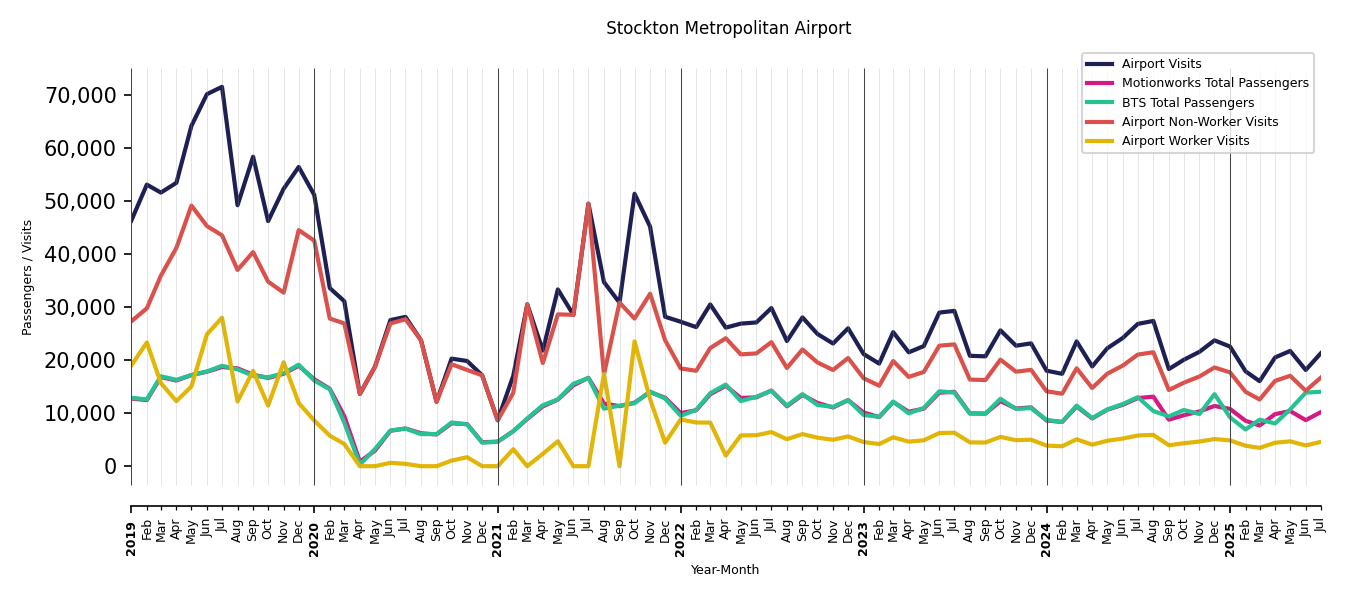
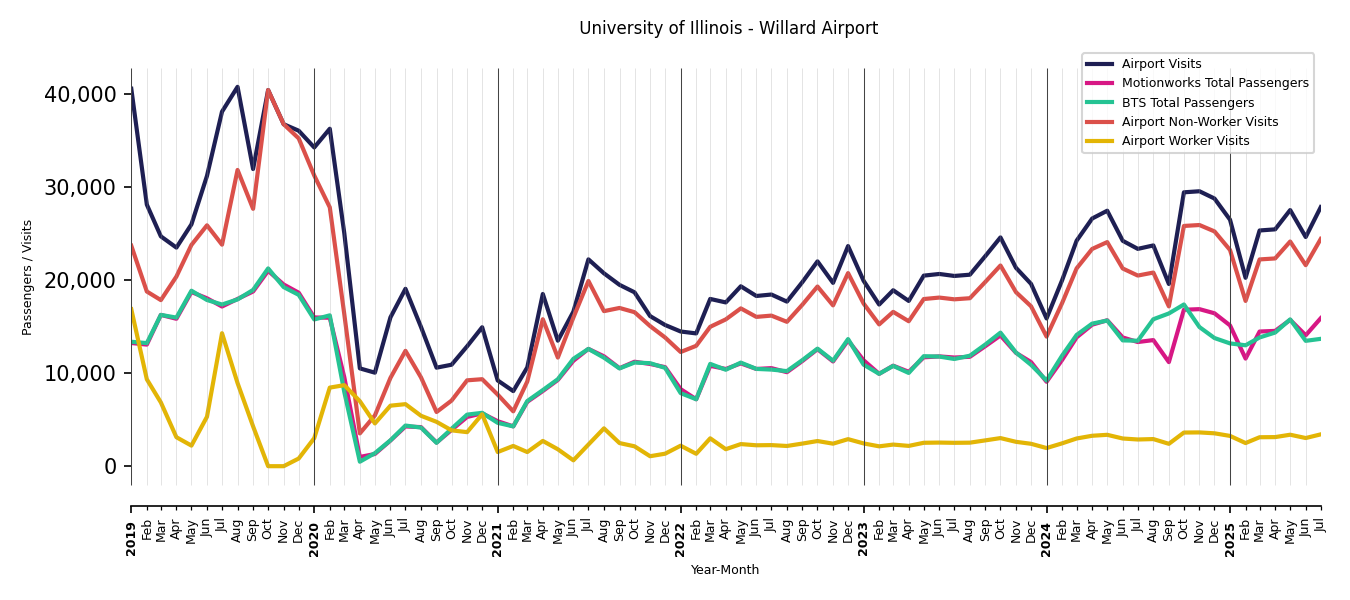
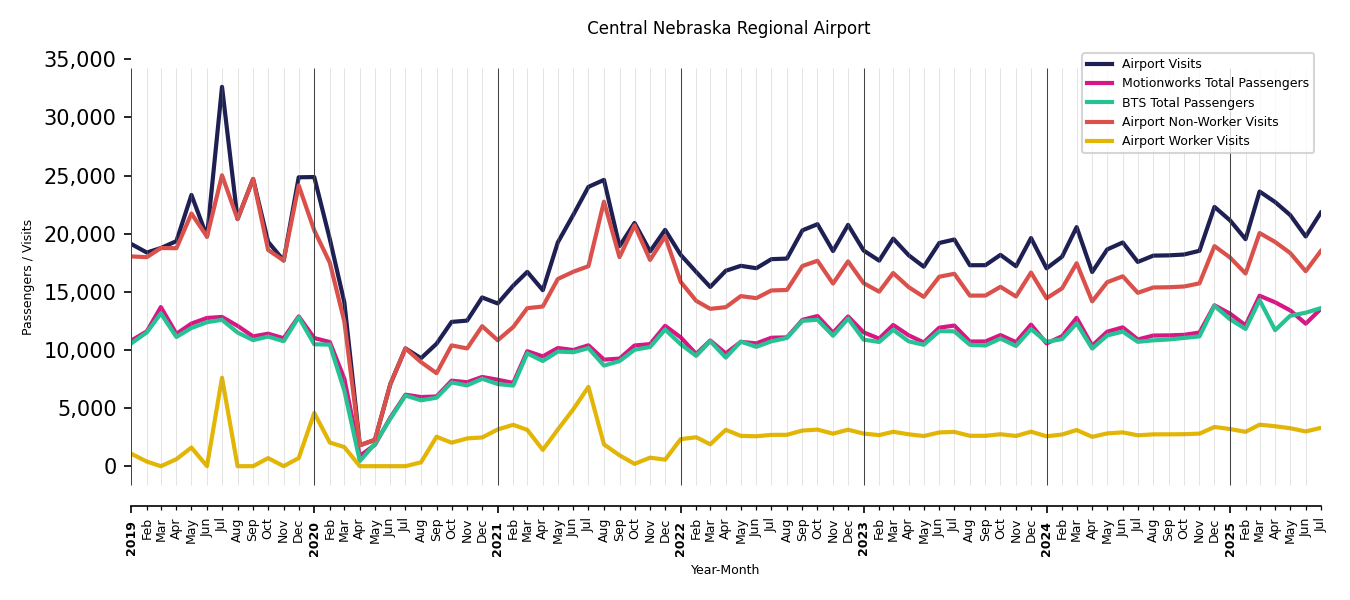
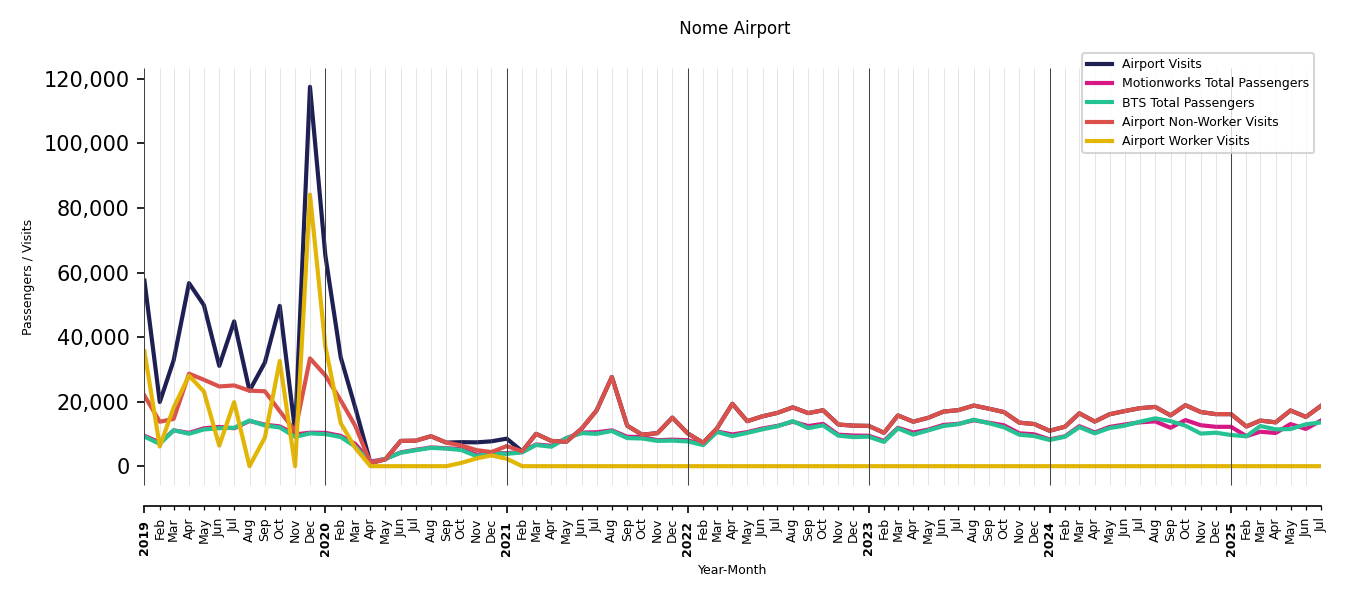
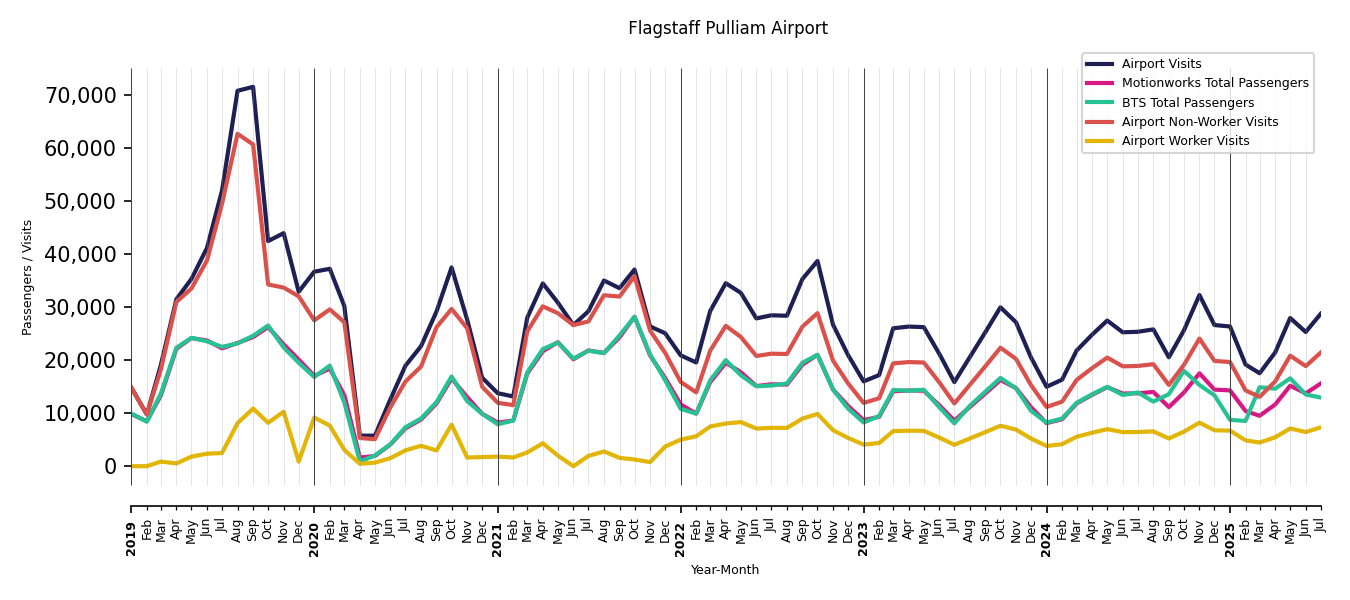
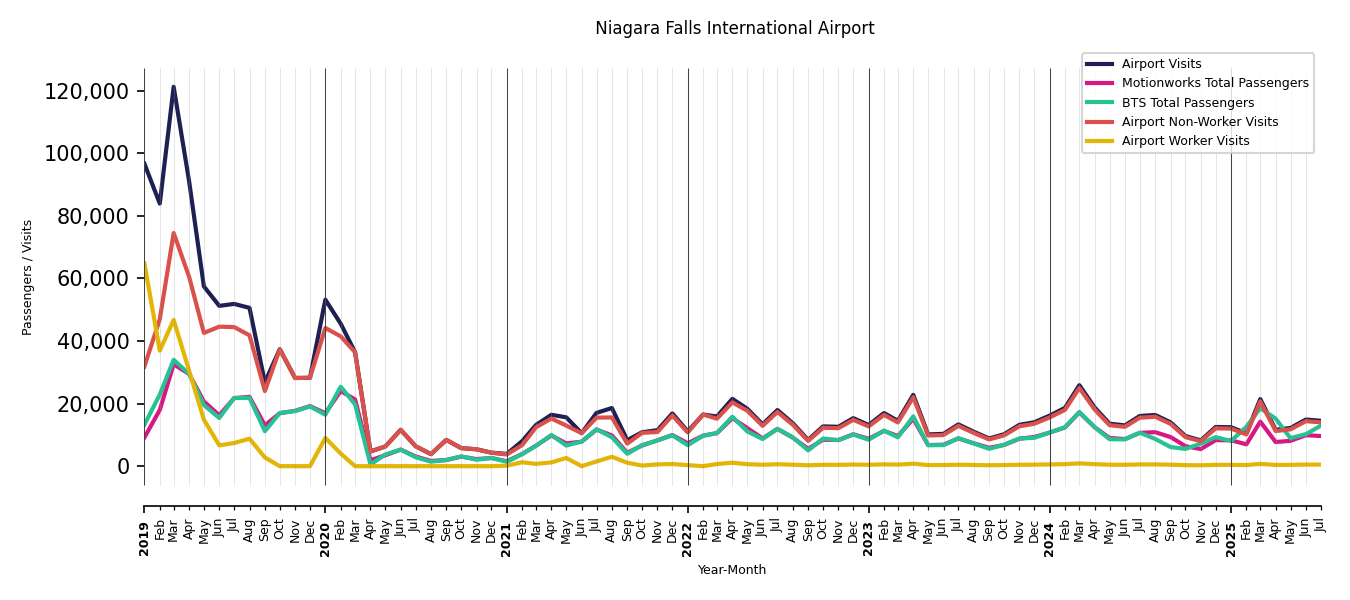
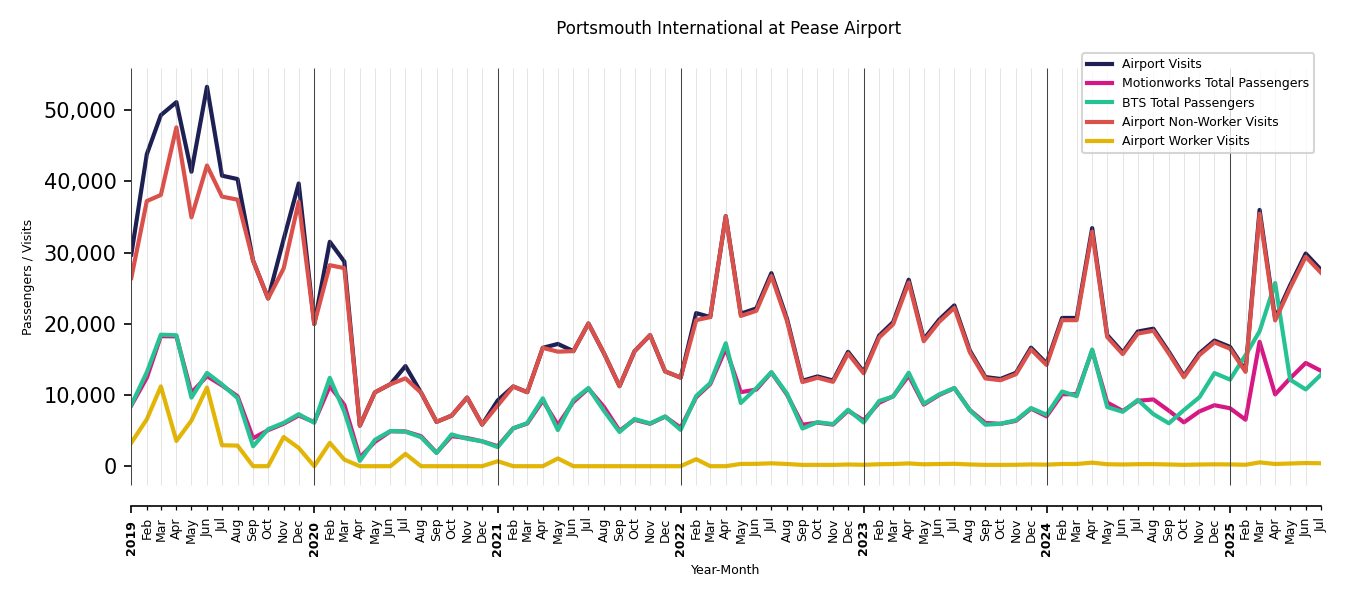
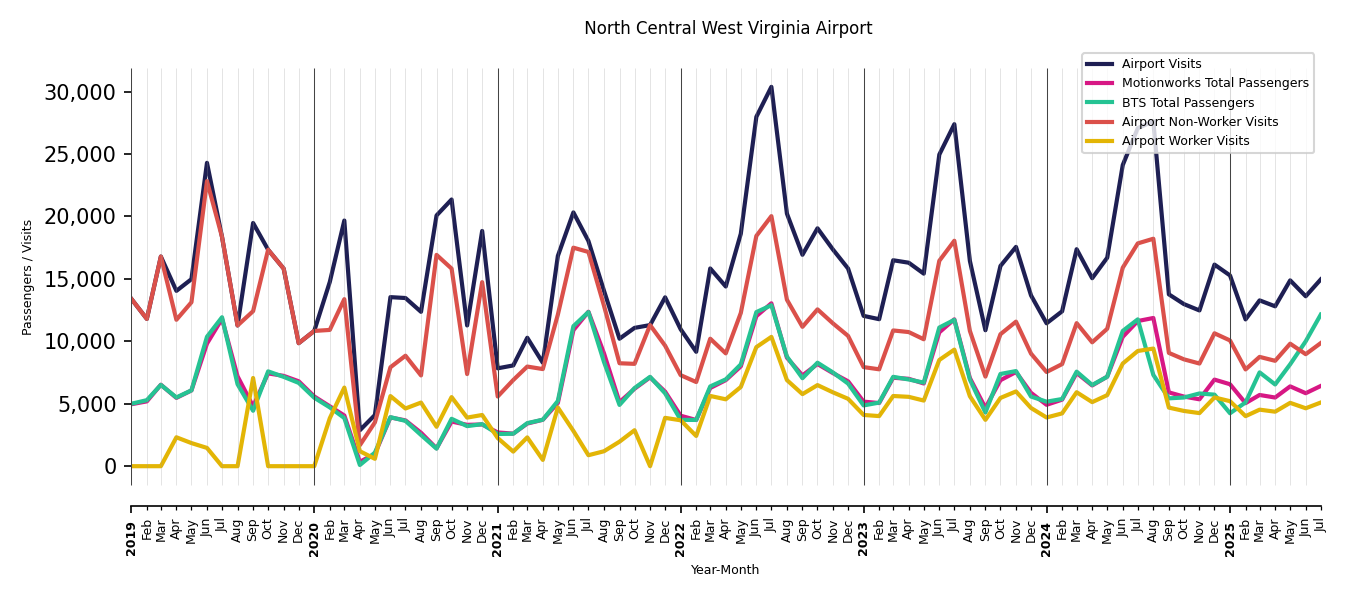
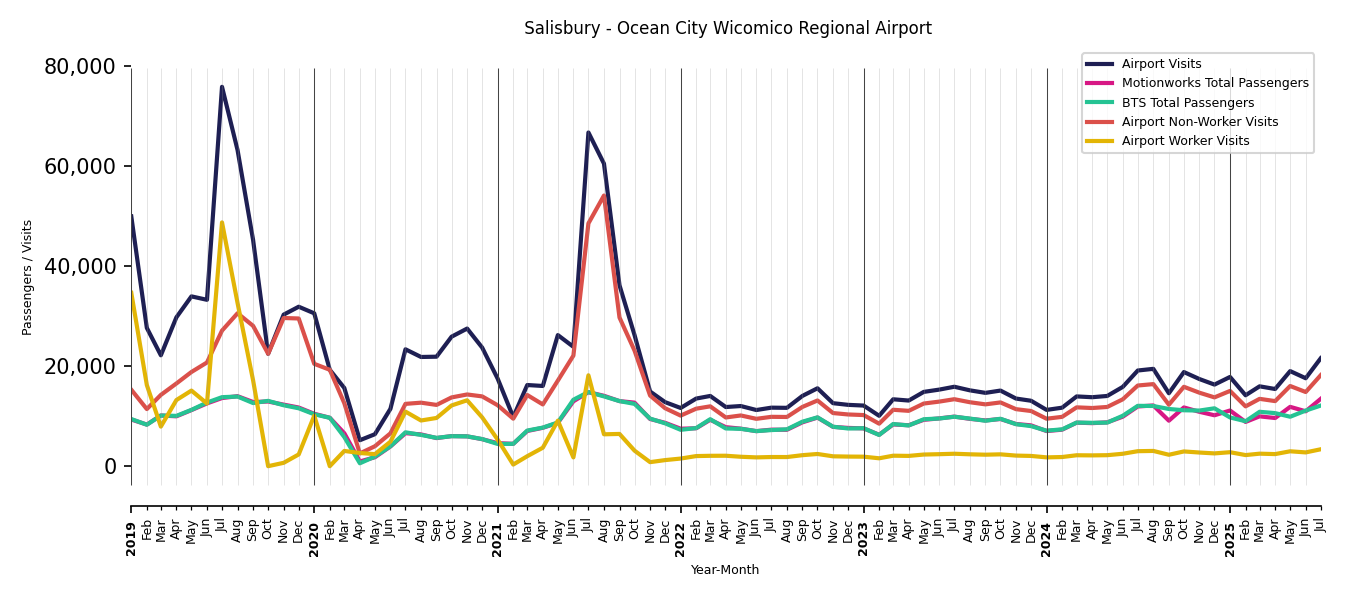
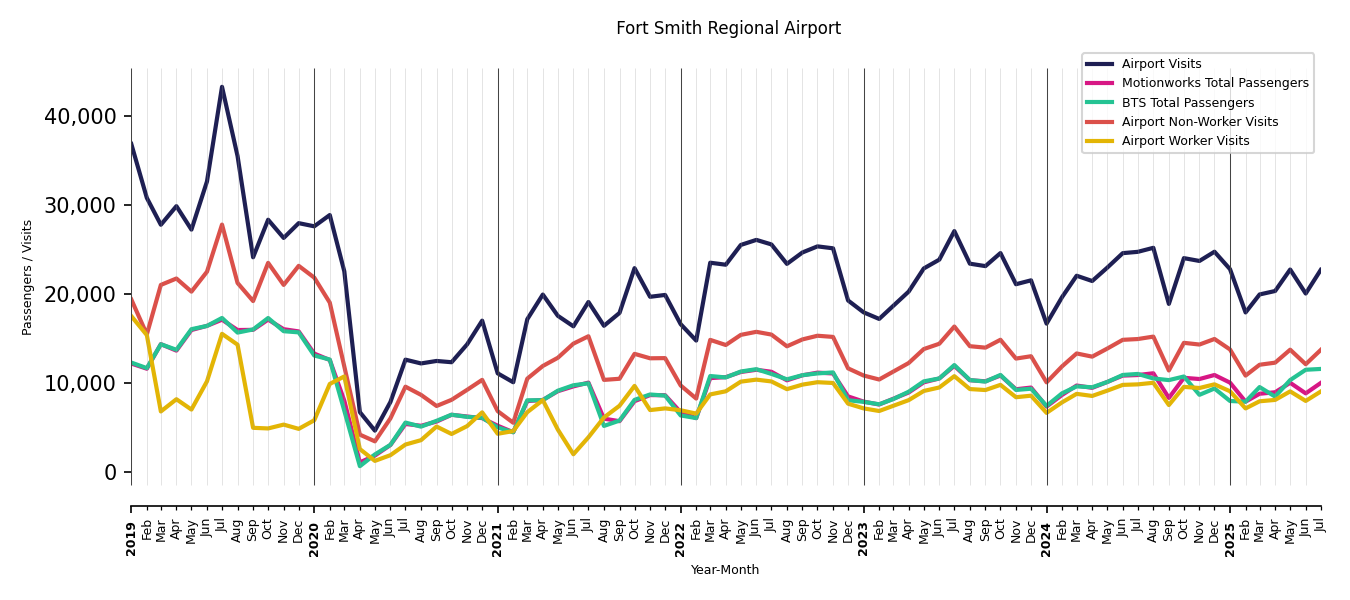
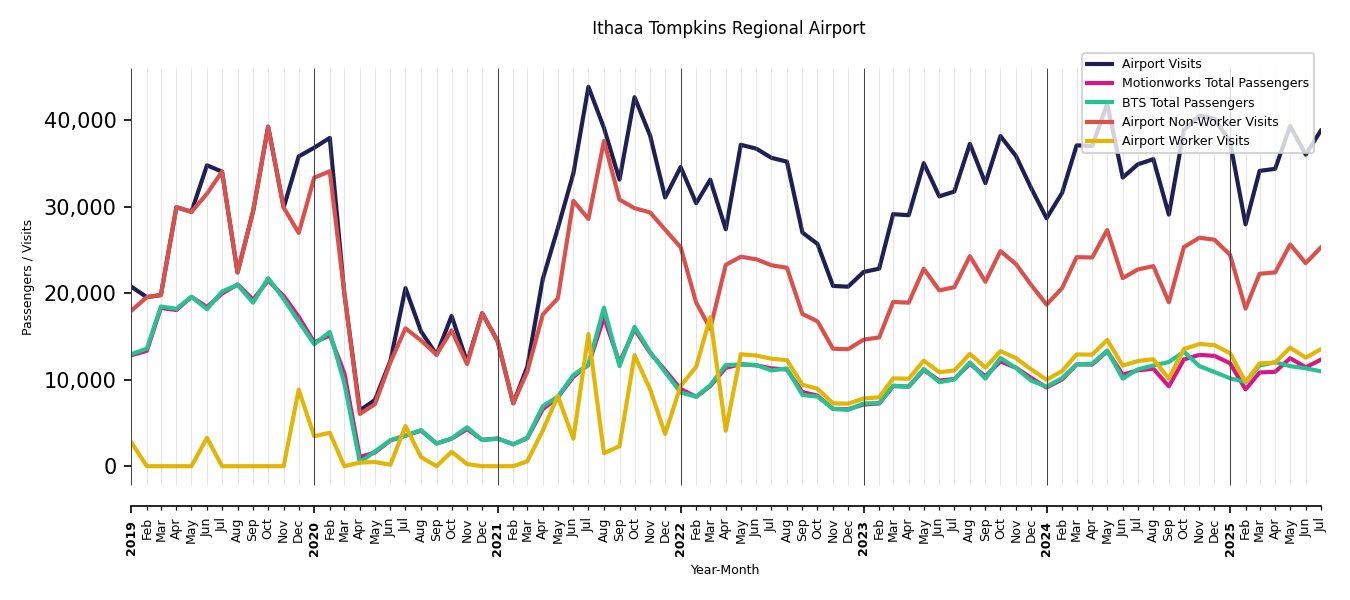
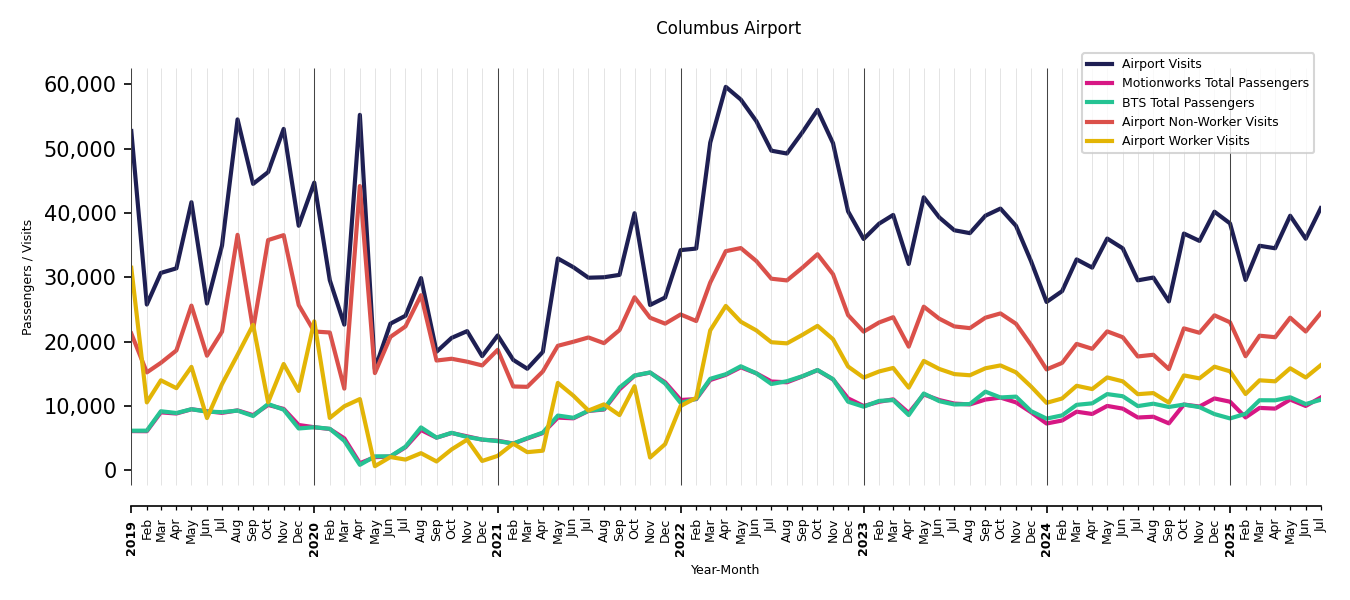
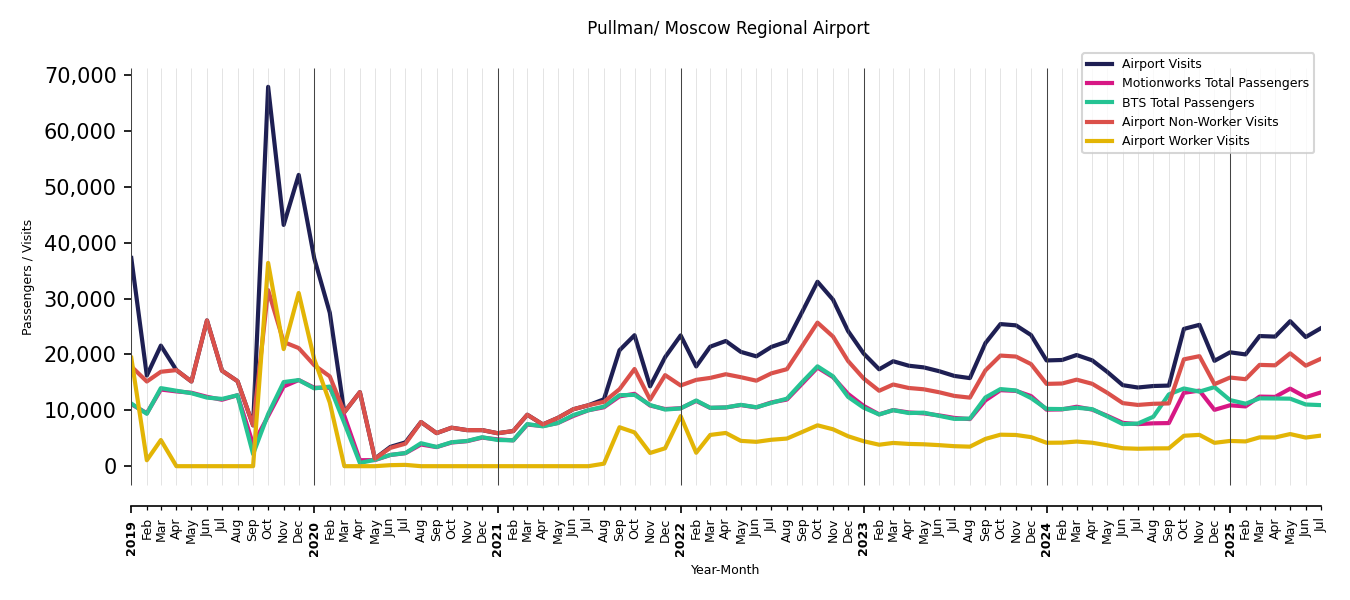
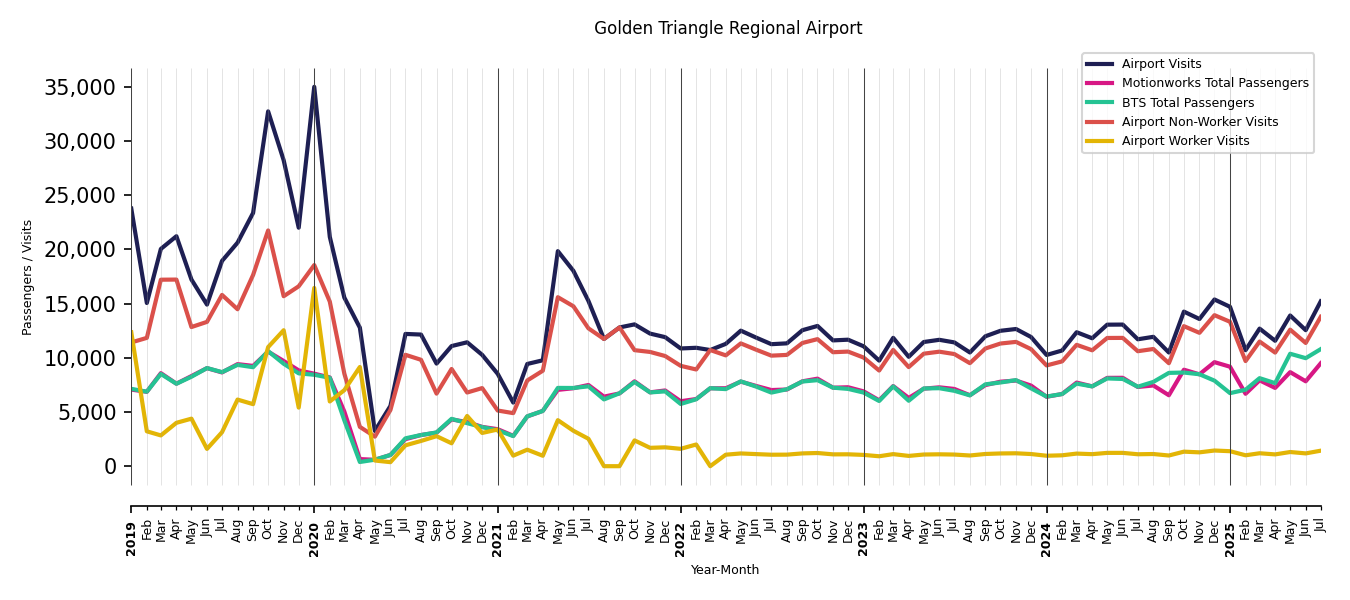
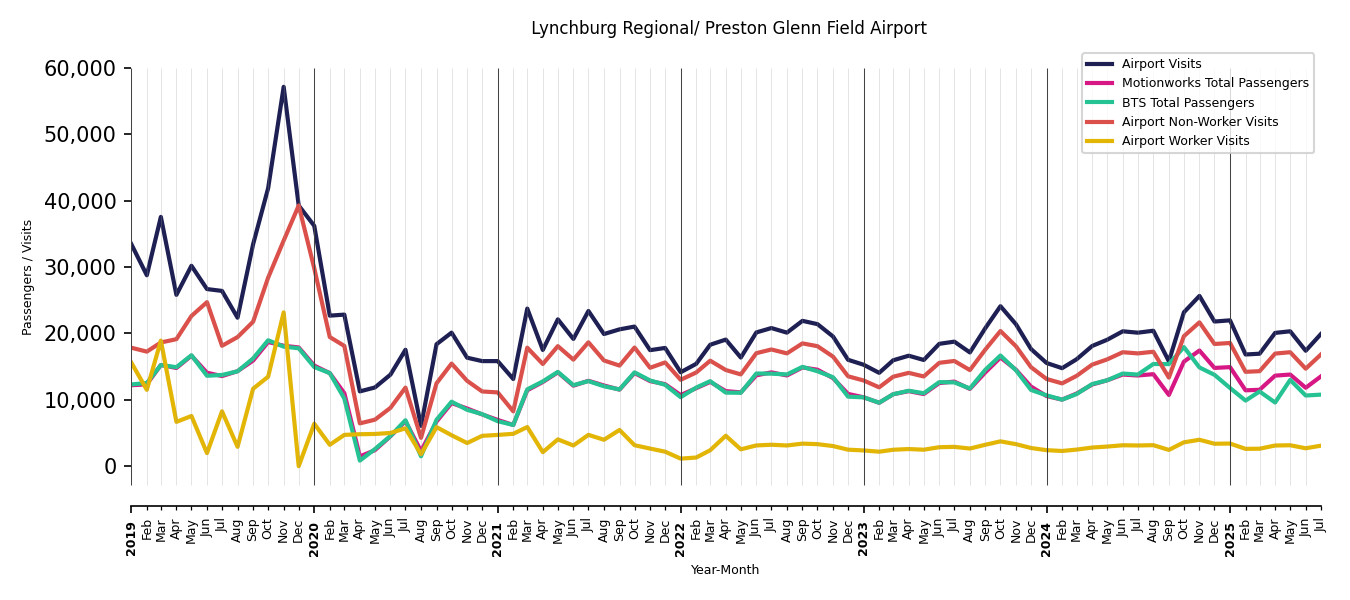
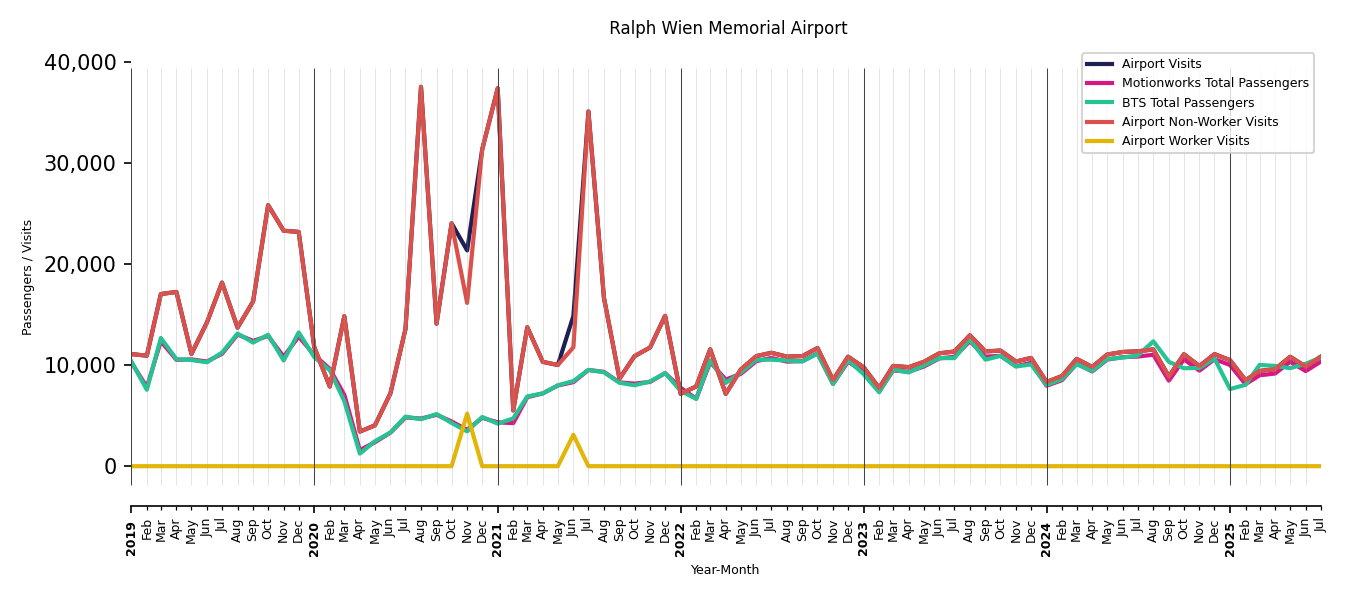
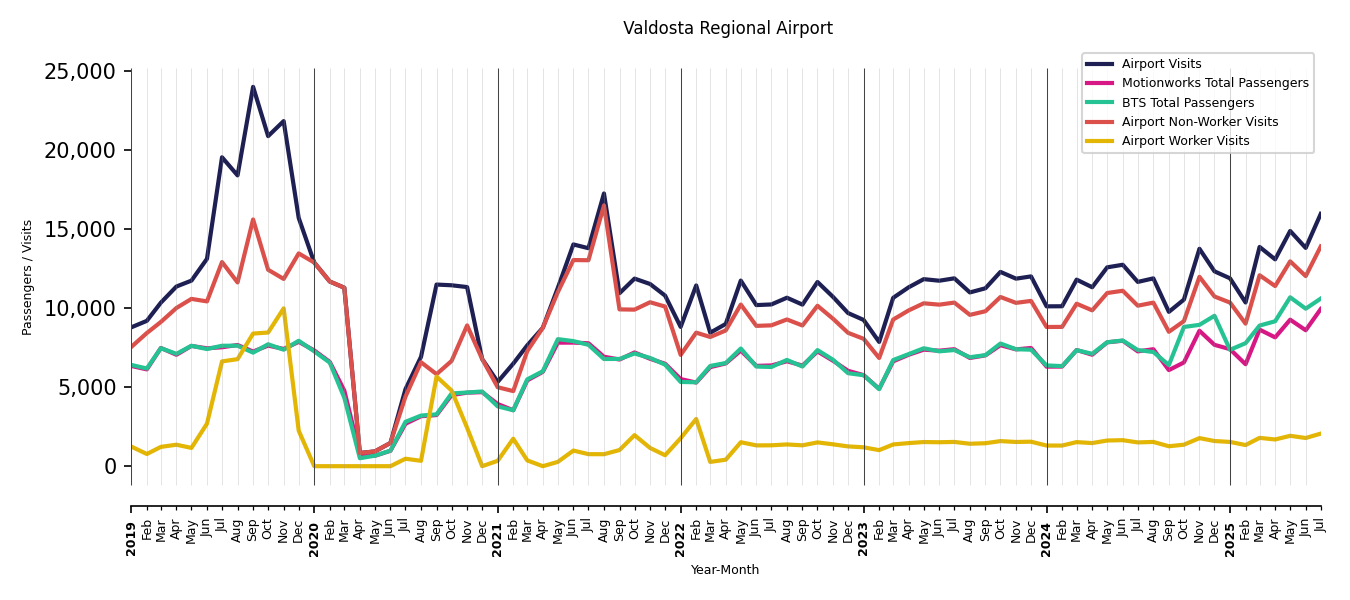
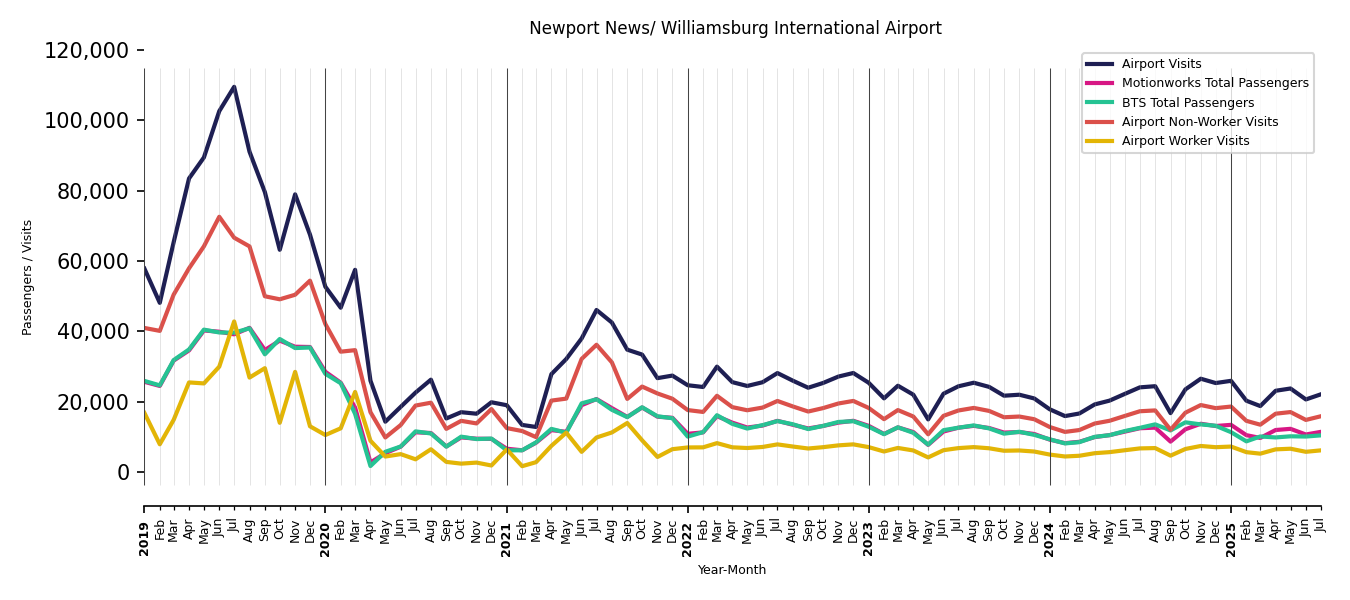
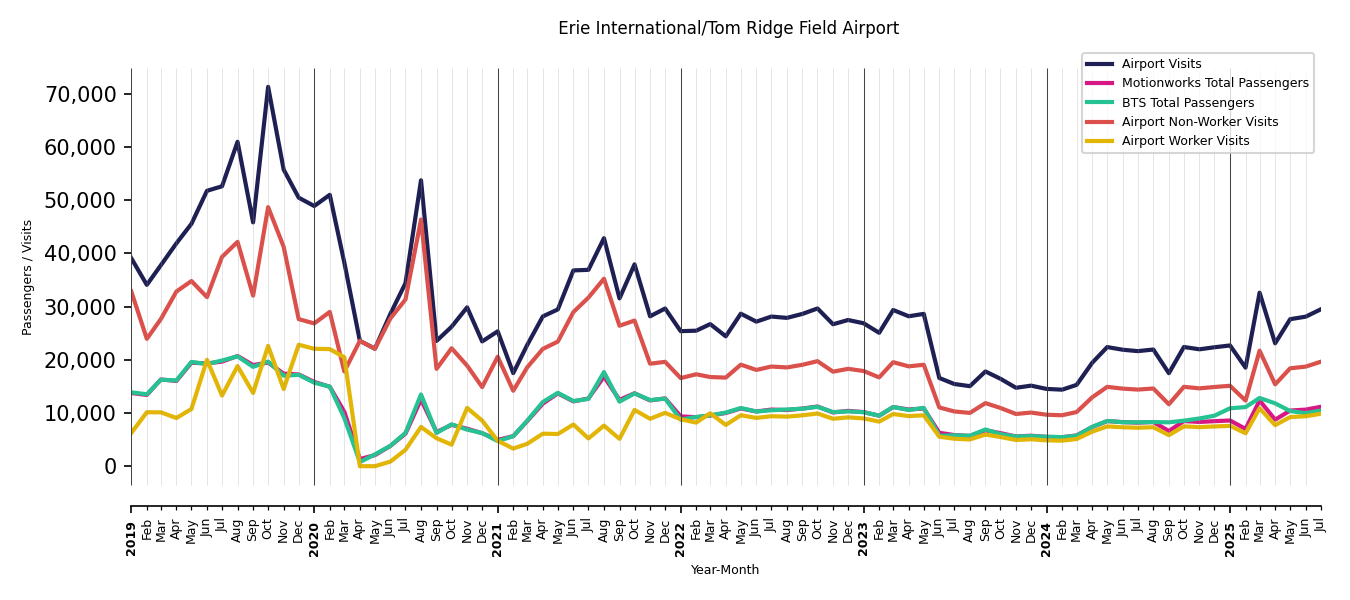
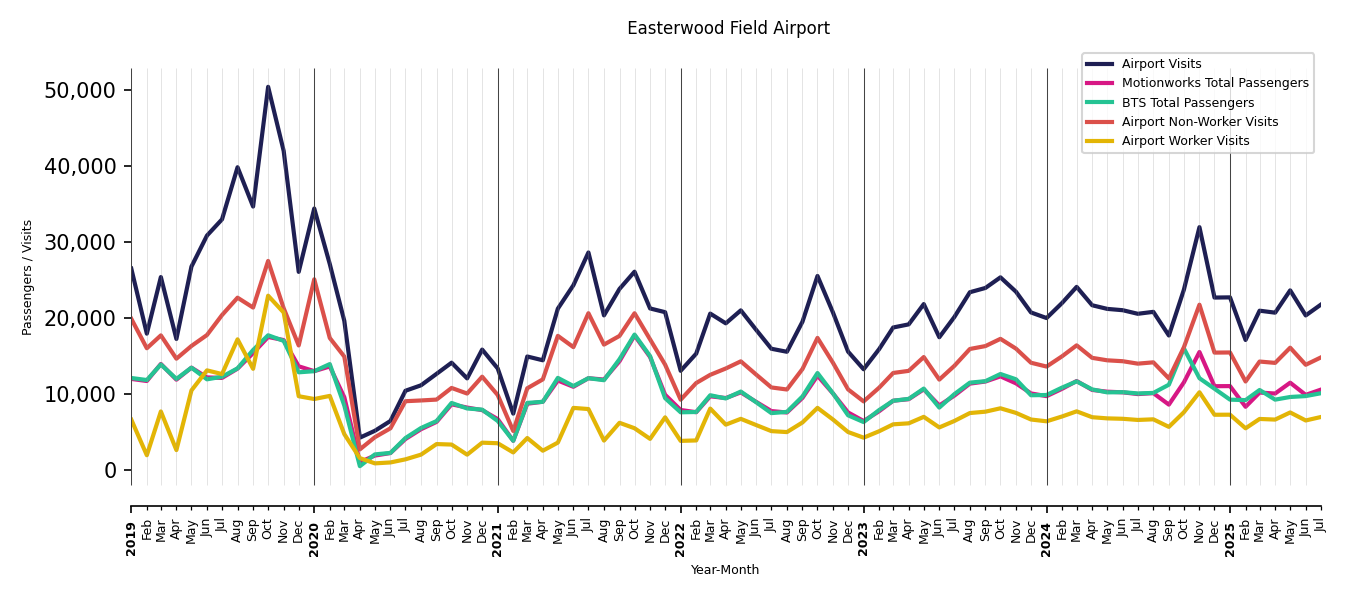
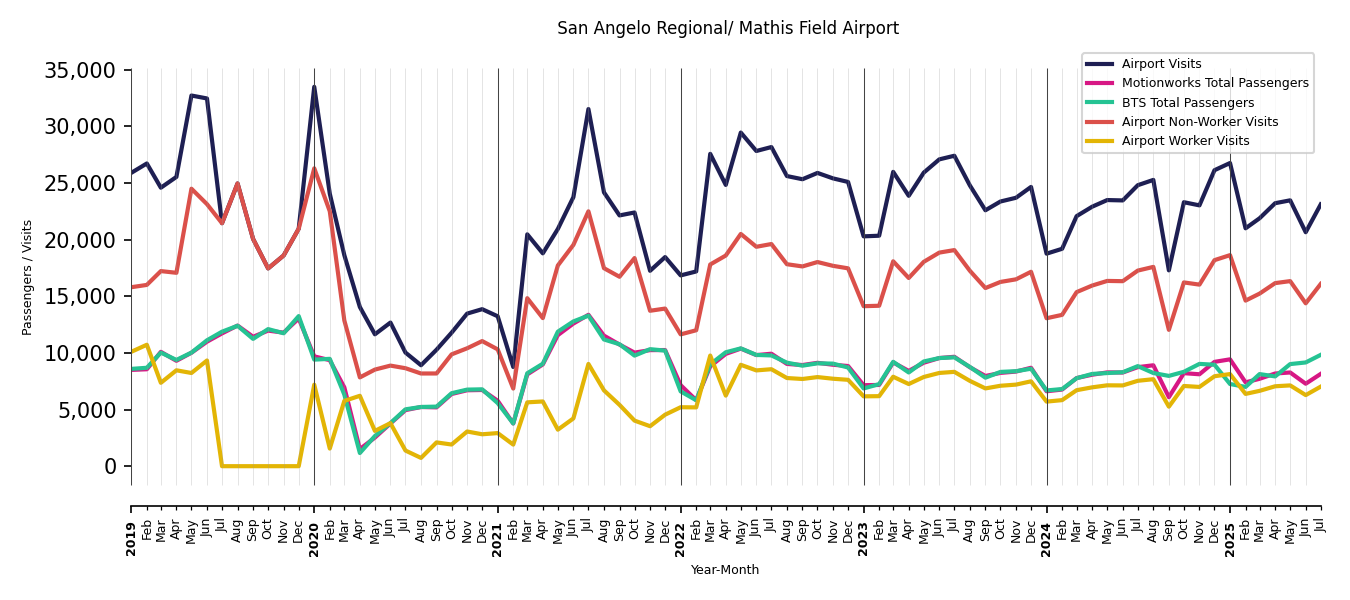
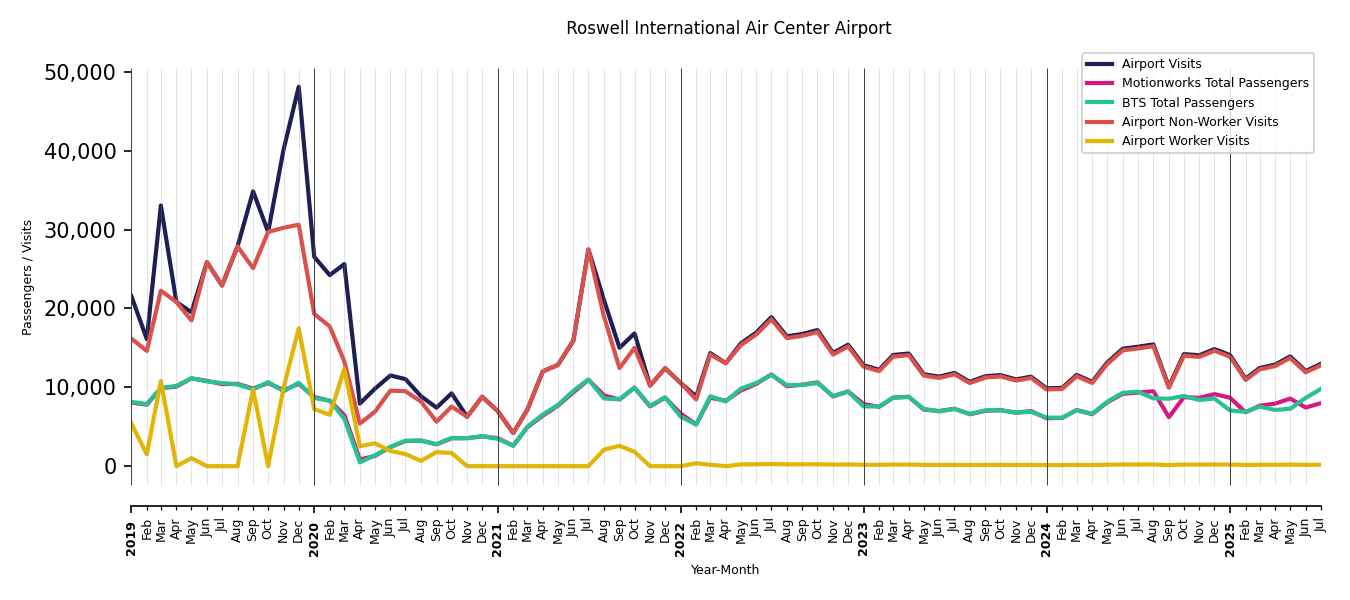
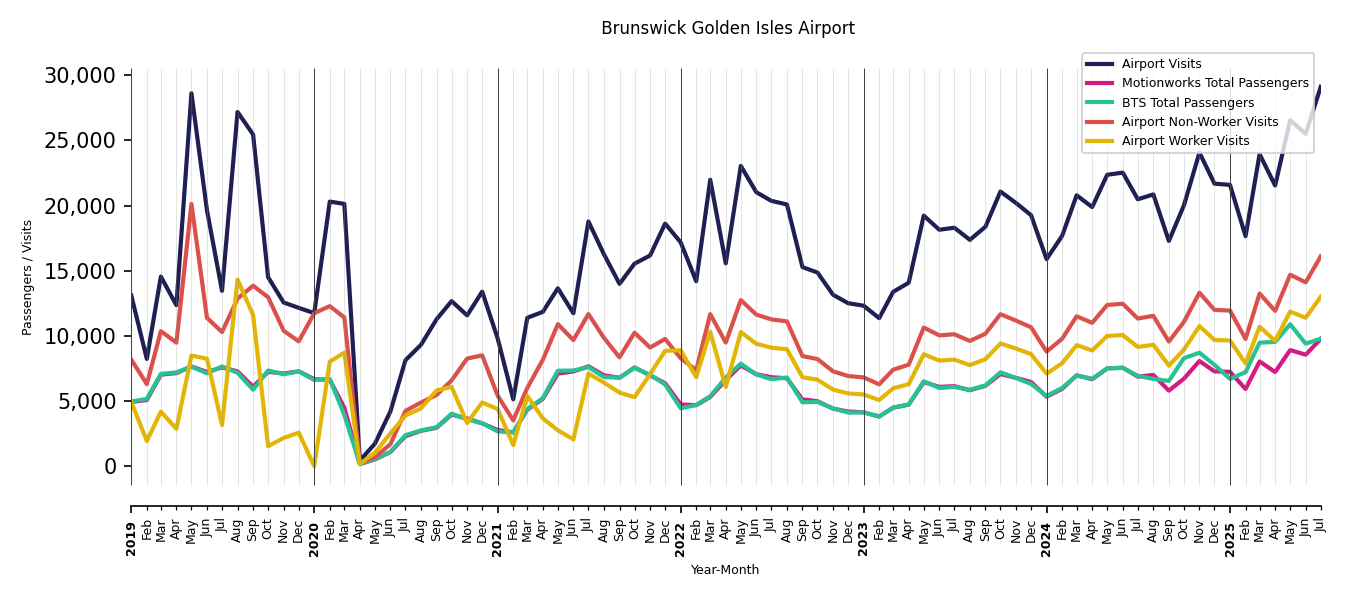
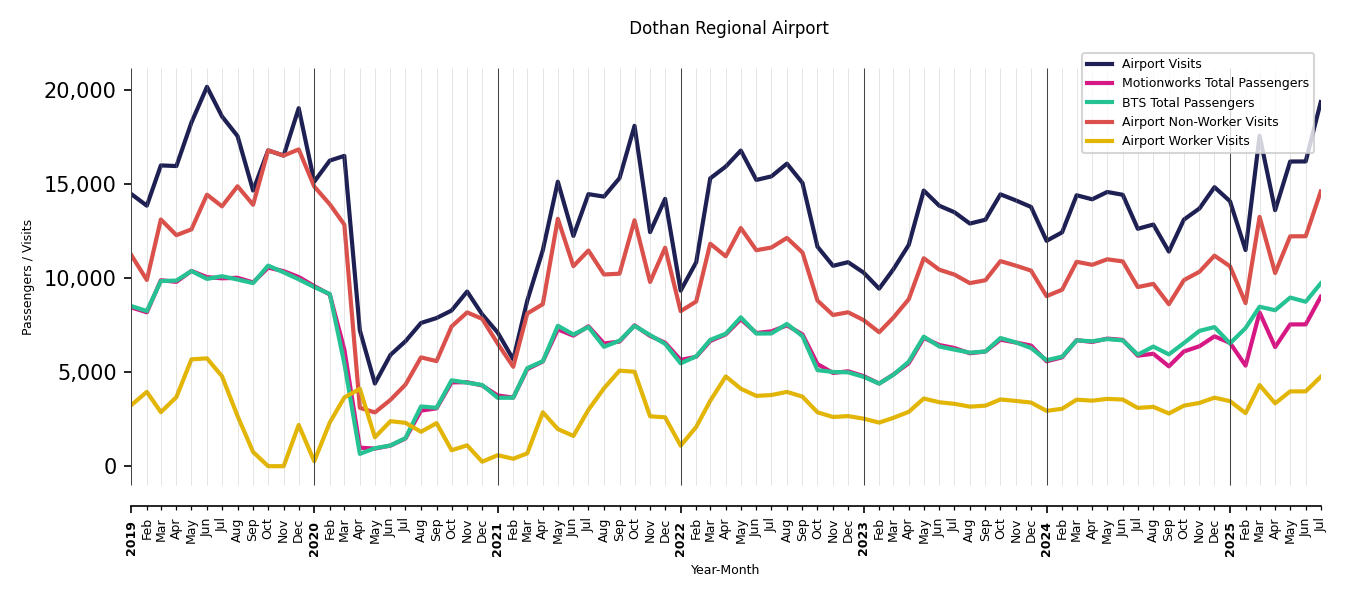
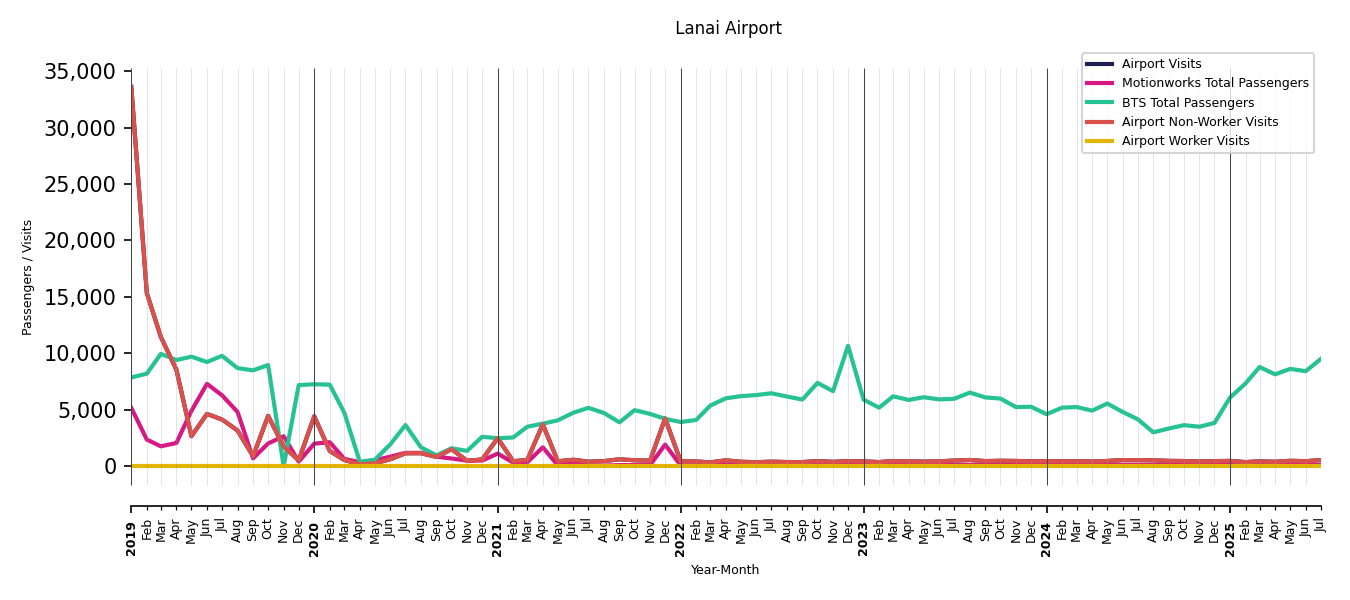
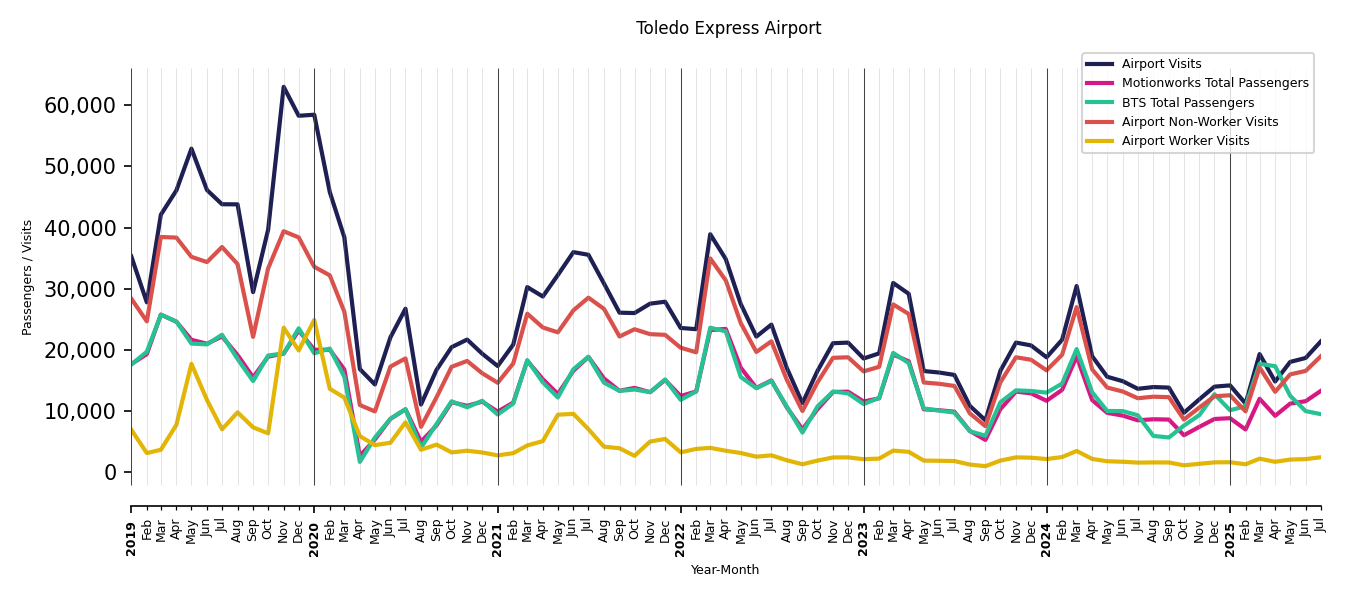
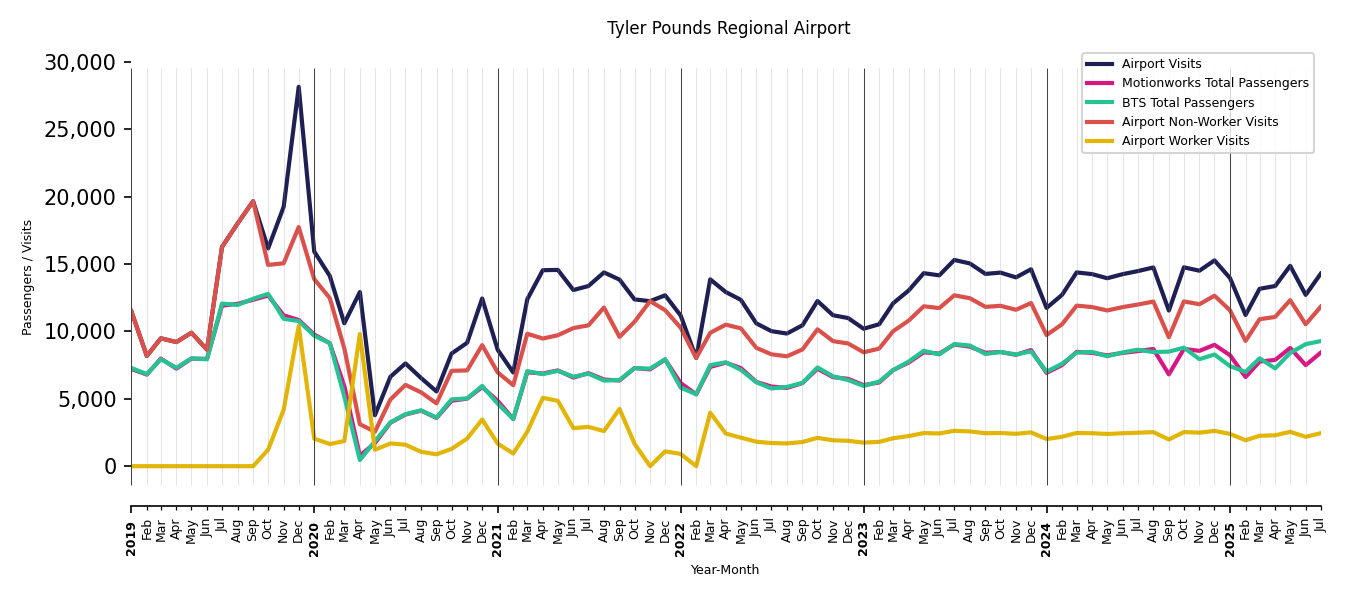
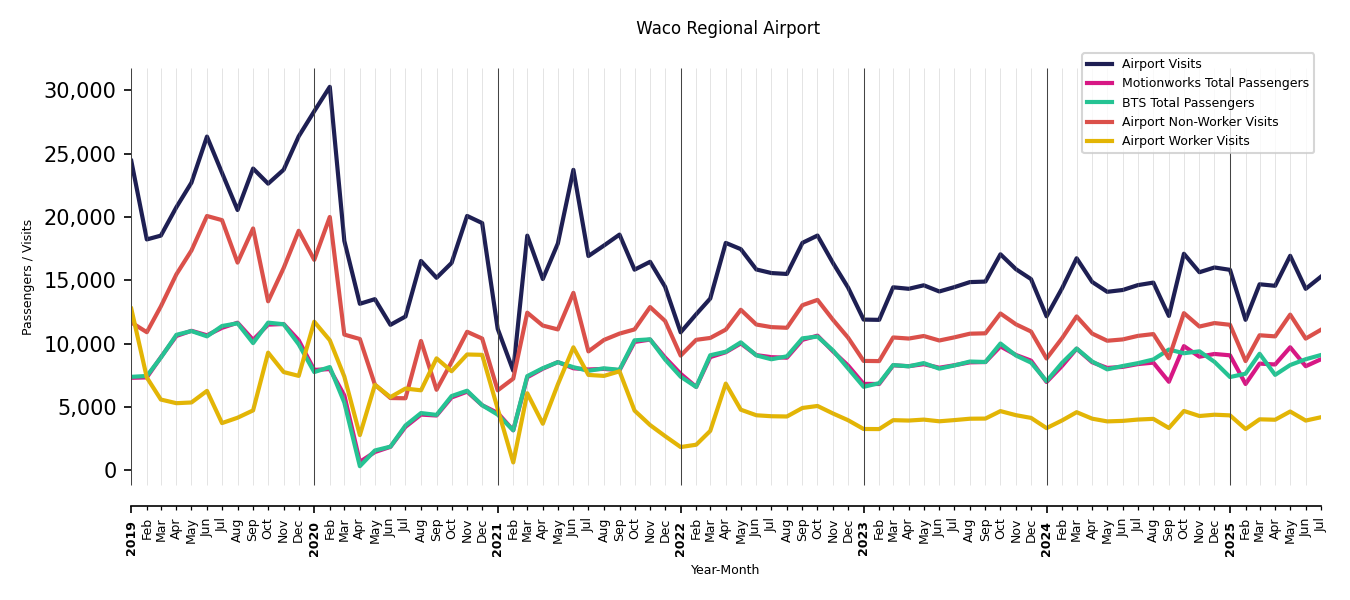
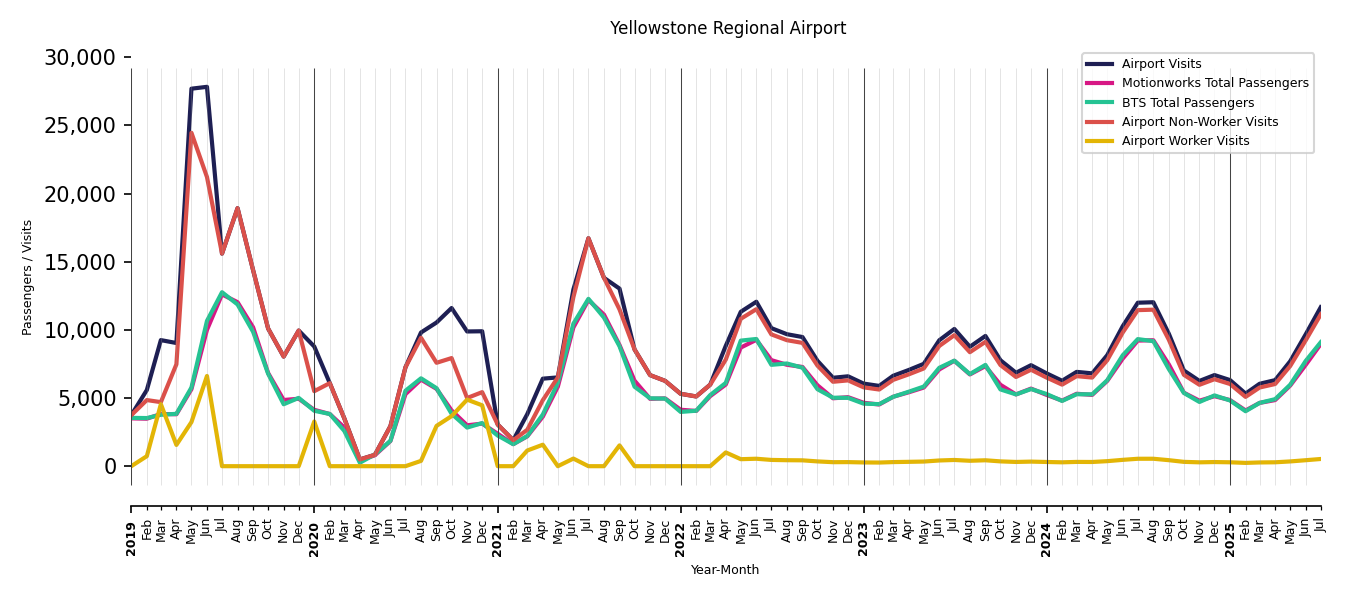
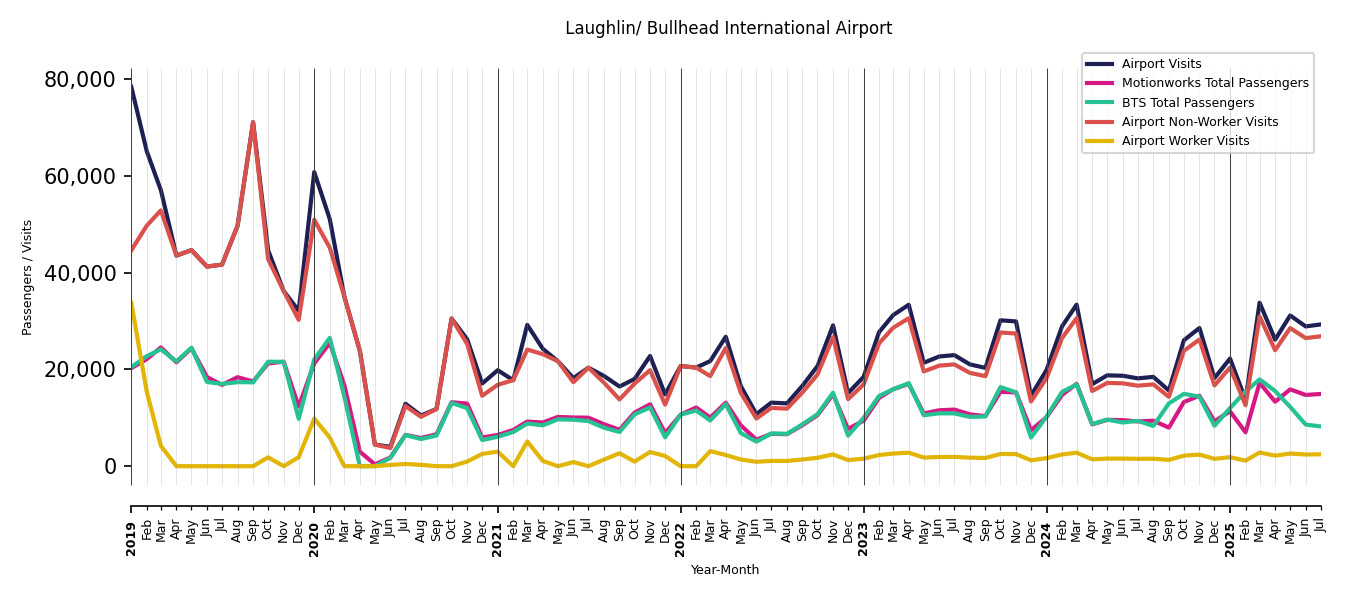
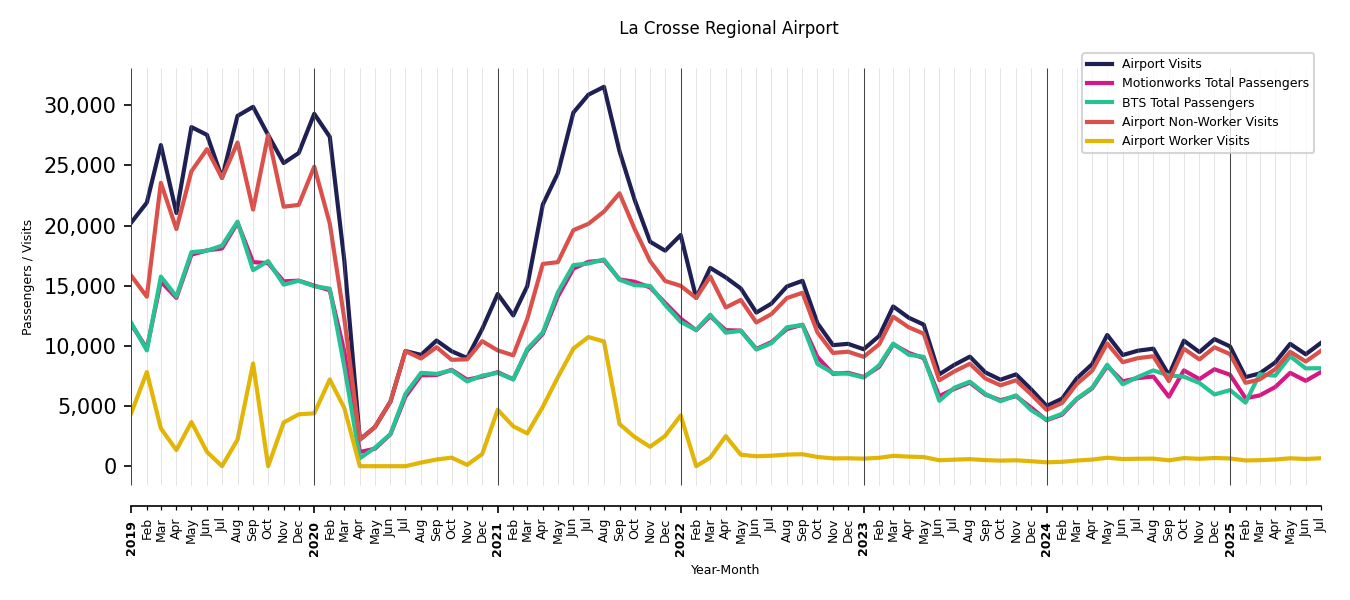
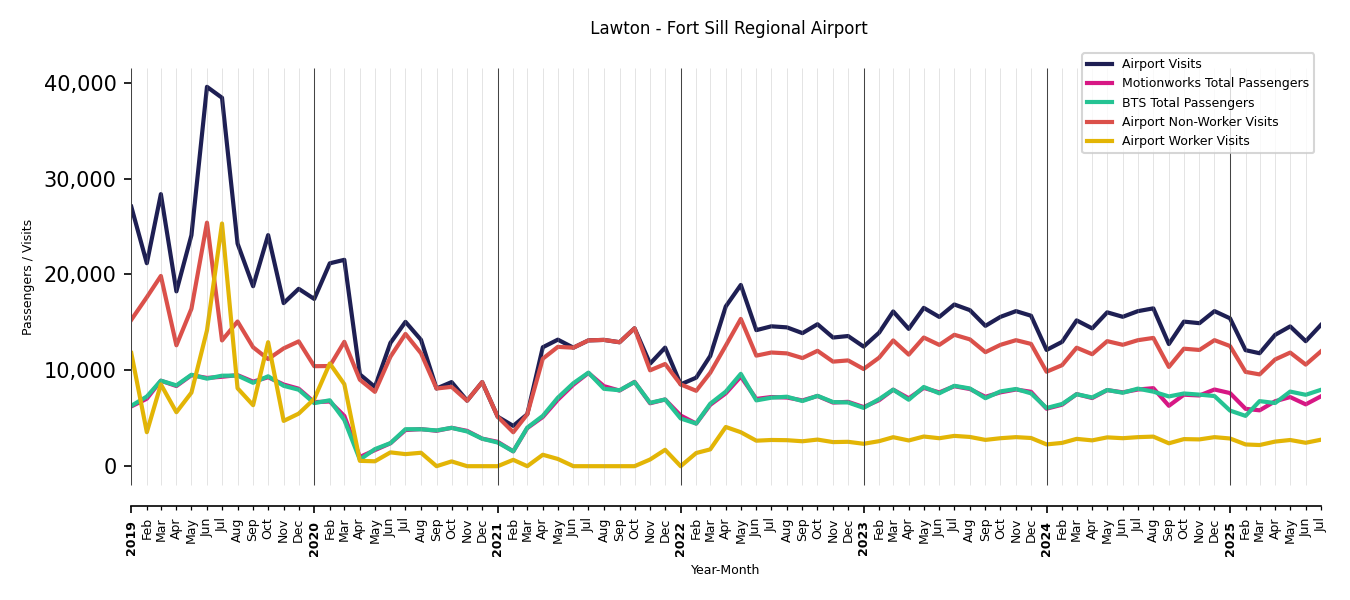
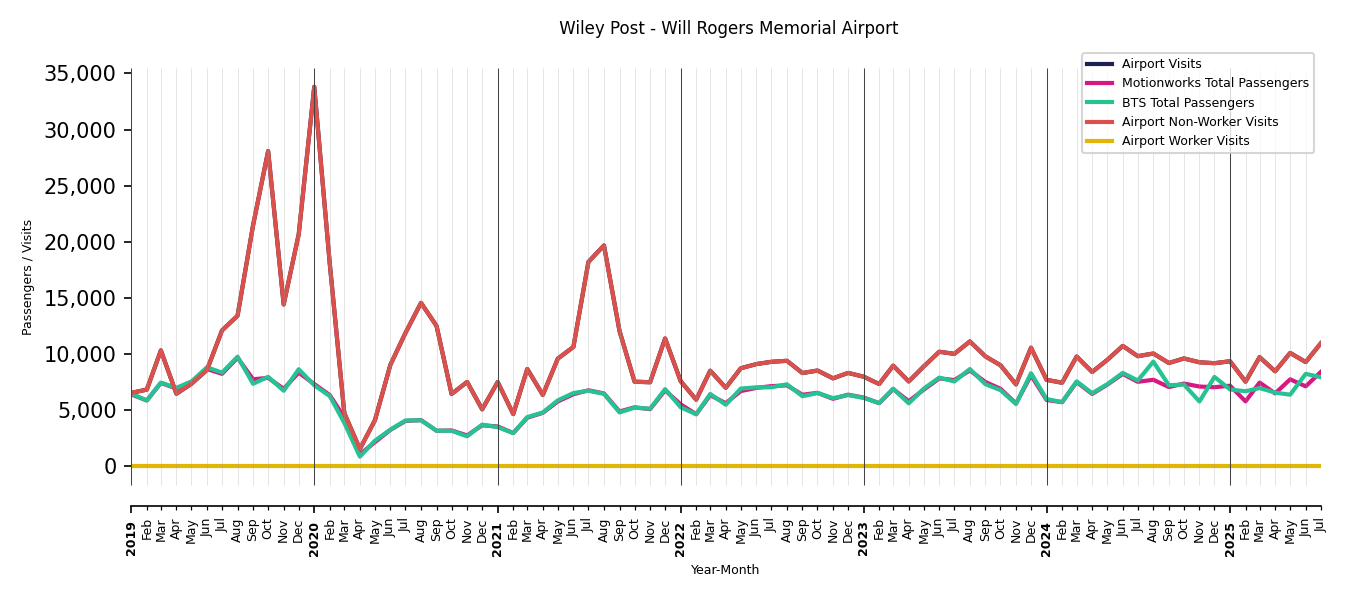
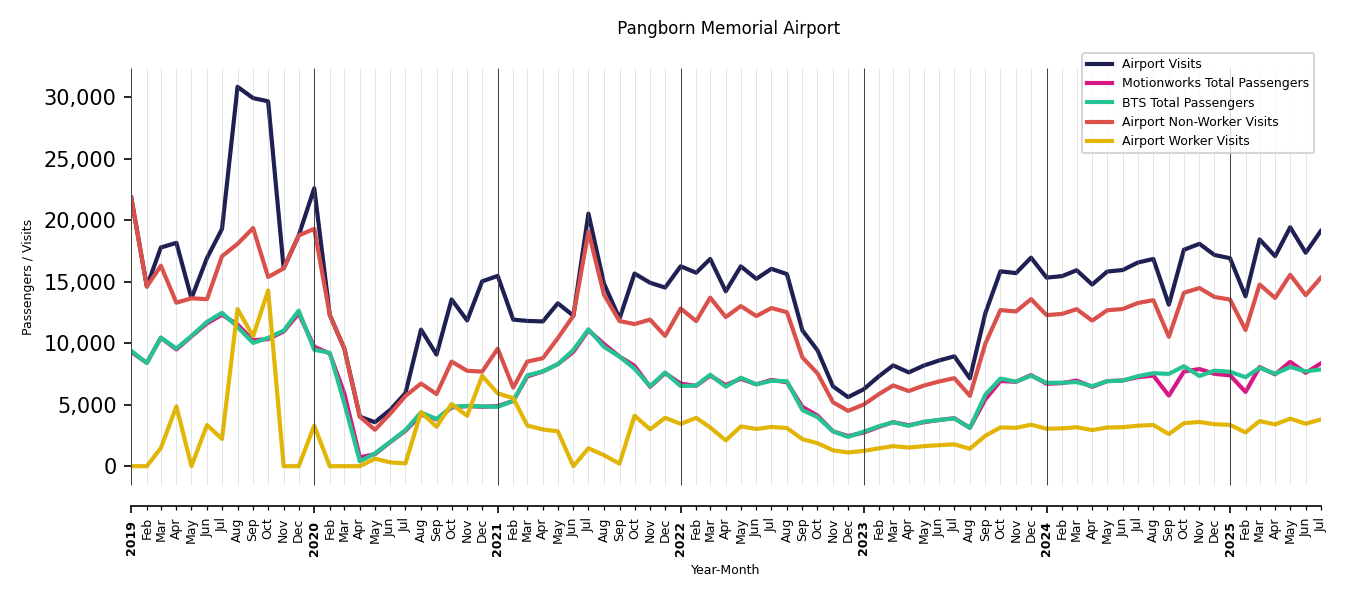
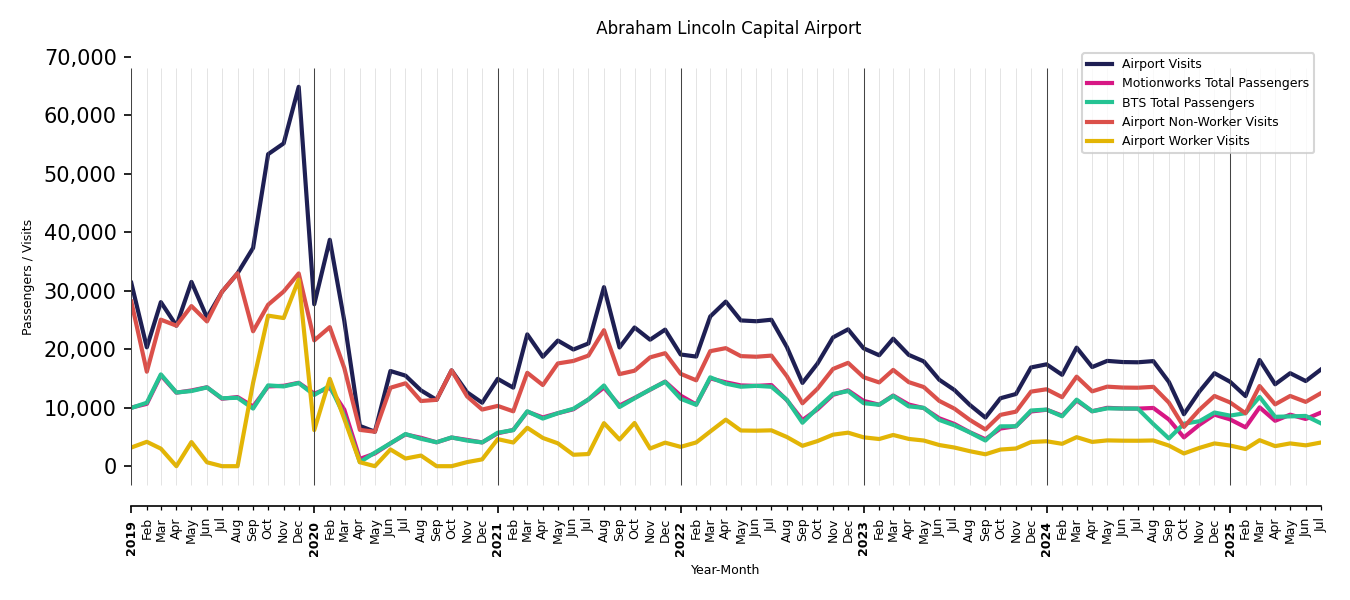
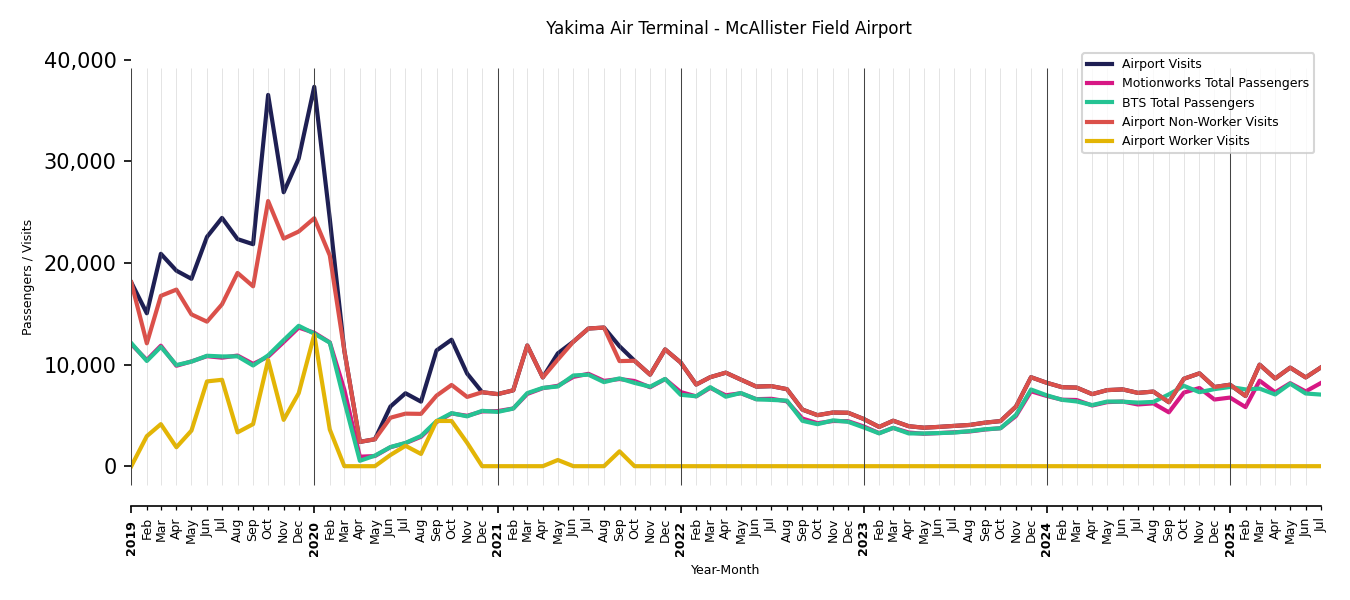
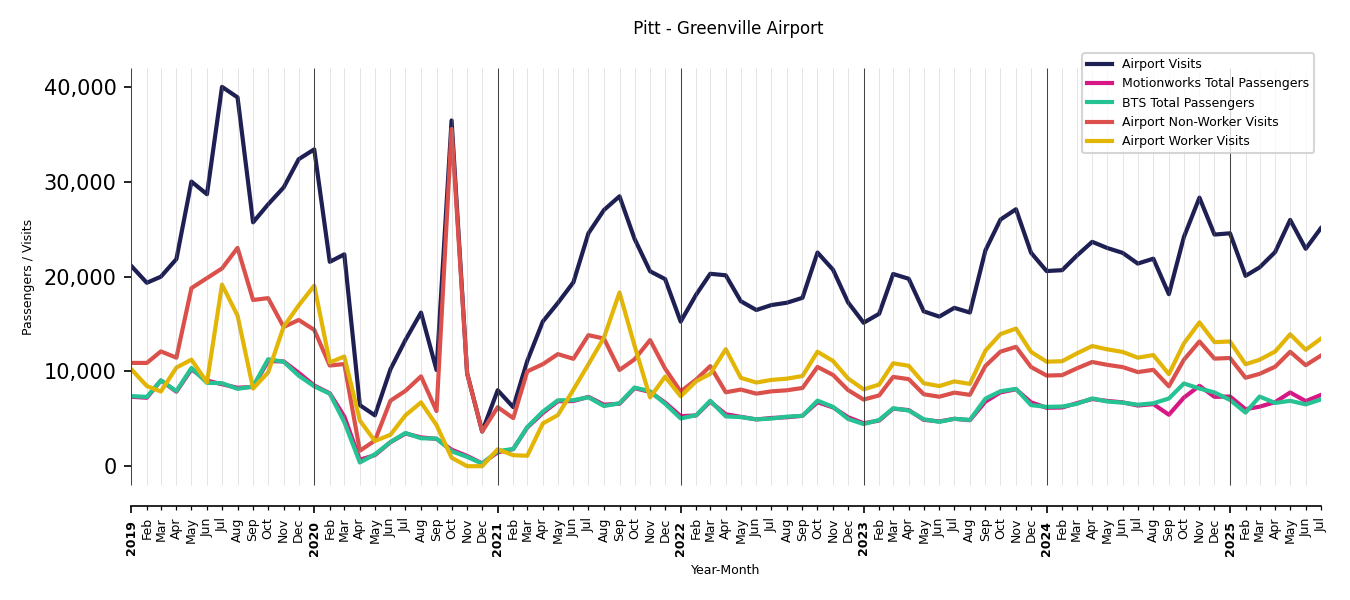
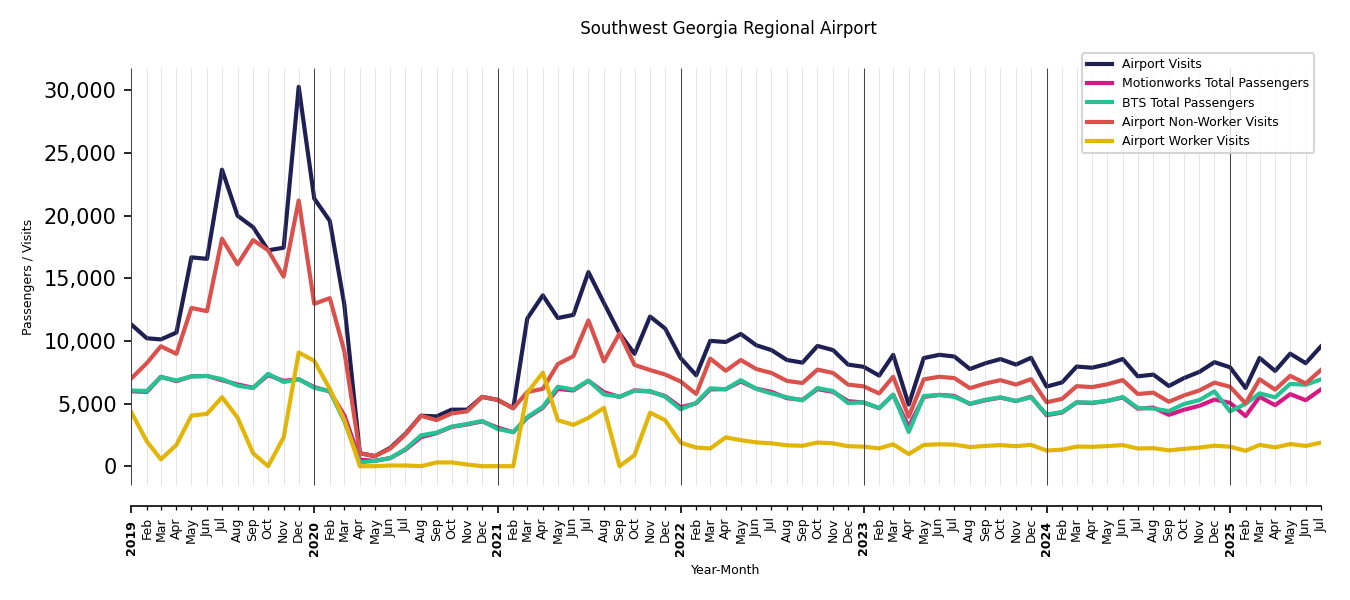
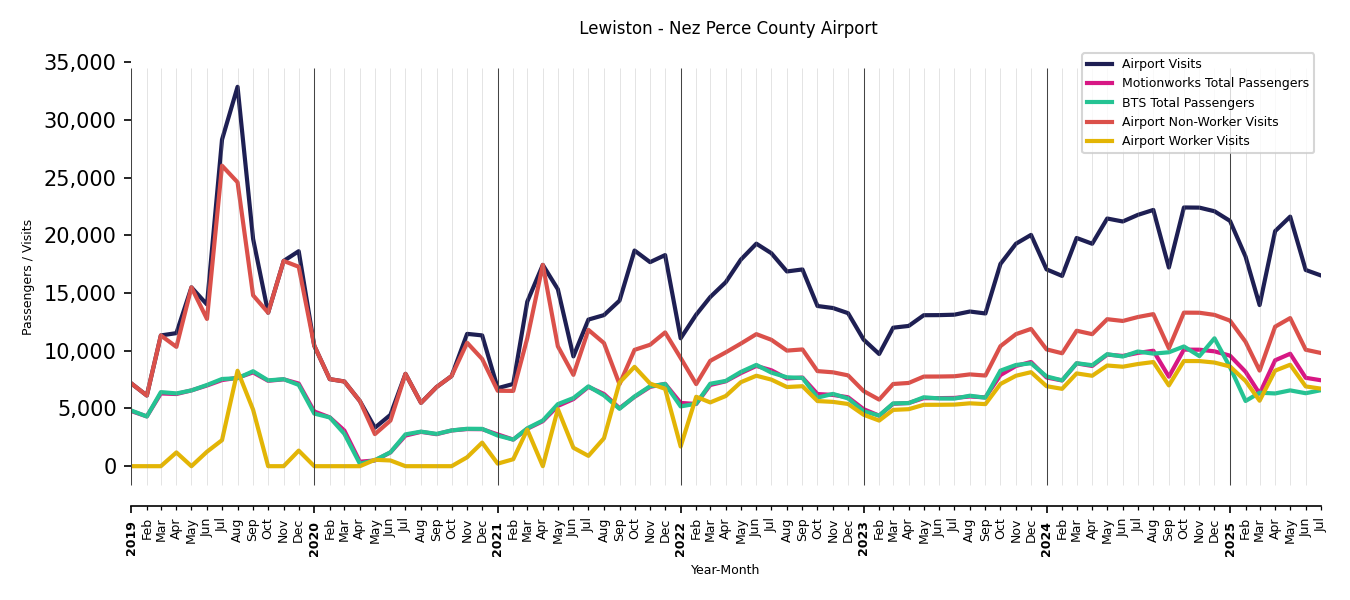
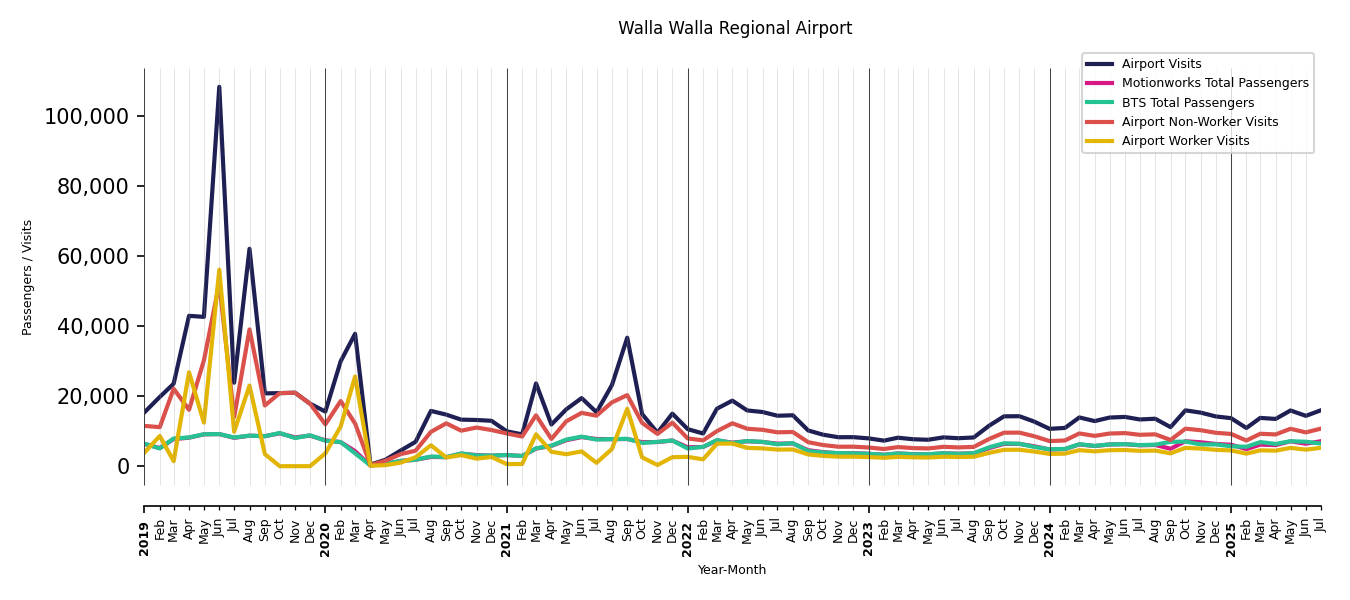
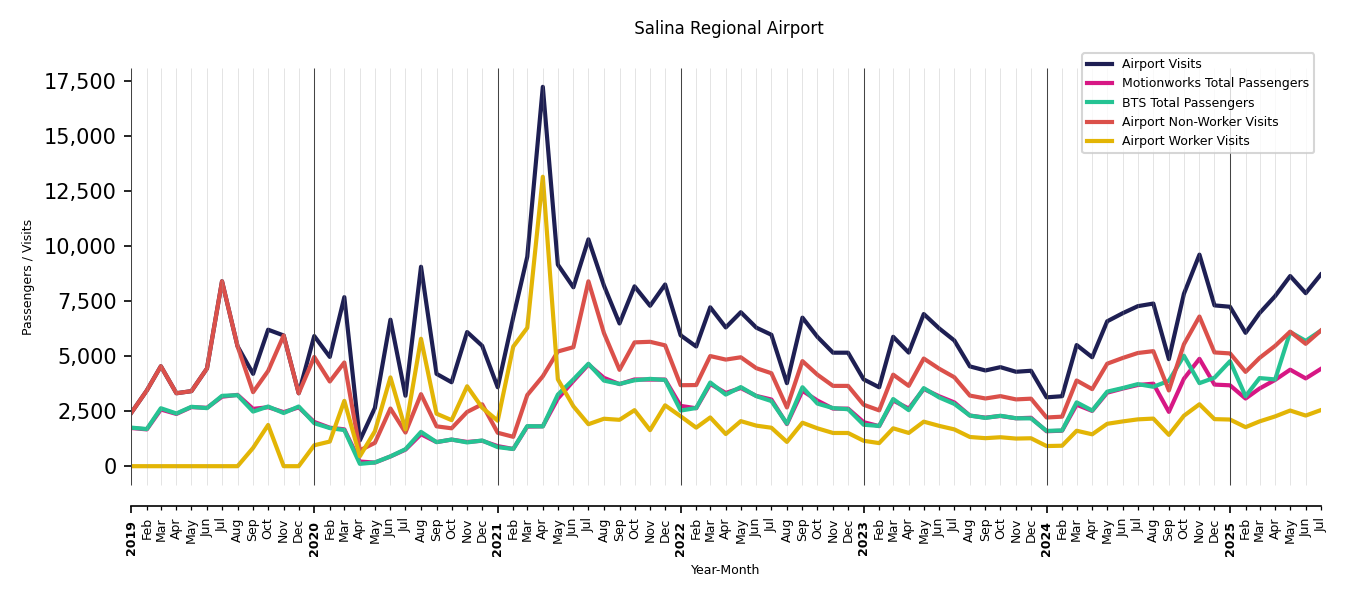
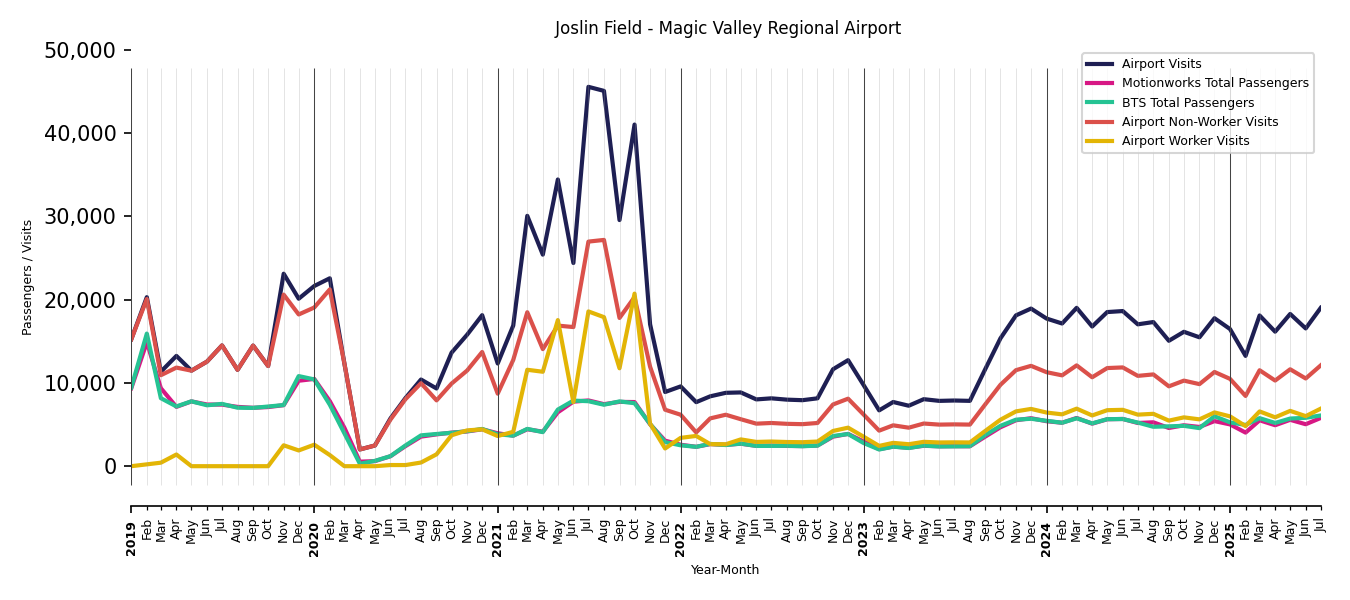
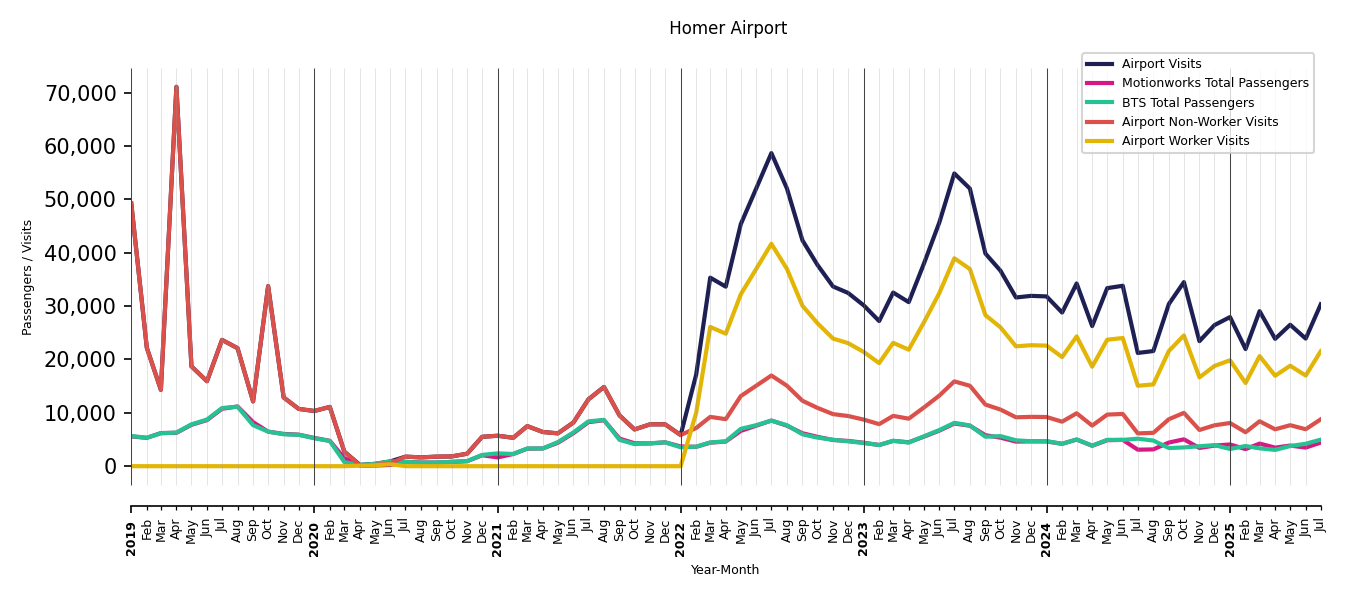
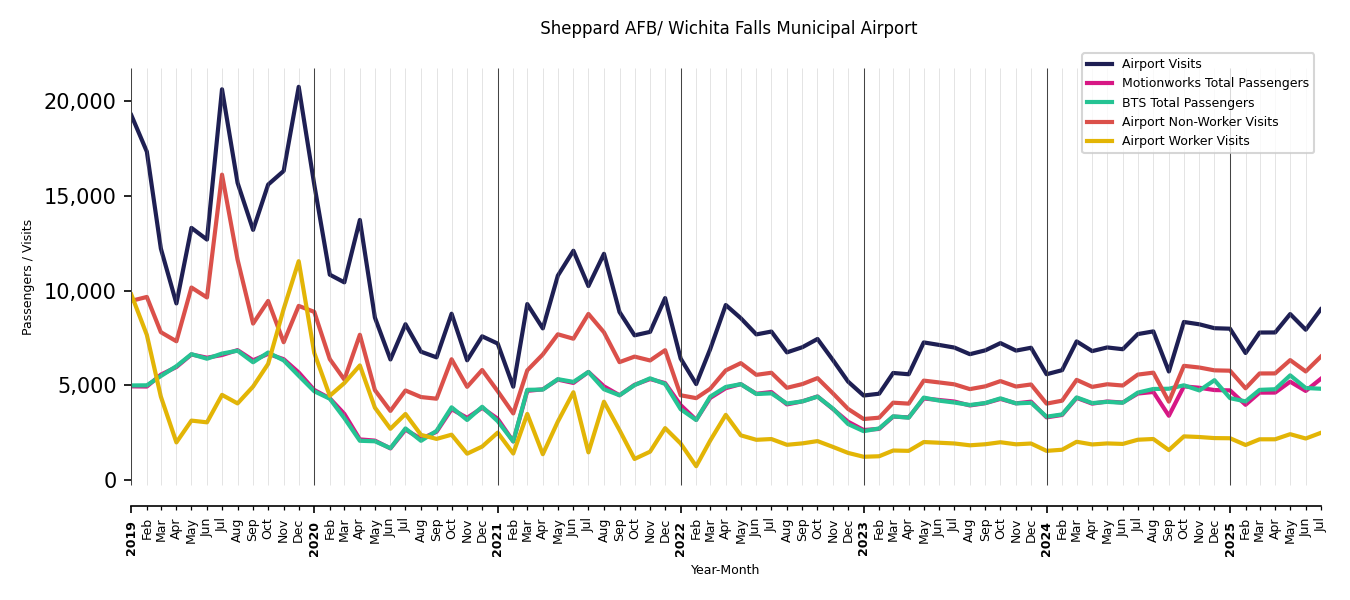
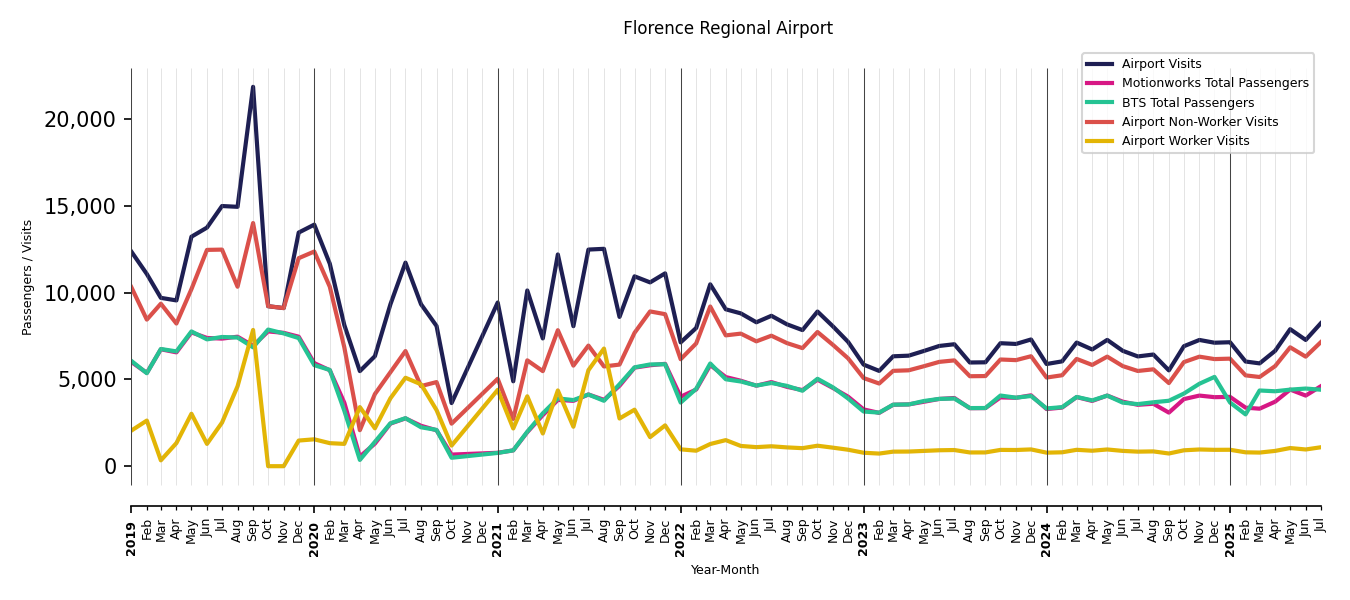
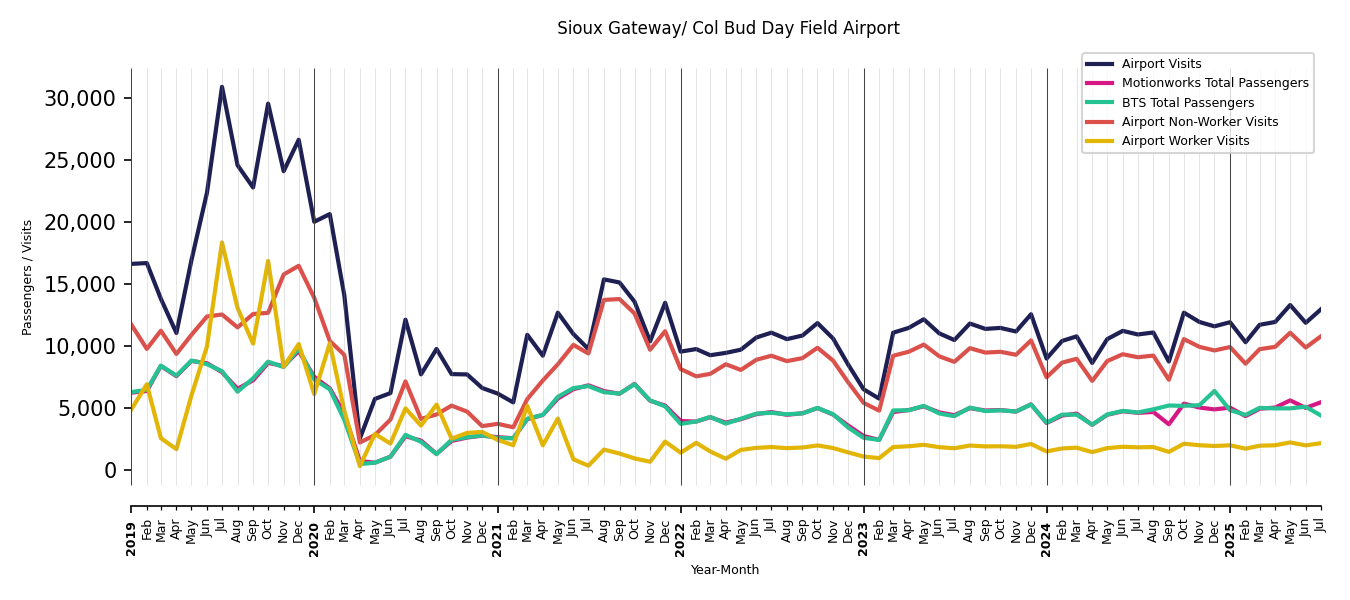
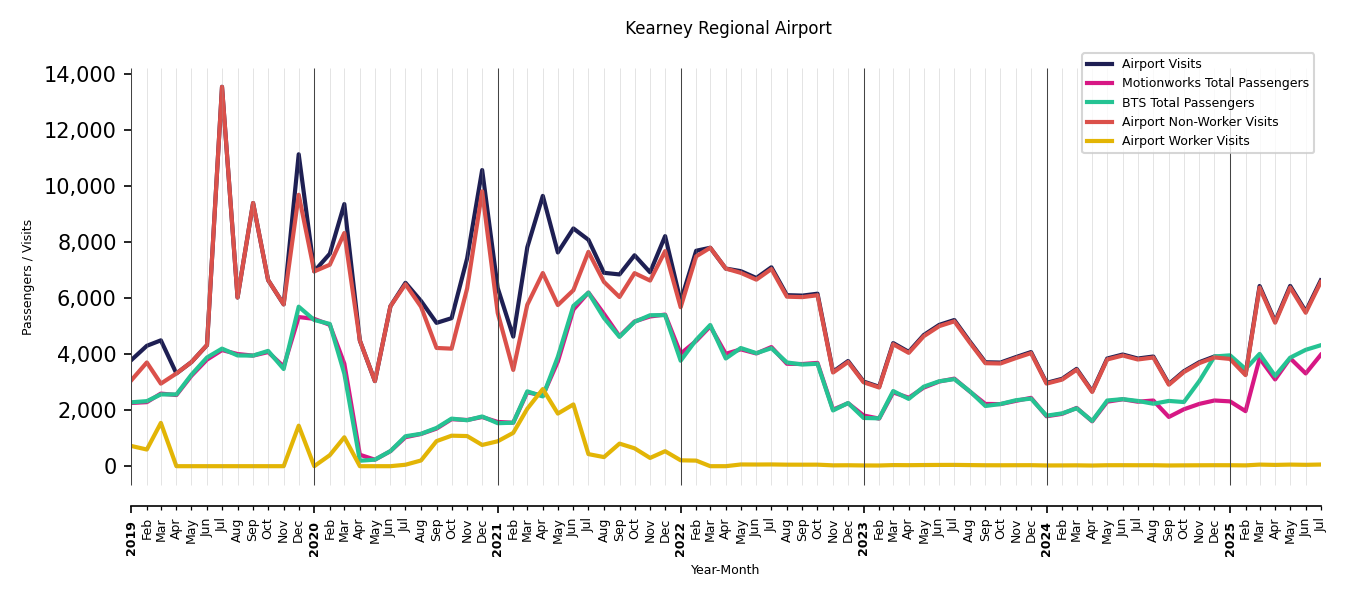
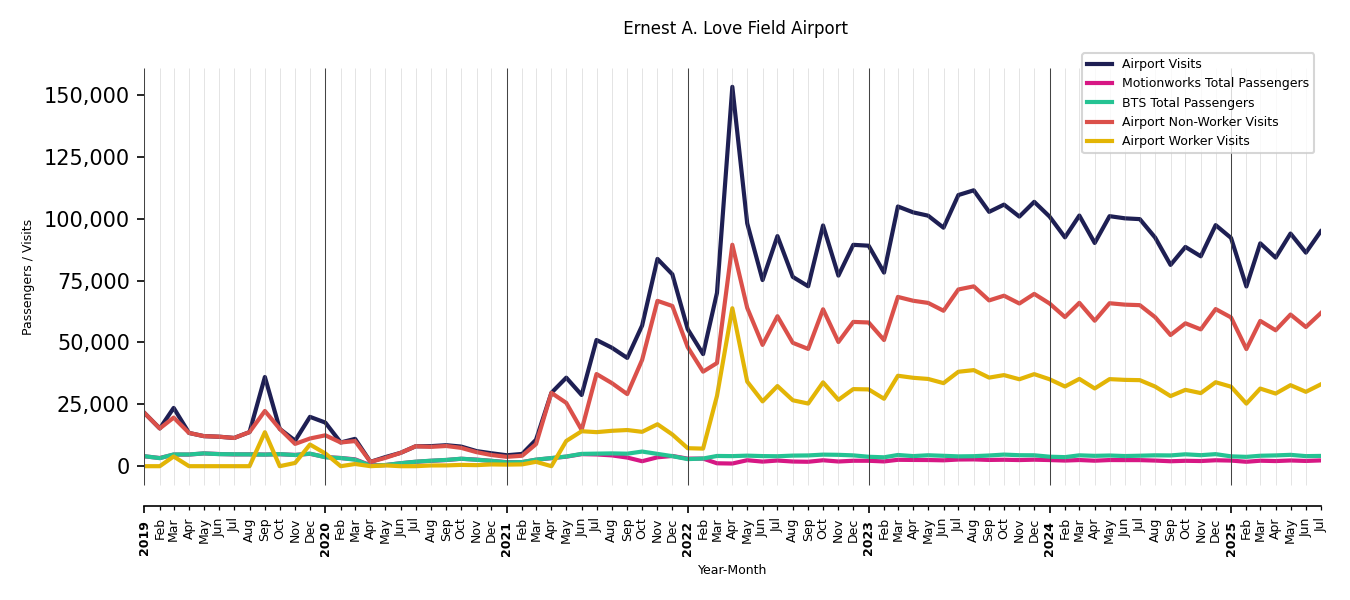
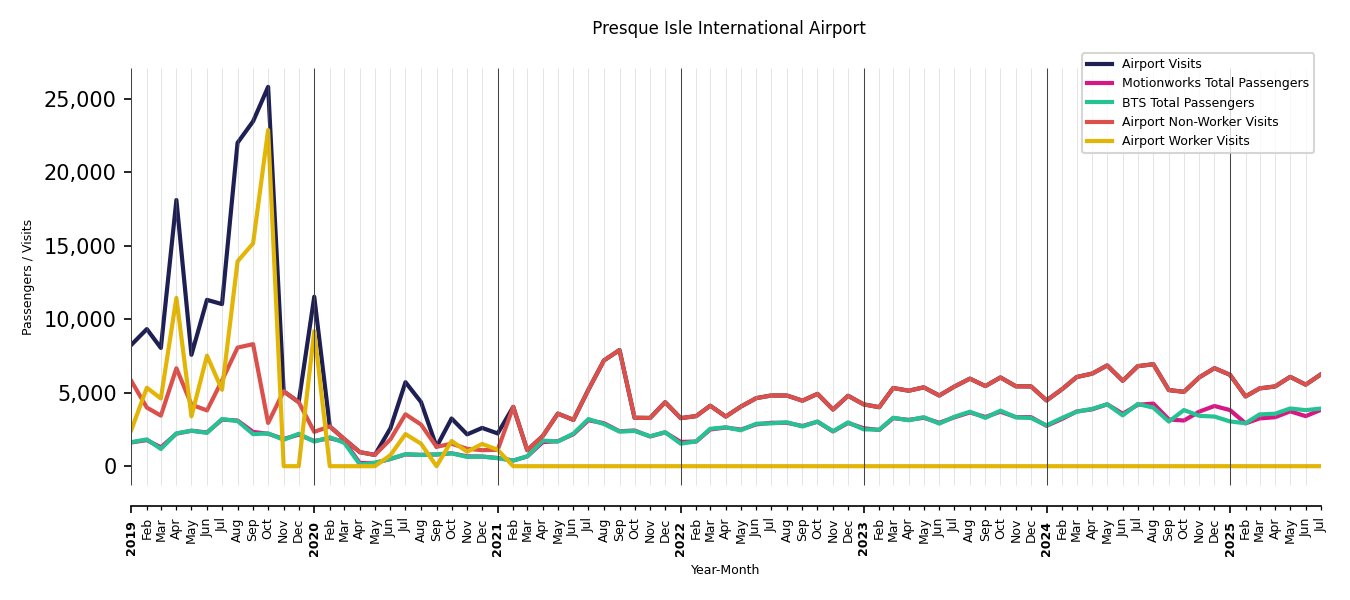
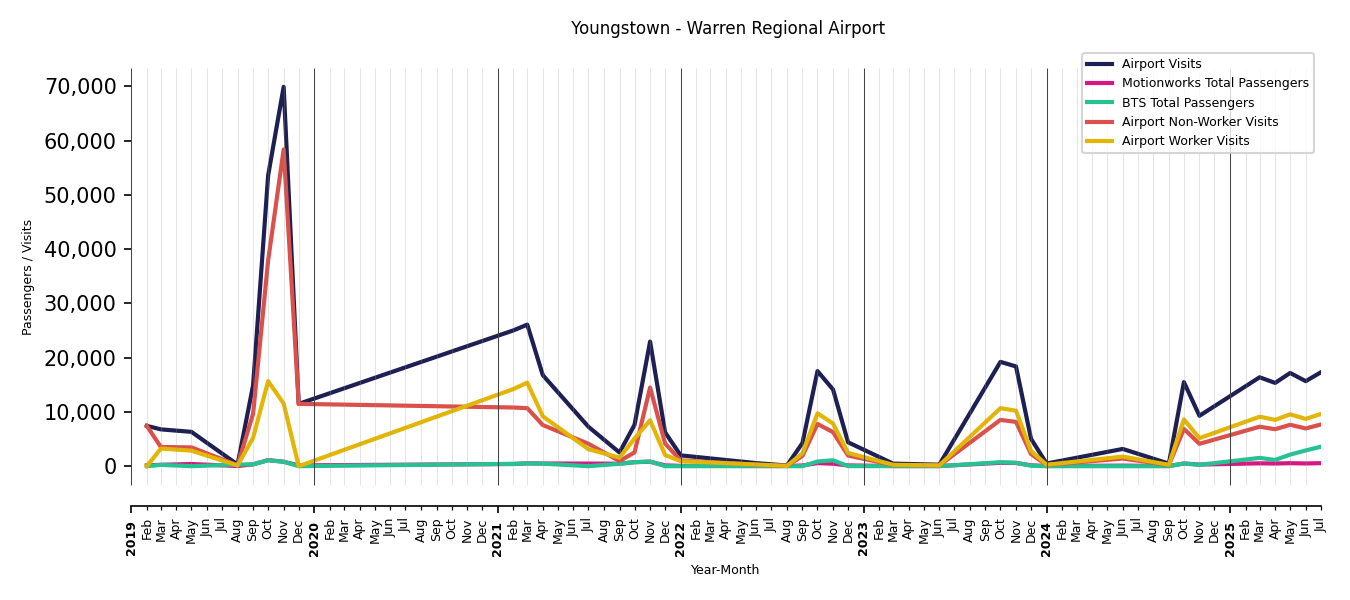
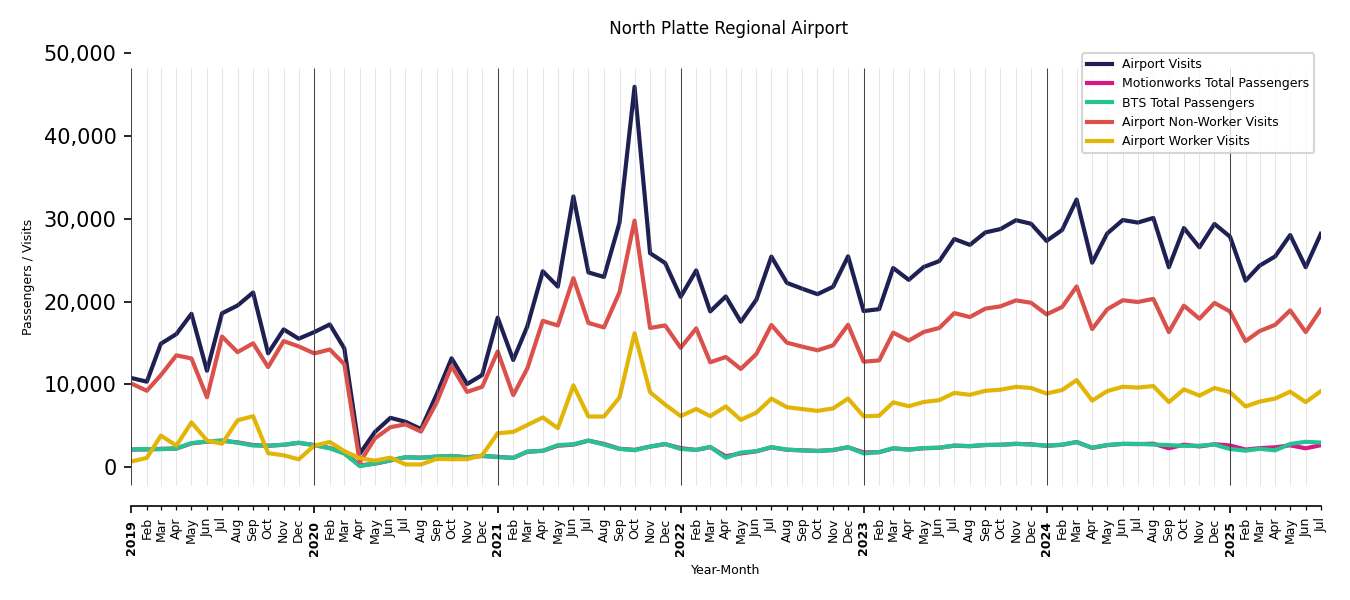
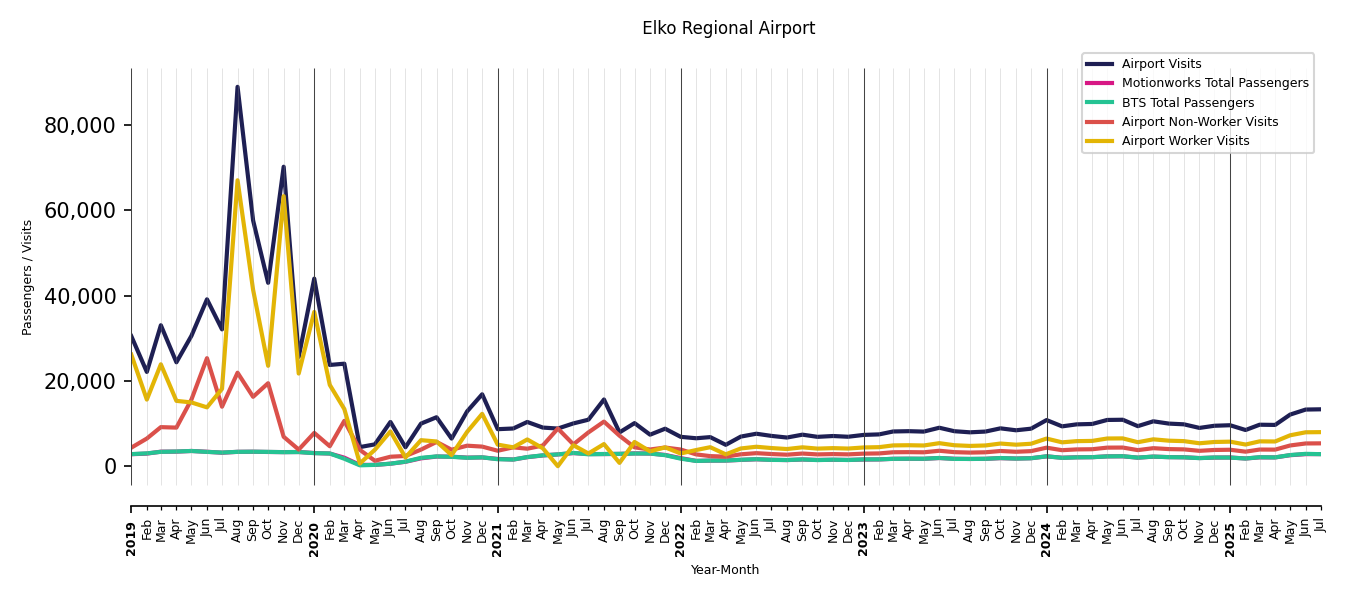
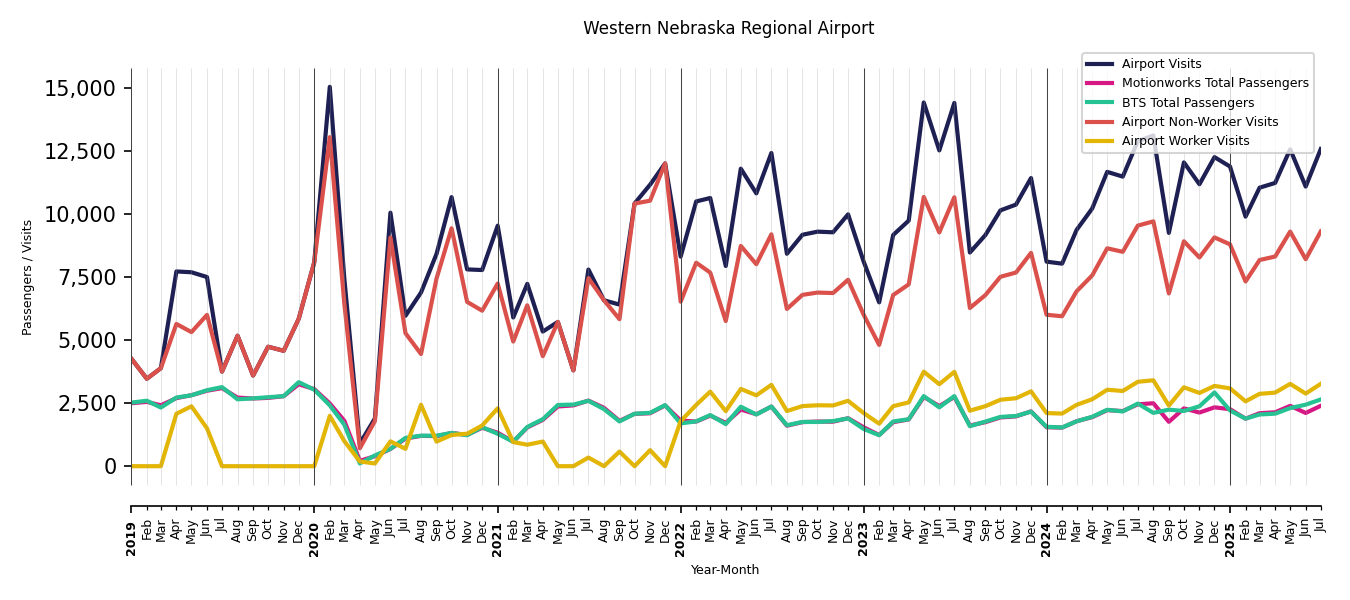
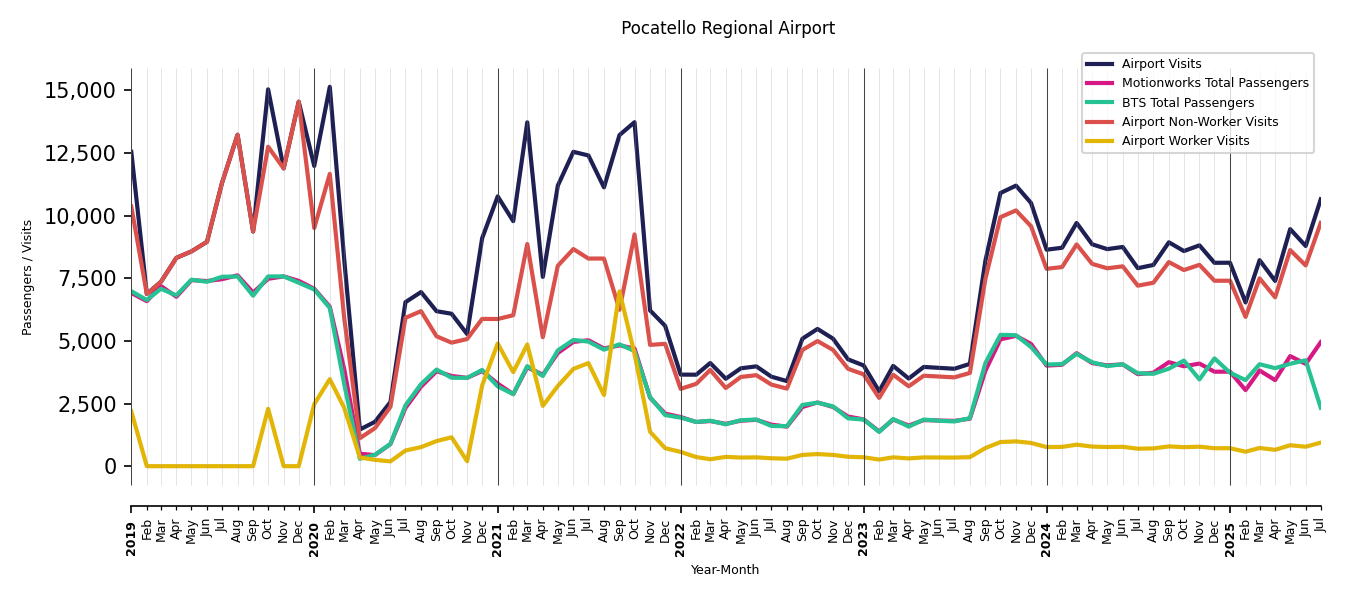
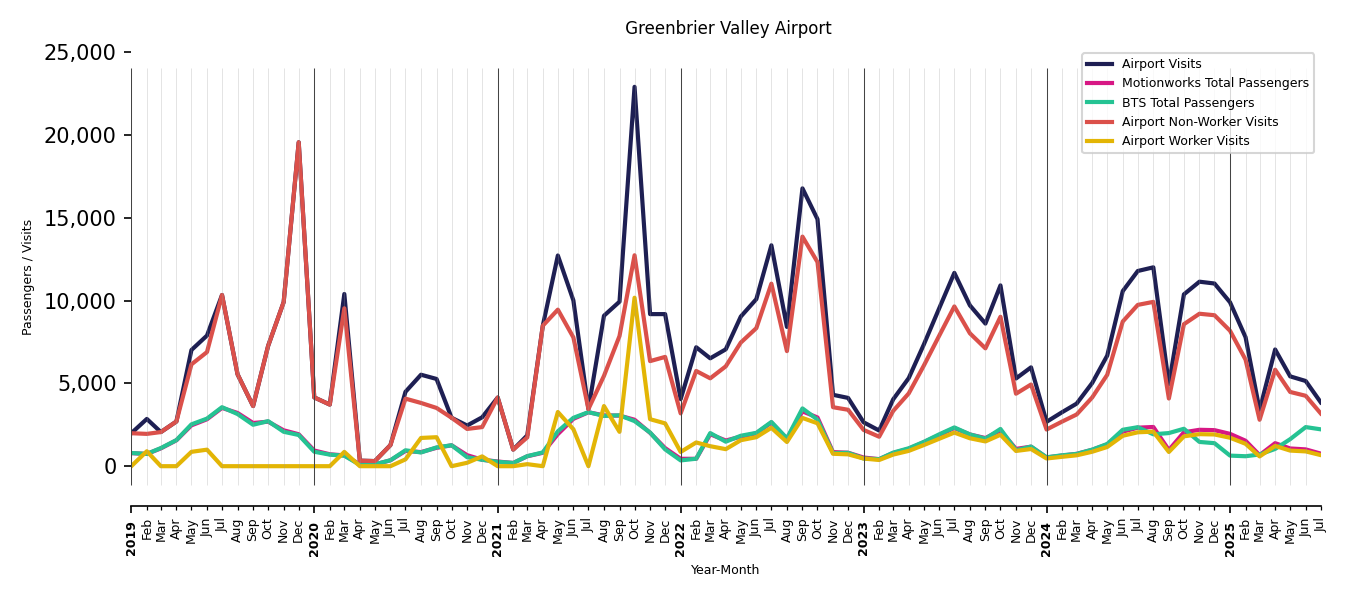
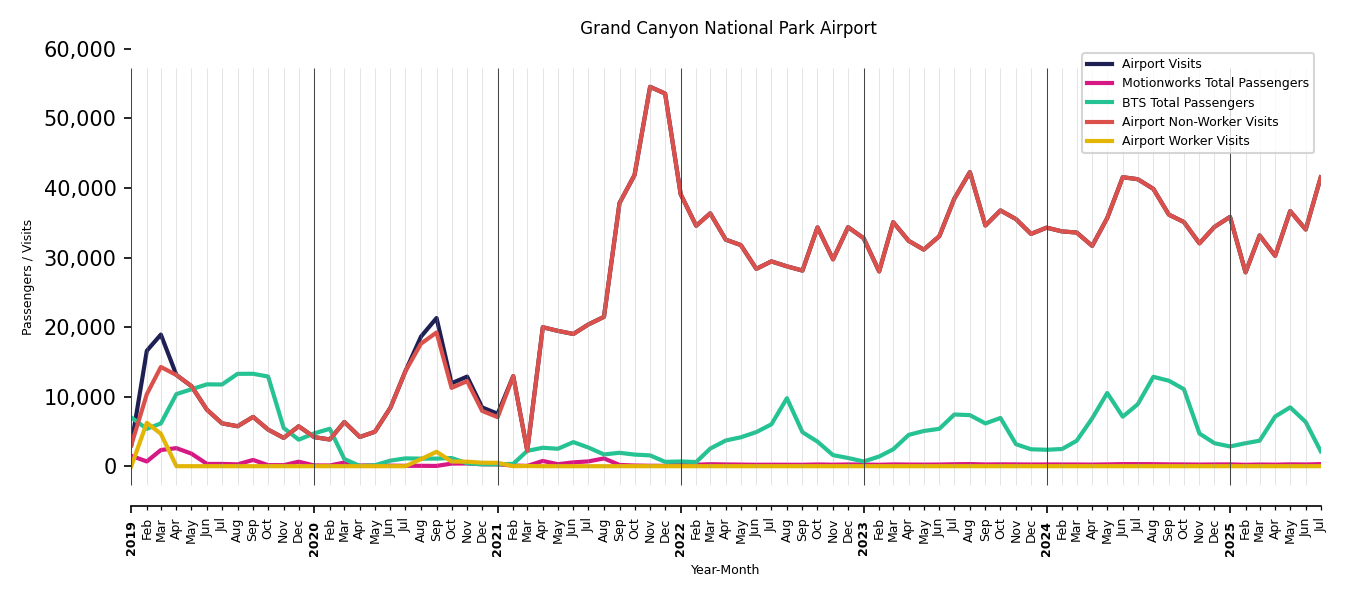
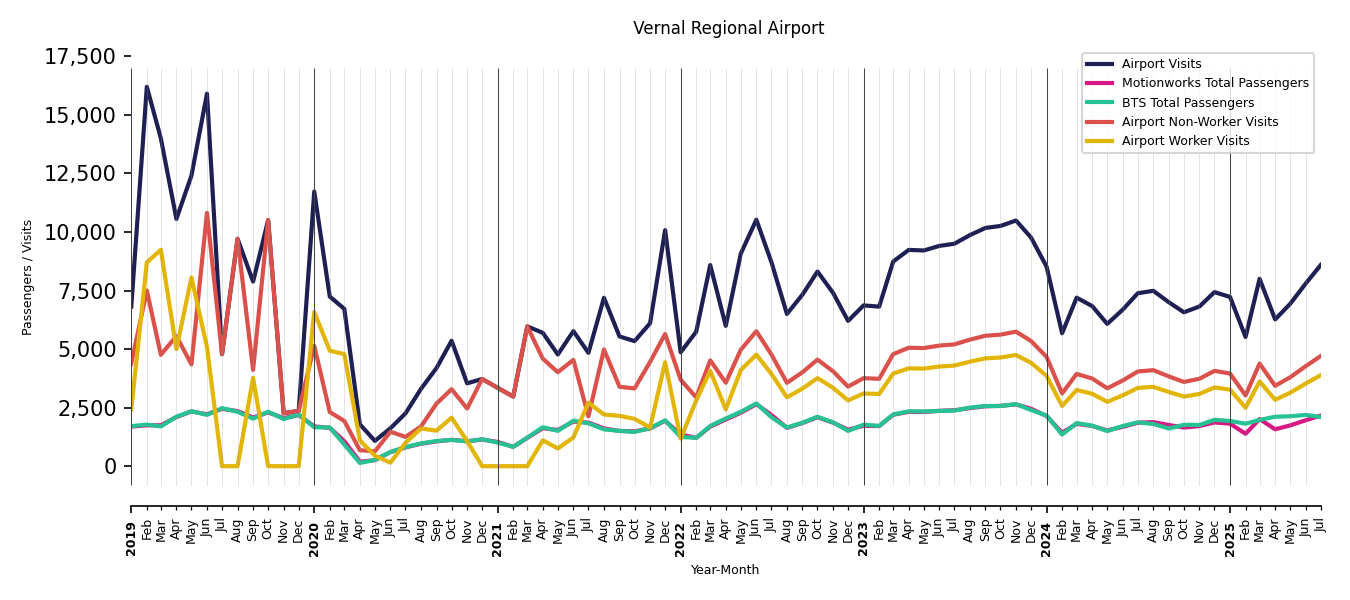
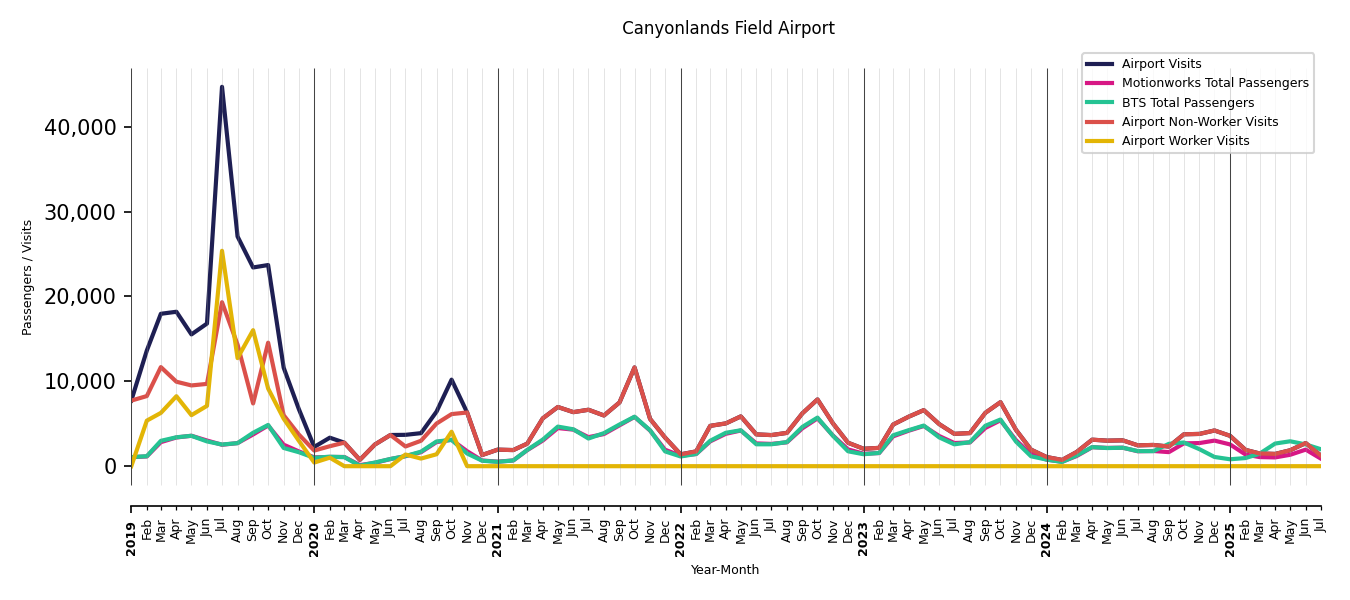
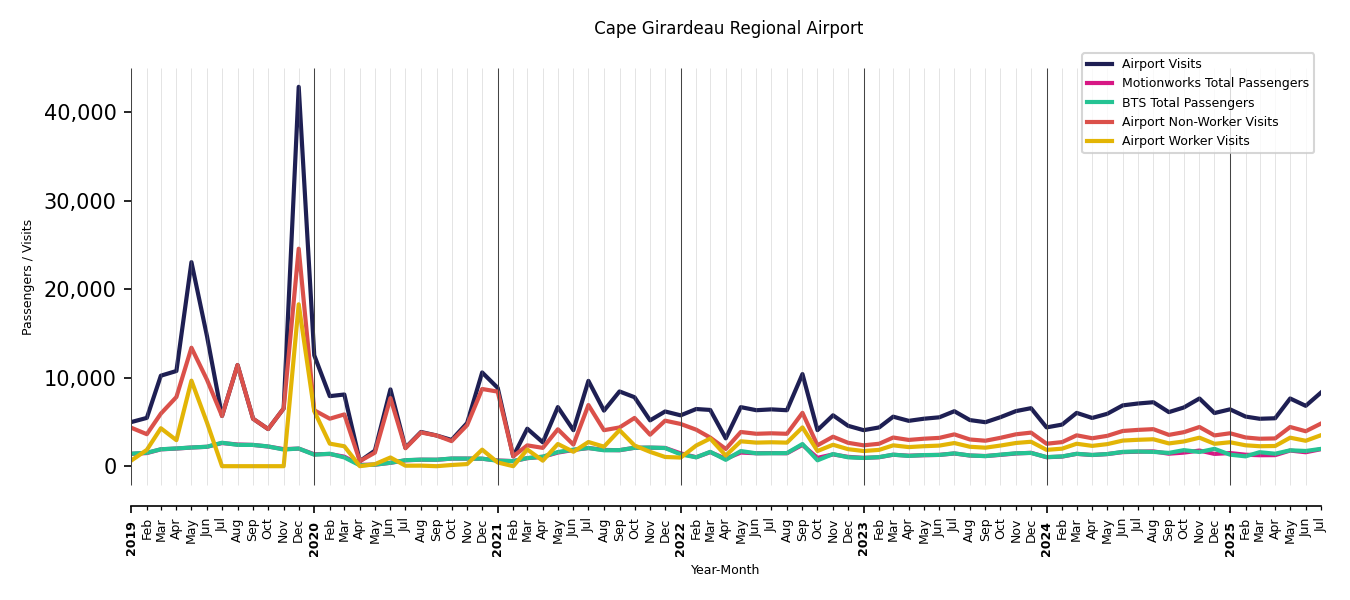
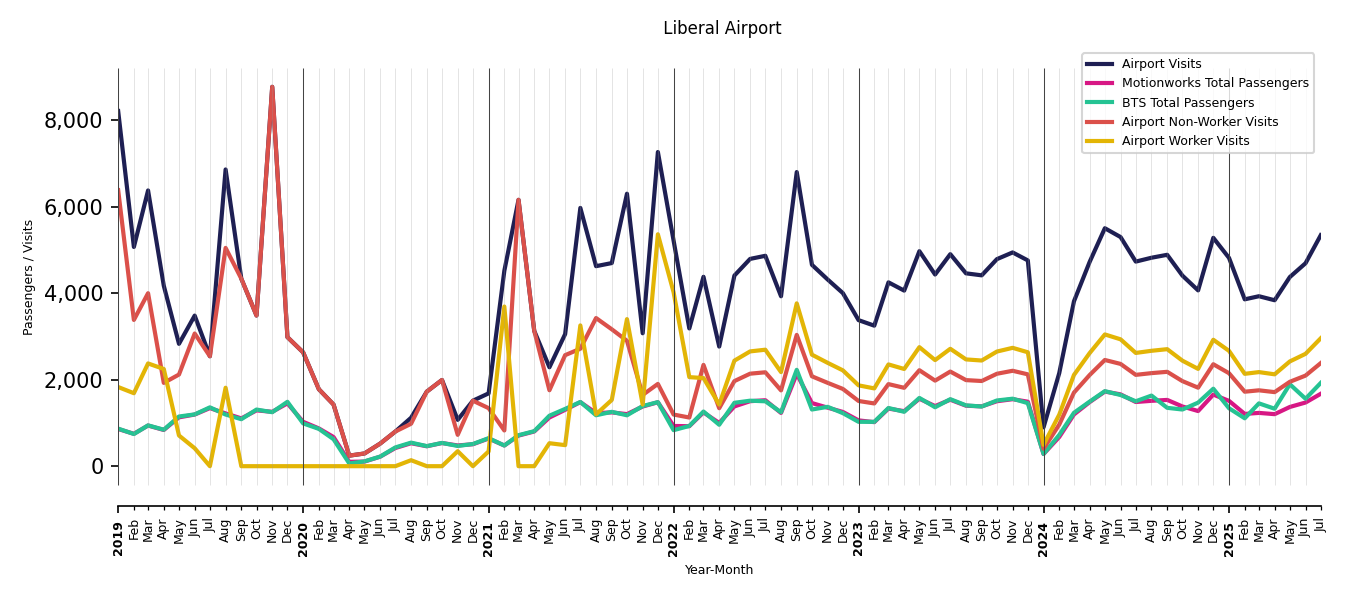
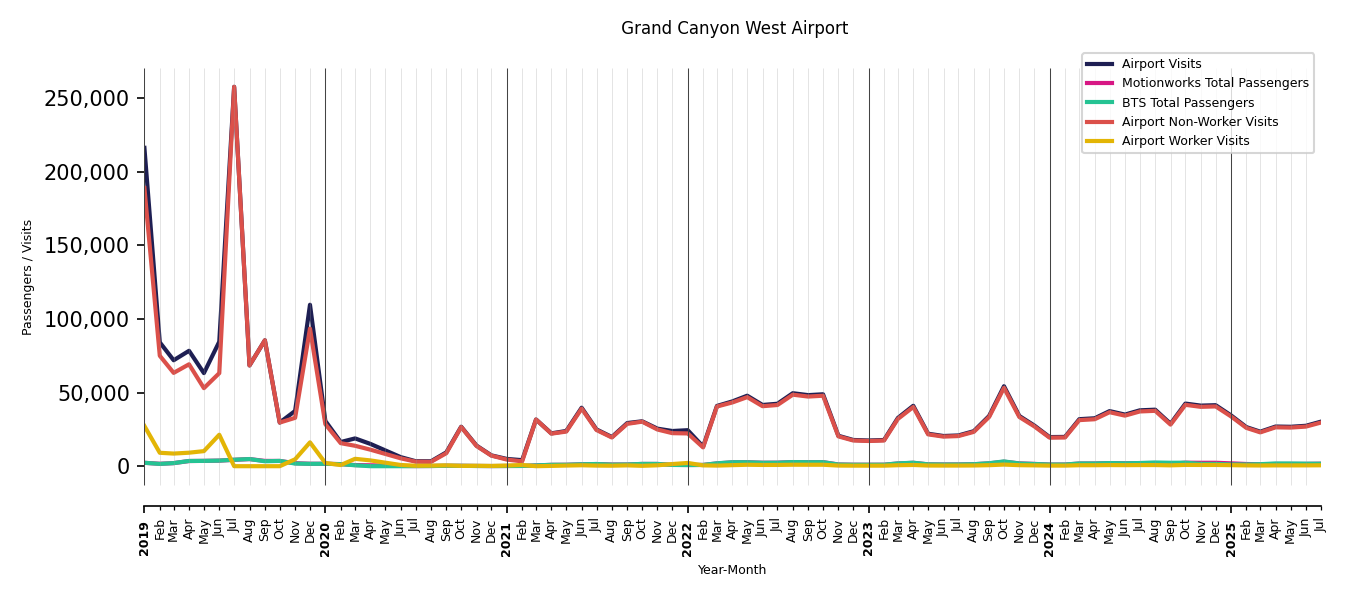
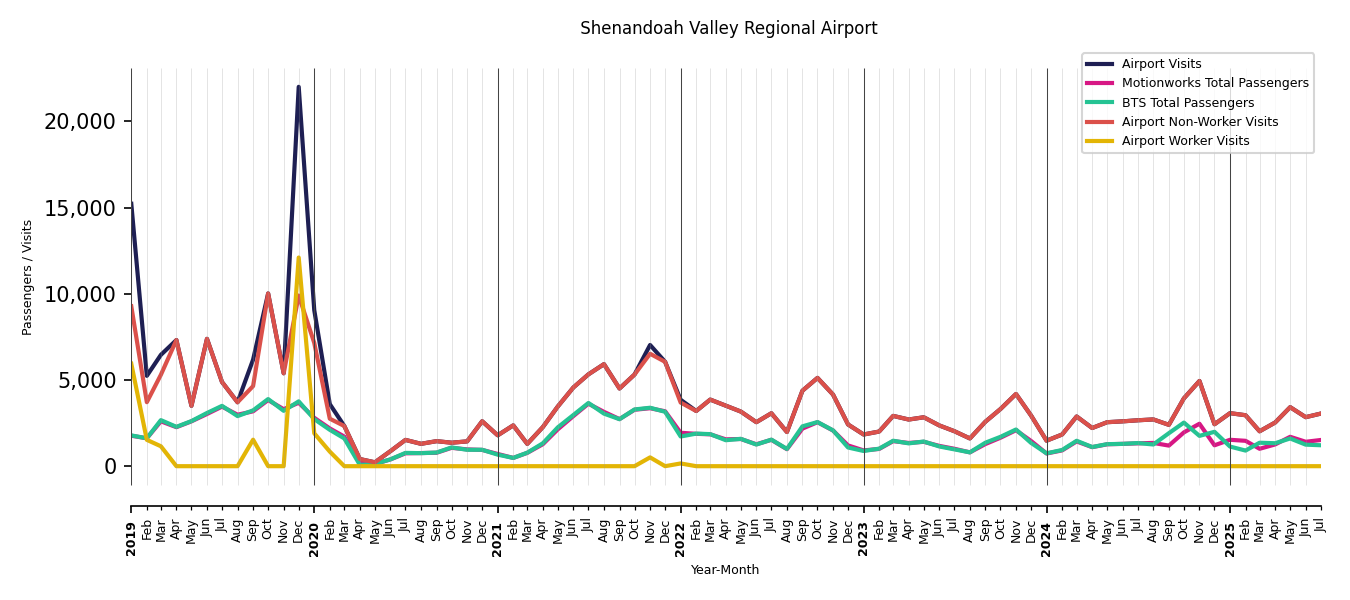
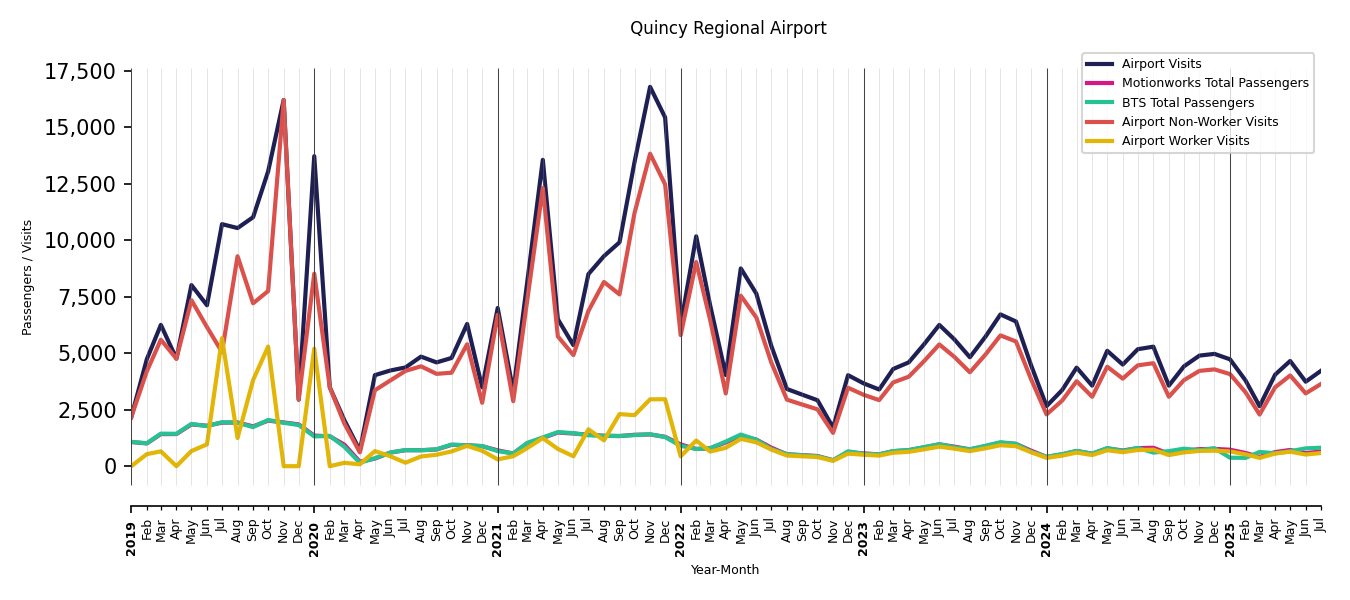
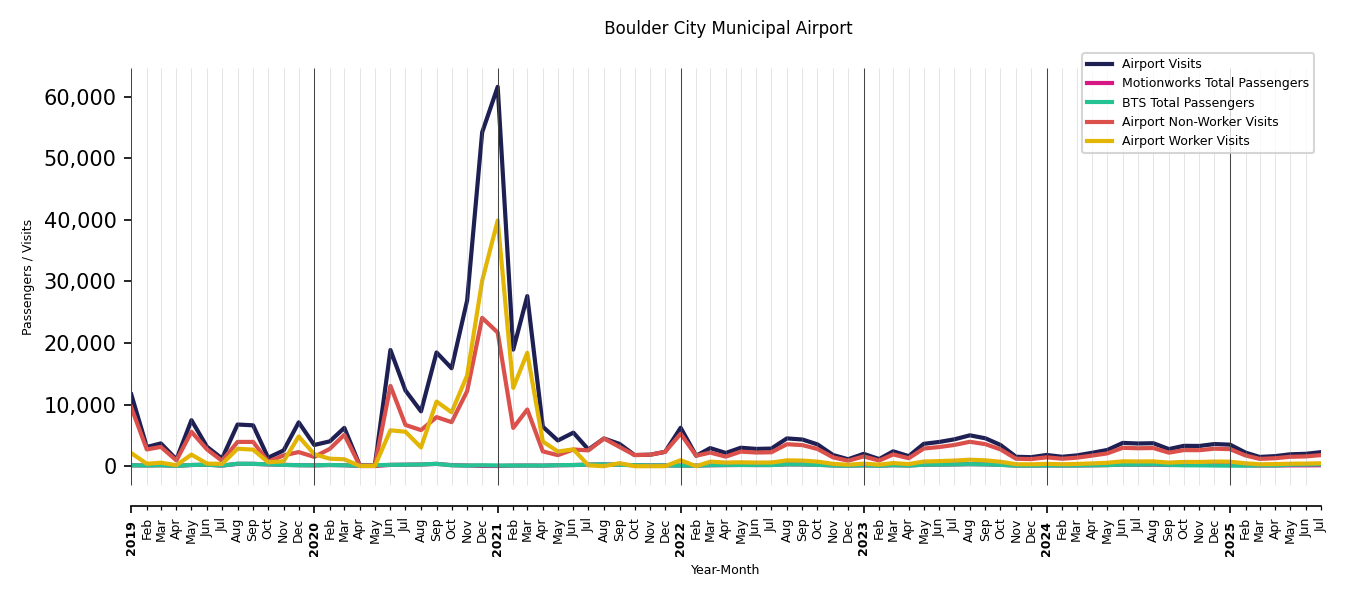
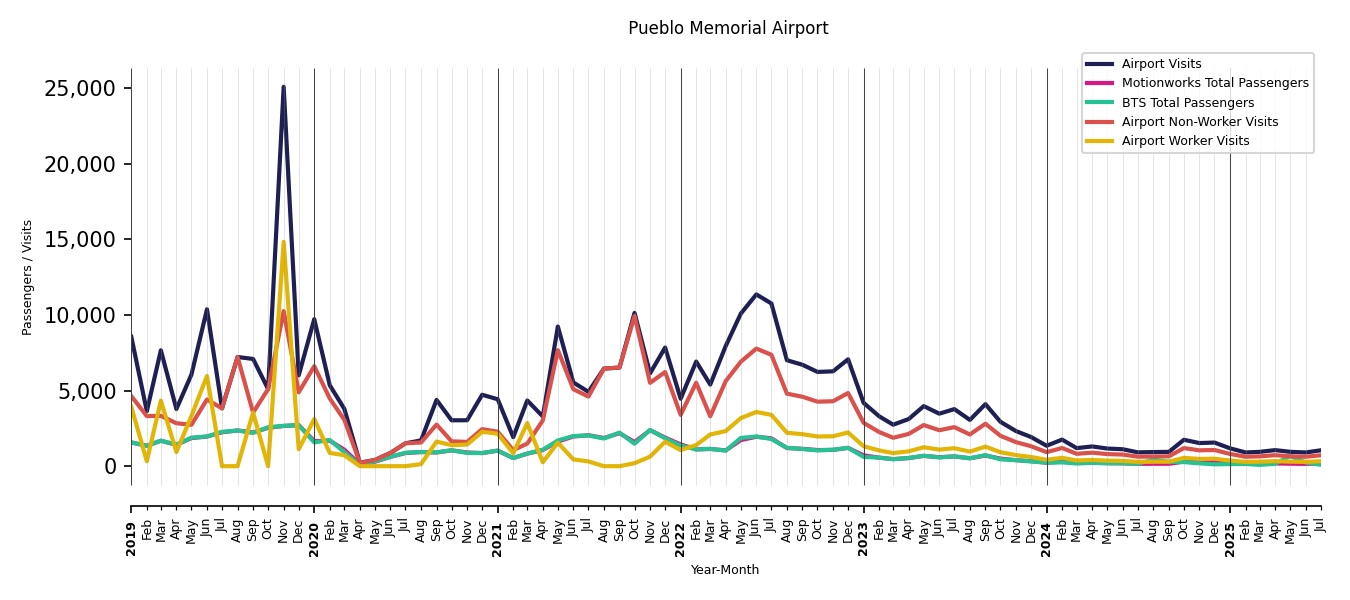
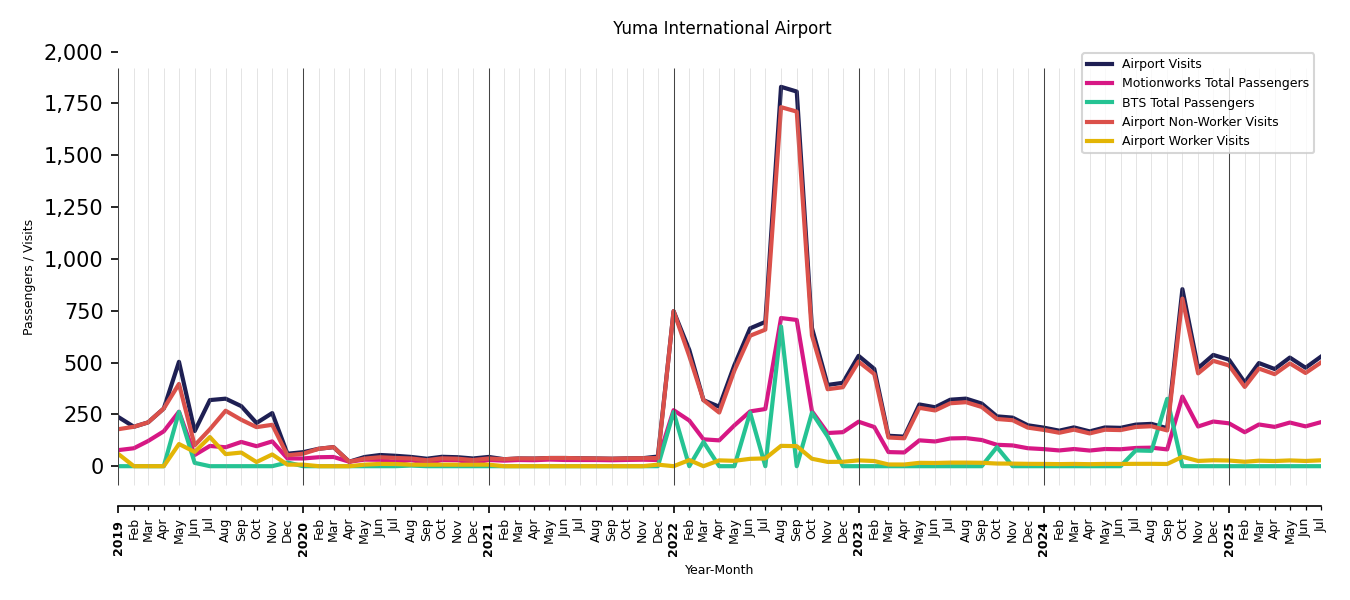
Airport Charts
Updated about 1 month ago