
Placecast™ Methodology Version 2.1
Place-base Methodology Version 2.1 improves the stability of places considered “noisy” such as small places (e.g., convenience stores, bars, restaurants) and places where the dwell times are typically short.
Place-base Methodology Version 2.1 improves the stability of places considered “noisy” such as small places (e.g., convenience stores, bars, restaurants) and places where the dwell times are typically short. This update aggregates visitations and dwells from different time periods (e.g., hourly, daily, monthly) and analyzes the scope of variation across these time periods. This provides more consistent and stable estimates of visits and dwells for Motionworks Places.
Finally, Motionworks is updating the Placecast™ specification to require reporting for each of hour of the day even if there are no visits. This specification update will resolve issues around whether missing records were a result of processing errors or whether missing records were accurate representations of zero visits as specified in the documentation.
For customers, these updates will result in fewer zeros or missing records and less unexplained variability in places that had previously demonstrated more extreme anomalies.
Background
In Placecast™ Version 2.0, some Motionworks places indicated too many or no visits at certain times of the day when visits would be expected. For example, the convenience store in the chart below shows visits as high as 4,000 people in some hours followed by periods of zero visits for hours when the store is open. While statistically correct according to the associated confidence intervals from the observed data, the reporting reduced the perceived reliability of the visits to these places from a user's perspective. In short, these places did not pass a user's intuition for “reasonableness.”
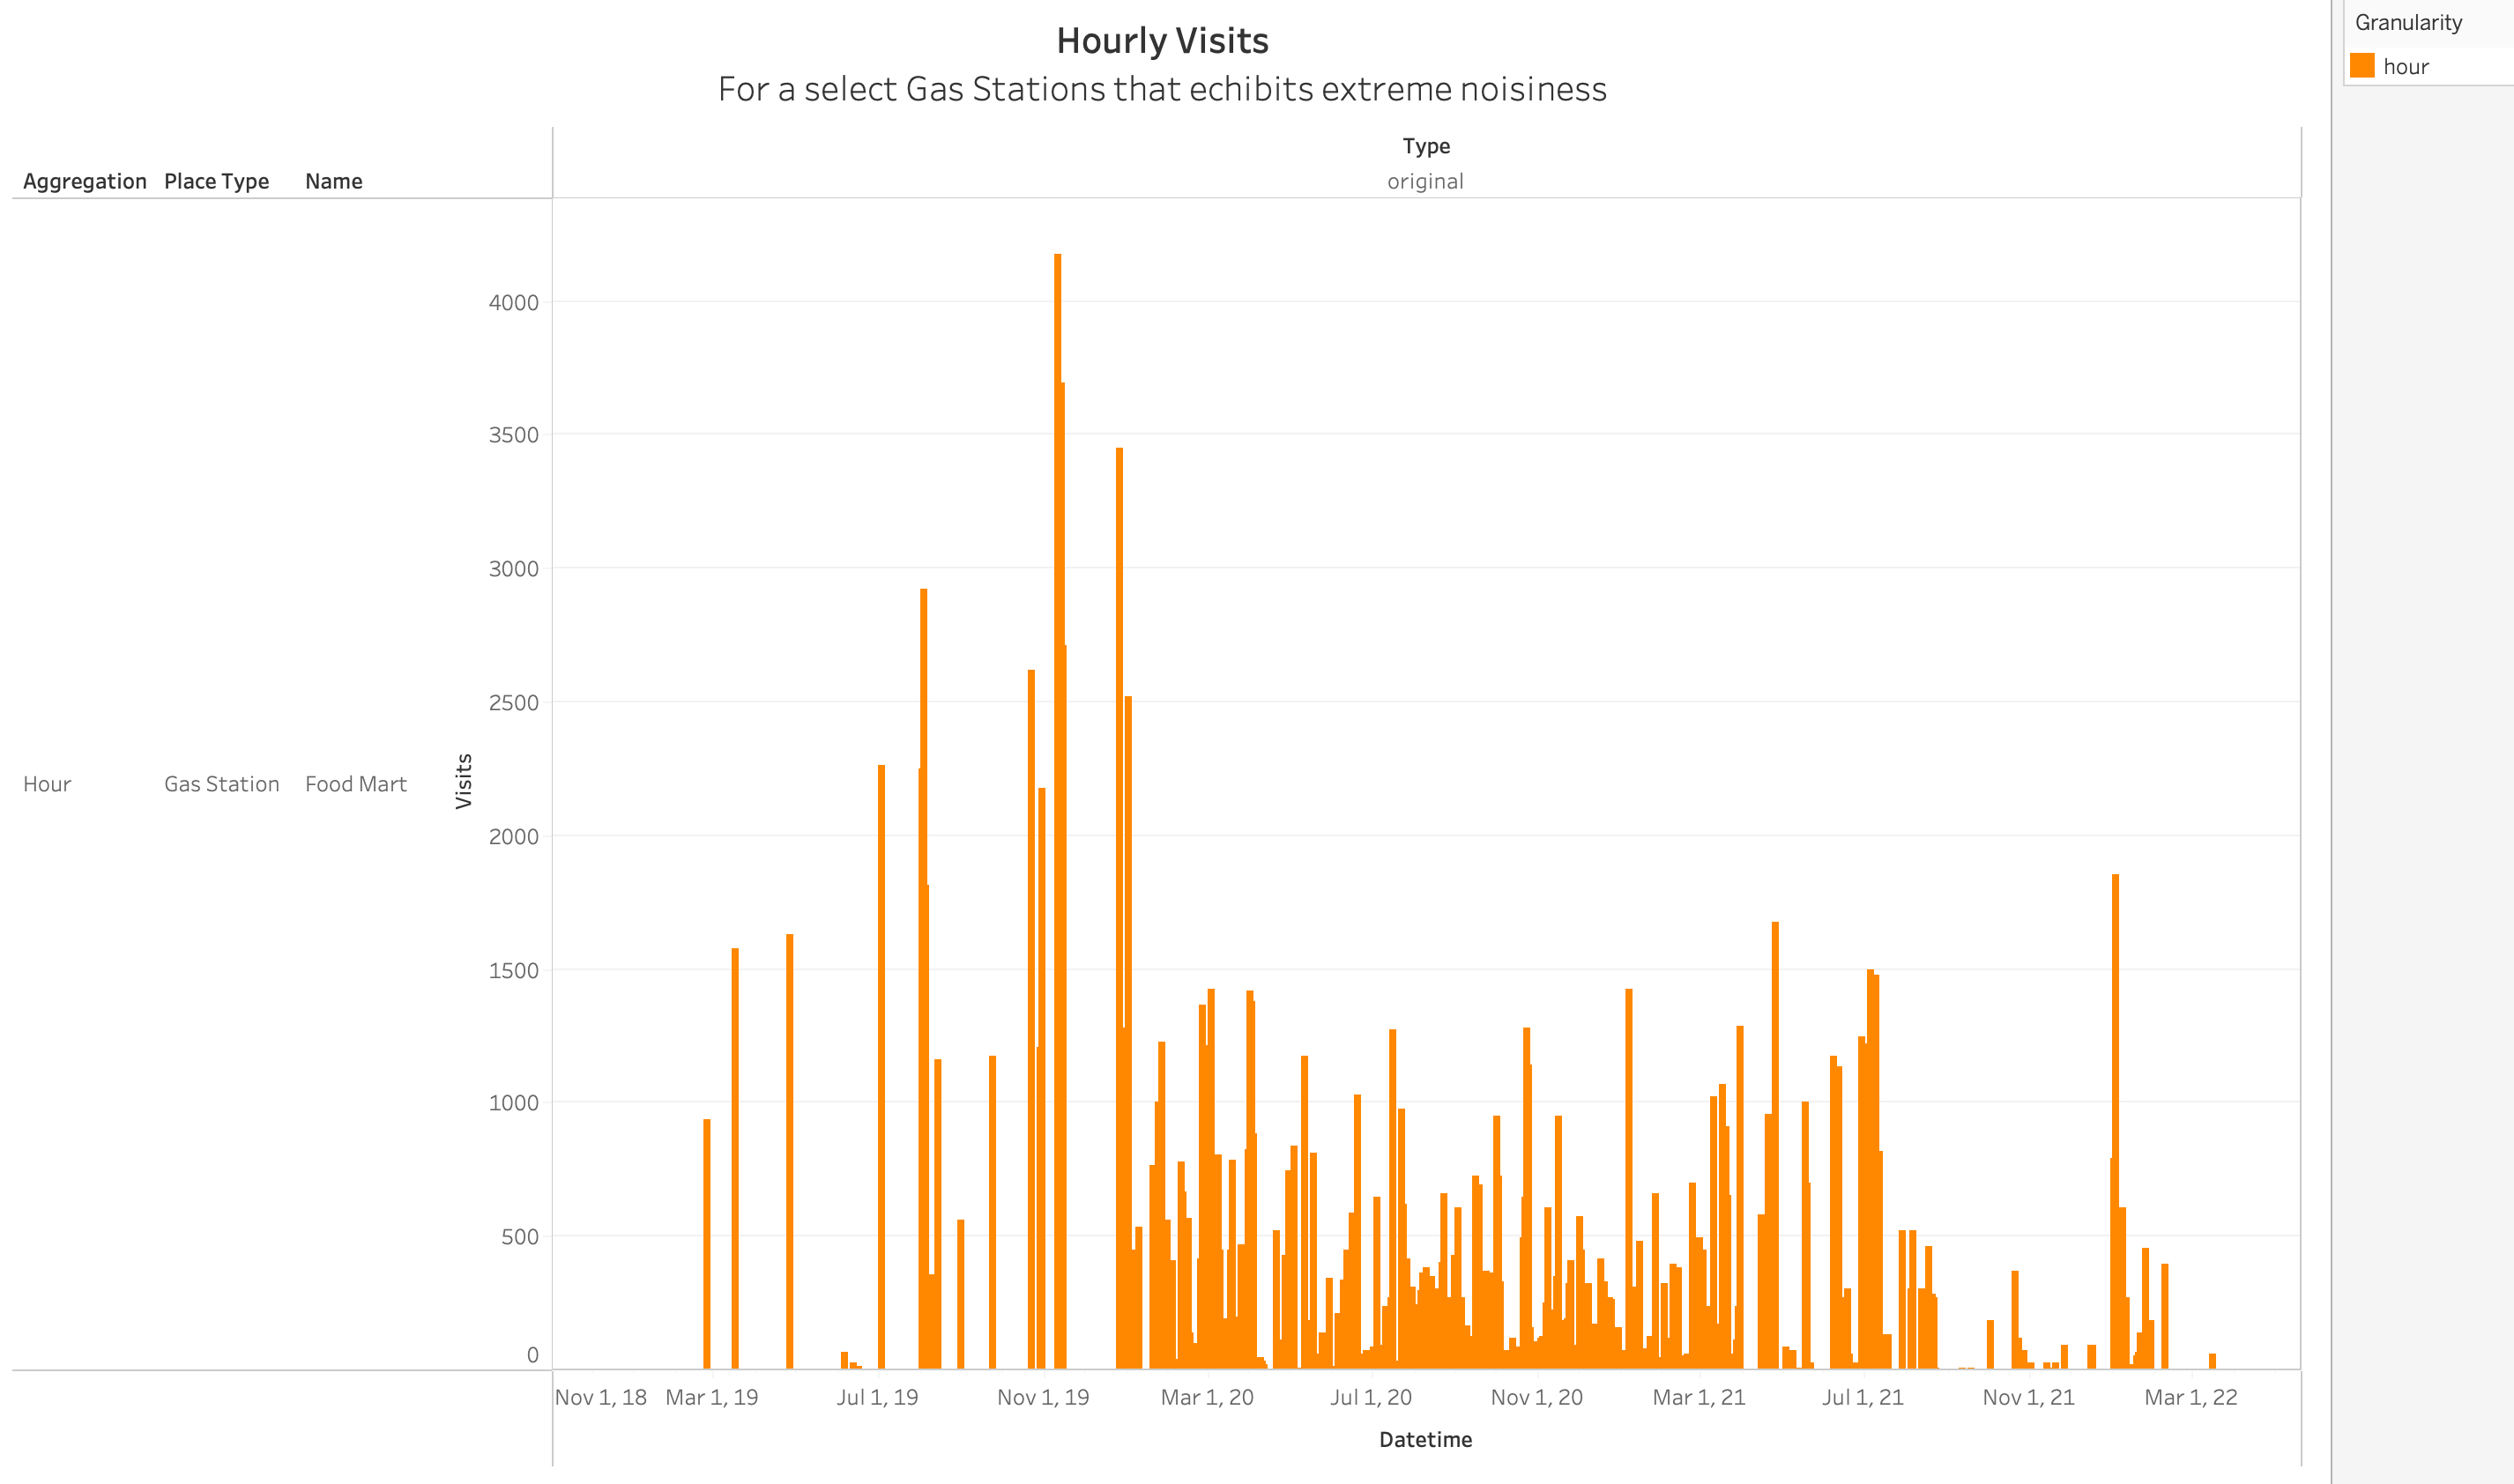
This issue also caused confusion in the Placecast™ deliveries. The Version 2.0 specification stated if a row of data is zero, it would be omitted from the delivery to reduce data storage and transfer costs. In the convenience store example above, this results in hours not being reported for some periods of the day. Given that visits to the store are likely to occur throughout the day, this specification led to confusion from customers about whether missing records were in error or whether Motionworks was reporting zero visits during the time period.
After an internal review of customer feedback, Motionworks implemented a Place Stability methodology in Version 2.1 and updated the Placecast™ delivery specification. At its core, Motionworks approached the updated methodology with the following guiding principle.
“At what level of granularity does Motionworks observe a normalized, stable visitation to this specific place?”
For example, are 100 people consistently observed at 2 pm on weekdays at this convenience store? If not, what about on Wednesdays generally? If not, what about in the entire week, month, season, or year?
If consistent visitation are observed on an hourly basis, then Motionworks will deliver those visitations. If hourly data is inconsistent for a place but the observations are consistent for the particular day type, Motionworks will deliver the daily number and use a normalized hourly profile for the place type. And if not, Motionworks will continue to search the chain of granularity - weekly, monthly, seasonal, and even yearly for the smallest locations - until a stable suitable estimate is identified for a place type.
Place Stability Methodology
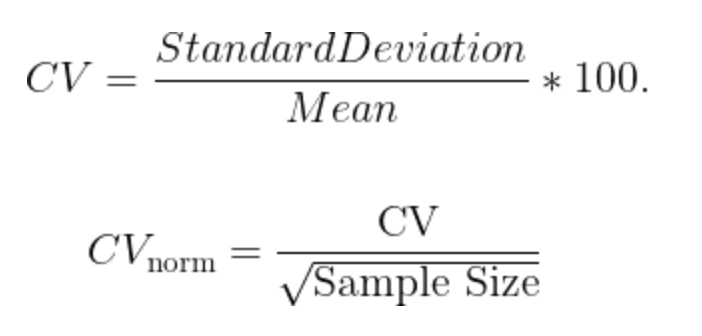
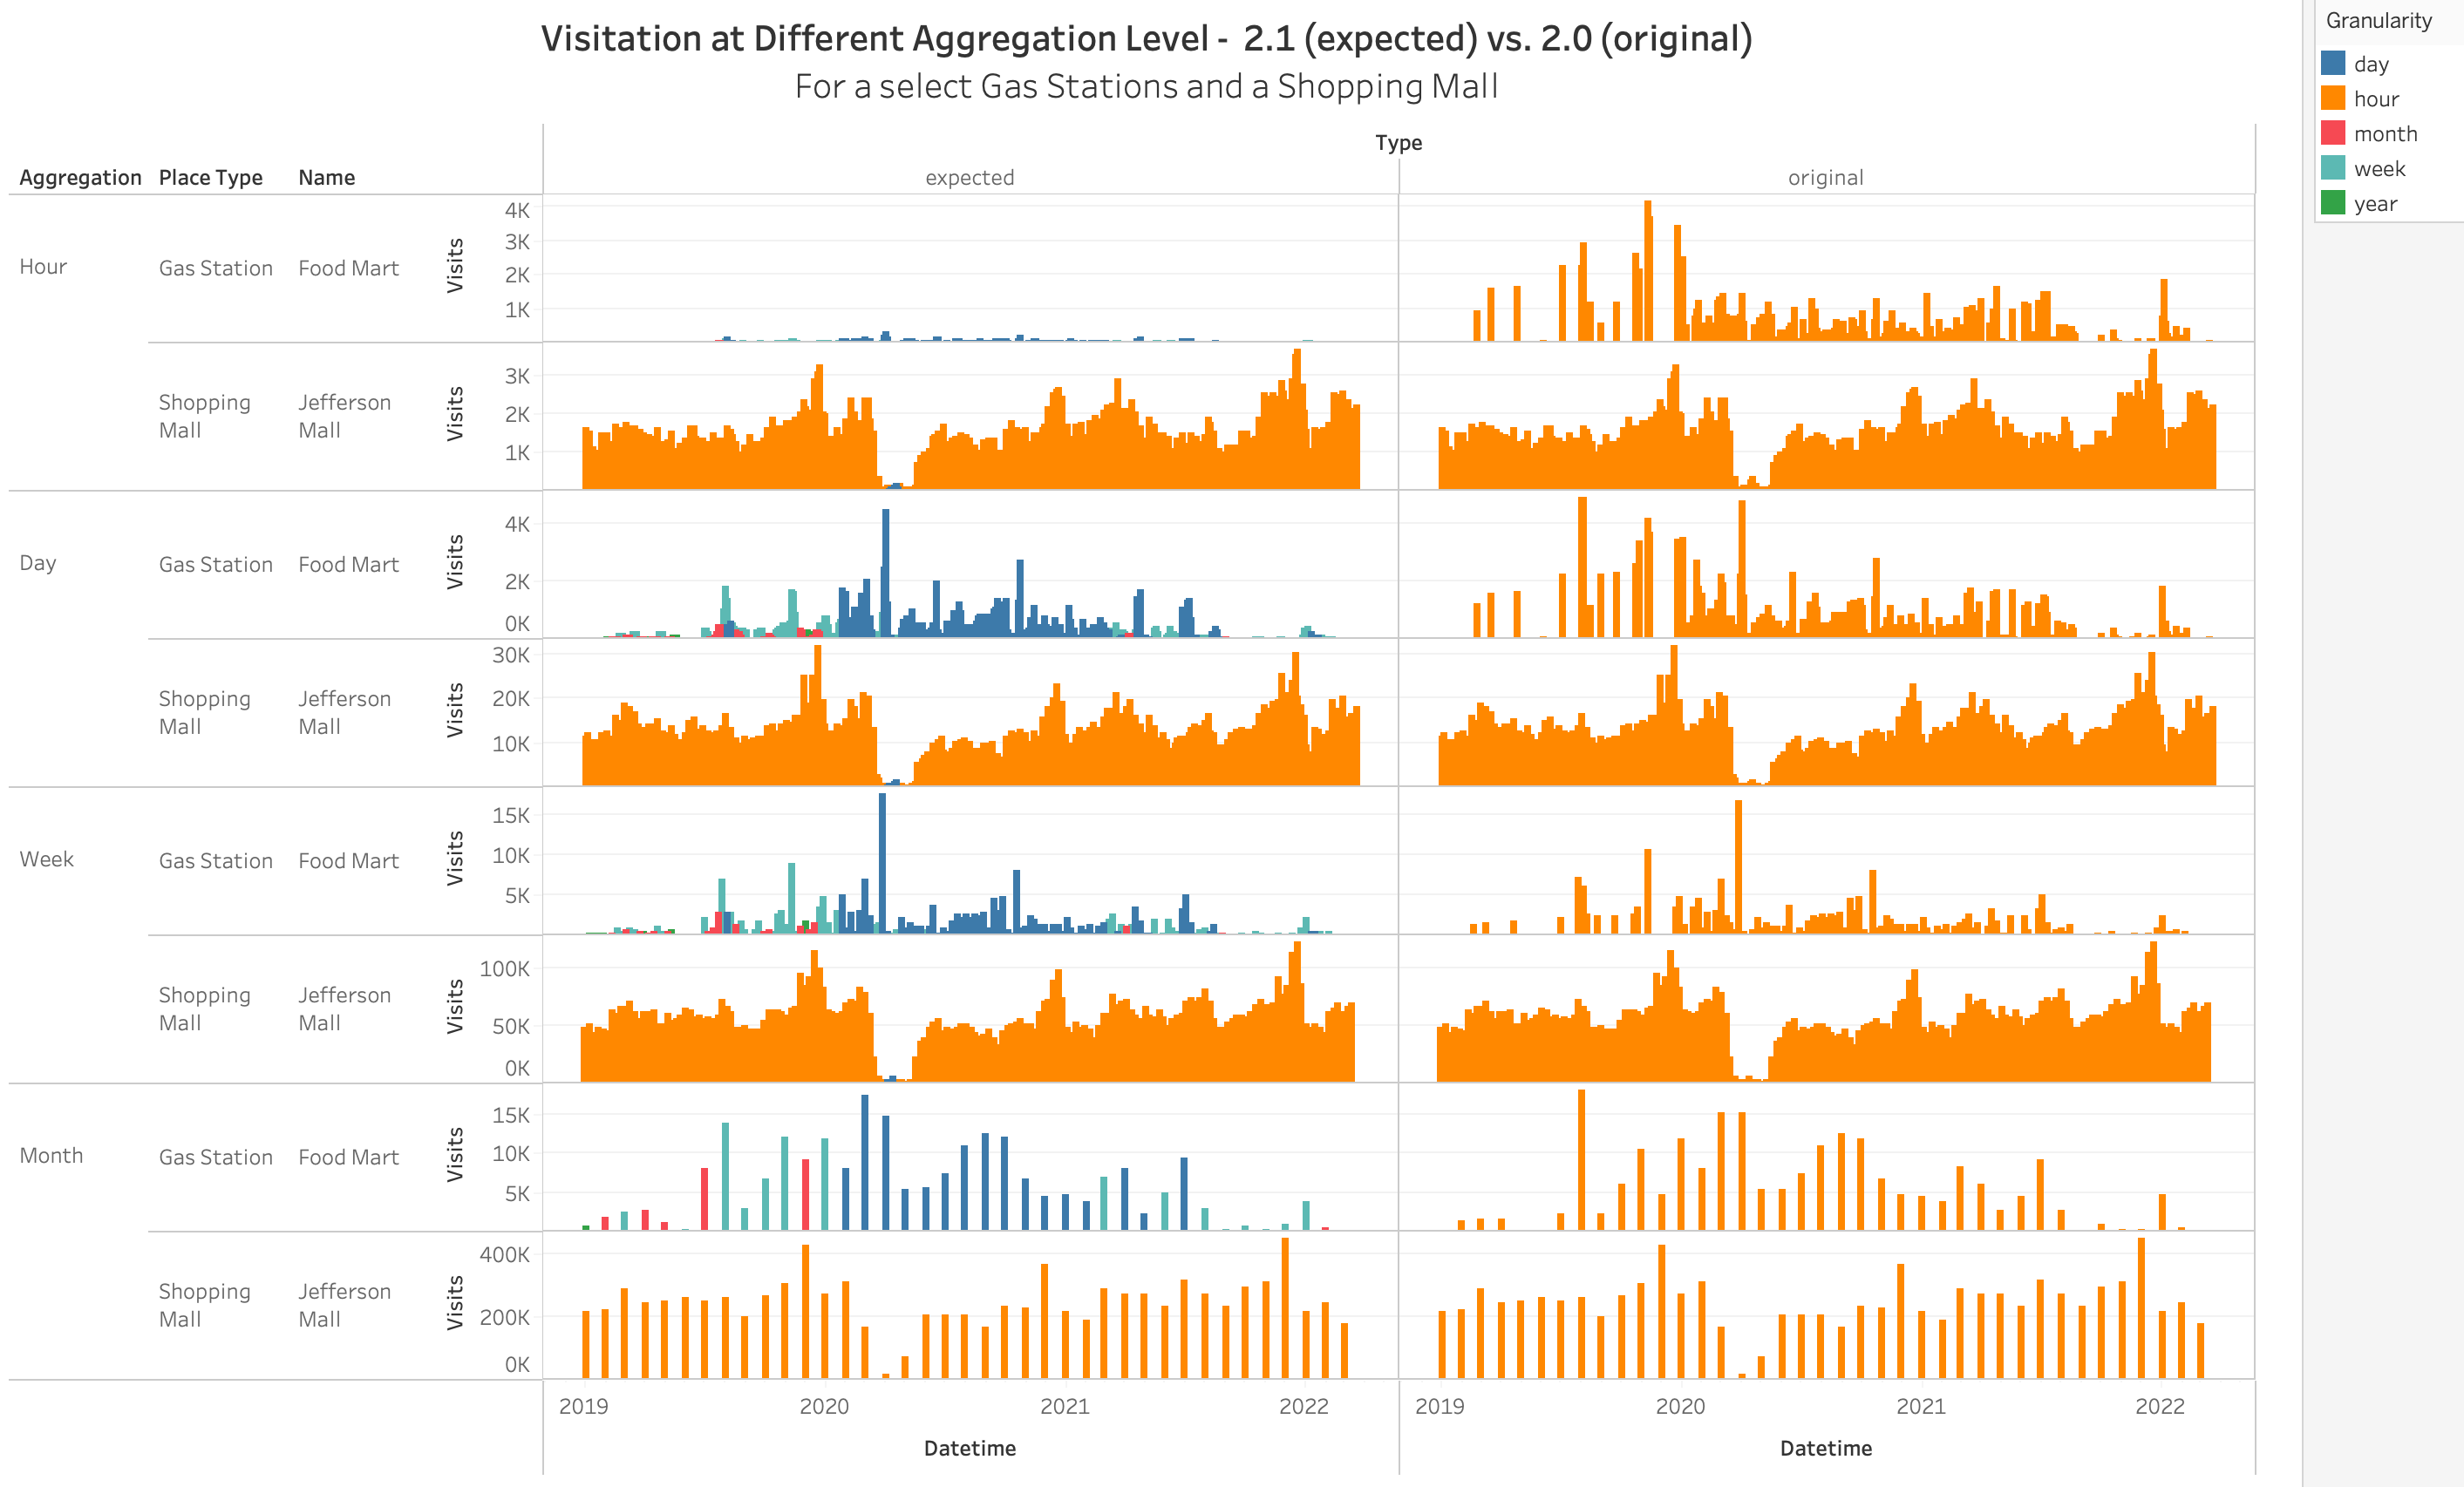
Motionworks uses the Coefficient of Variation (CV) to measure visitation (and in case of airports, also observed airport arrivals/departures/transfers) stability at a place. The Coefficient of Variation measures observed spread from the average. It is a unitless number, and it is best applied to absolute or ratio numbers where 0 is the lower bound of data. The CV is calculated by dividing the standard deviation of the numbers by the mean (average) and then multiplying by 100 to express it as a percentage, and then normalized by the sample size.
The coefficient of variation describes the consistency or stability of the visits and dwell to a place. A lower CV indicates less variation and greater stability, while a higher CV suggests more variability and less stability in the data. In the context of the Place-Based Methodology, the CV is used to assess the stability of visitation numbers at different periods to determine the reliability of the reporting.
A higher coefficient of variation can be caused by two different principles in the data. First, and easiest to understand, is that the coefficient of variation will expand as the spread of observed values increases. Second, and just as useful, the coefficient of variation grows as the mean (or average) observed activity approaches 0.
The table below represents this phenomenon across two different types of distributions. In Example 1, the standard deviation is large. As a result, the coefficient of variation for Example 1 is calculated as 86.1 percent. In contrast, the standard deviation is relatively small indicating a fairly stable set of observations. However, because the mean is also relatively low, the coefficient of variation for Example 2 is 86.5 percent - nearly identical to Example 1. These examples highlight the strength of the coefficient of variation for flagging both widely distributed observations and places with relatively few observations.
| Statistic | Example 1 | Example 2 |
|---|---|---|
| Sample Observed Hourly Visits | [0,10,25,100,125,150,200,250,250,250,500] | [0,0,0,1,1,1,1,1,2,2,3] |
| Mean Visits | 169.1 | 1.1 |
| Standard Deviation of Visits | 145.5 | 0.9 |
| Coefficient of Variation | 86.1% | 86.5% |
Time References
Motionworks evaluates the coefficient of variation across six different time intervals.
- Hourly: looking at visits at the same hour of the same day of the week (five weeks backward)
- Daily: looking at total visits over the 24 hour band around the hour (11 hour backward and 12 hour forwards) of the week, compared to the same value for the hour of the day (five weeks backward)
- Weekly: Same as above with only difference of looking at 680 (=24 x 7) hour band around the hour.
- Monthly: Same as above with only difference of looking at 720 (=24 x 30) hour band around the hour.
- Seasonal: Same as above with only difference of looking at 2160 (=24 x 30 x 3) hour band around the hour.
- Yearly: Same as above with only difference of looking at 8760 (=24 x 365) hour band around the hour.
Then, when reporting the visitation pattern for each individual week, Motionworks checks the coefficient of variation for each possible reporting level. This helps determine, if Motionworks published a daily number over this week, what would be the average variation presented hour-by-hour throughout the week versus the normalized hours considering other similar places in the area. Again, the smallest reporting level is used which produces stable results. If hourly satisfies this, Motionworks uses hourly; if not, Motionworks reports daily, and so on. This process guarantees a stable and reliable number for that place.
Methodology in Practice
Below is an example of the new methodology. The colors show the reporting granularity changing for different weeks through time. For example, blue shows when the daily data for that week are being reported, whereas teal indicates the weekly data are being used as the foundation.
A shopping mall (lower panels on the chart) that is originally stable by hour throughout its history, does not change much at any of the aggregation levels. However, for a small gas station (upper panels on the chart) that is very unstable, reporting in some extreme cases more than 4,000 visits in an hour, the impact becomes more pronounced. The visits become more stable, the individual hourly anomalies go away, and the peak hours come down to no more than a couple of hundred visits at the hourly level. The stability improvement is also visible if when looked at the daily aggregation level. The weekly/monthly visitations have remained fairly stable and consistent across both methodologies.
Confidence Interval
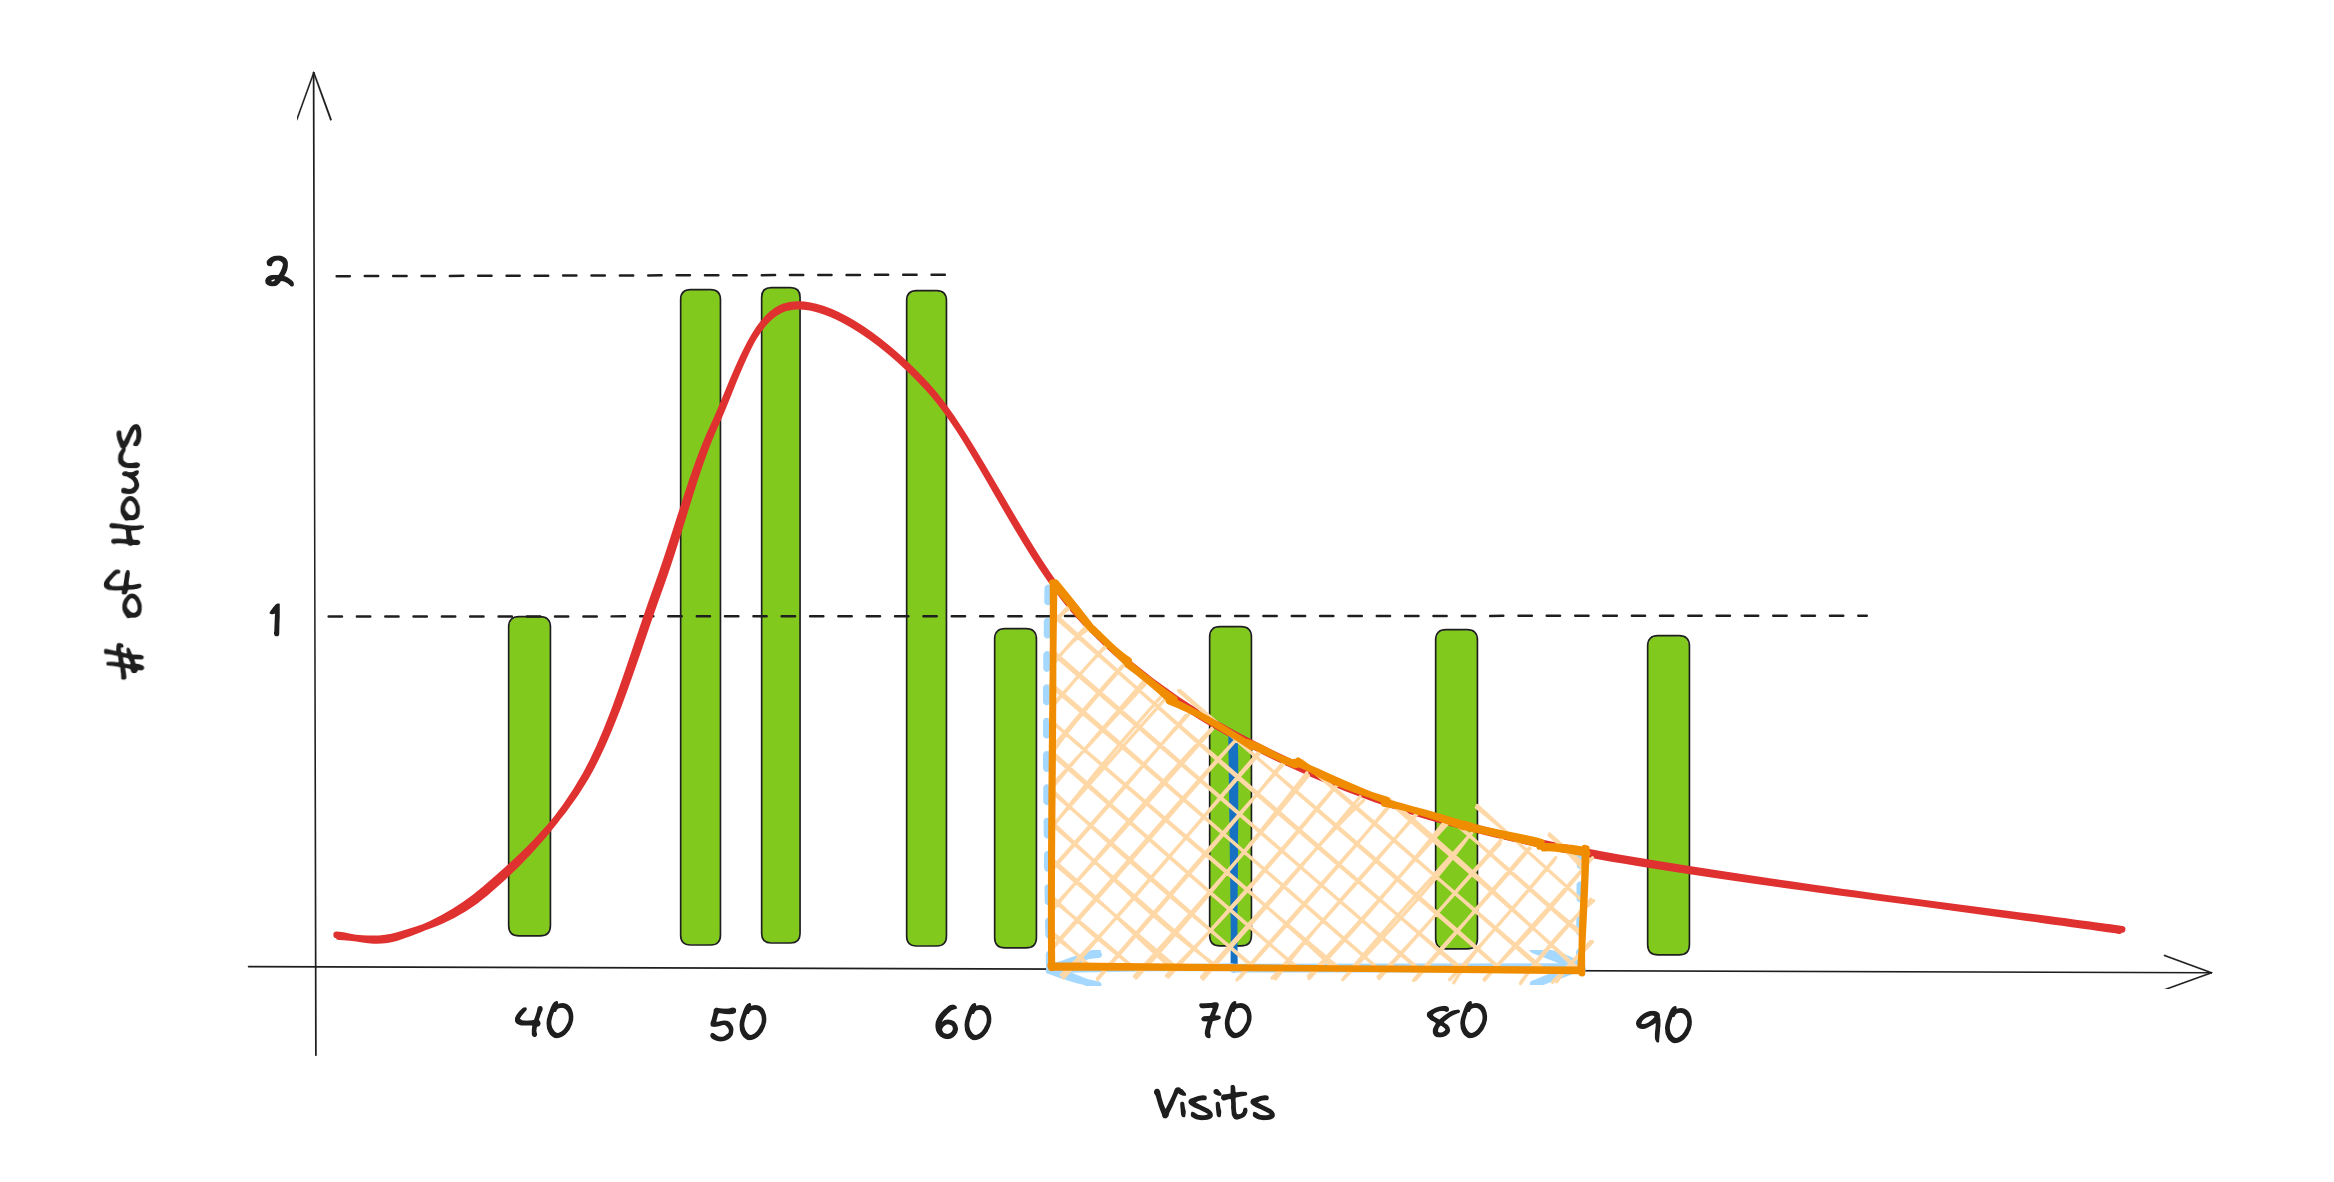
As the numbers are put into context within a distribution based on the previous and next five weeks, a confidence band around the values can be created. Consider a place that has had the following visits at 9AM on Tuesdays for five weeks before and after.
40, 48, 48, 52, 52, 58, 58, 62, 70, 80, 90
Looking at the 70 visit value, can confidence in that value for that particular week be measured?
For this example, let's assume the coefficient of variation for these set of numbers are low enough that the algorithm reports an hourly granularity for this place at this hour of the week. The green histogram below represents these numbers, and based on the histogram we can interpolate a continuous distribution for visitations at 9AM on a Tuesday for the week (red line). Once the distribution is identified, then a band of confidence is built around each visitation that resembles how confident we are about each value. For instance, 50% confidence interval around the number 70 is marked by the orange shaded area, where it’s surface area is 0.5 and is centered around our value. This tells us that the confidence interval for the number 70 is between 64 and 85. Doing this for all hours of each week and summing up the intervals gives us an estimate around each weekly visitation number. Motionworks builds 50, 75, and 95% confidence intervals for each reported weekly visitation number.
Validation
Reduction of Missing Hours
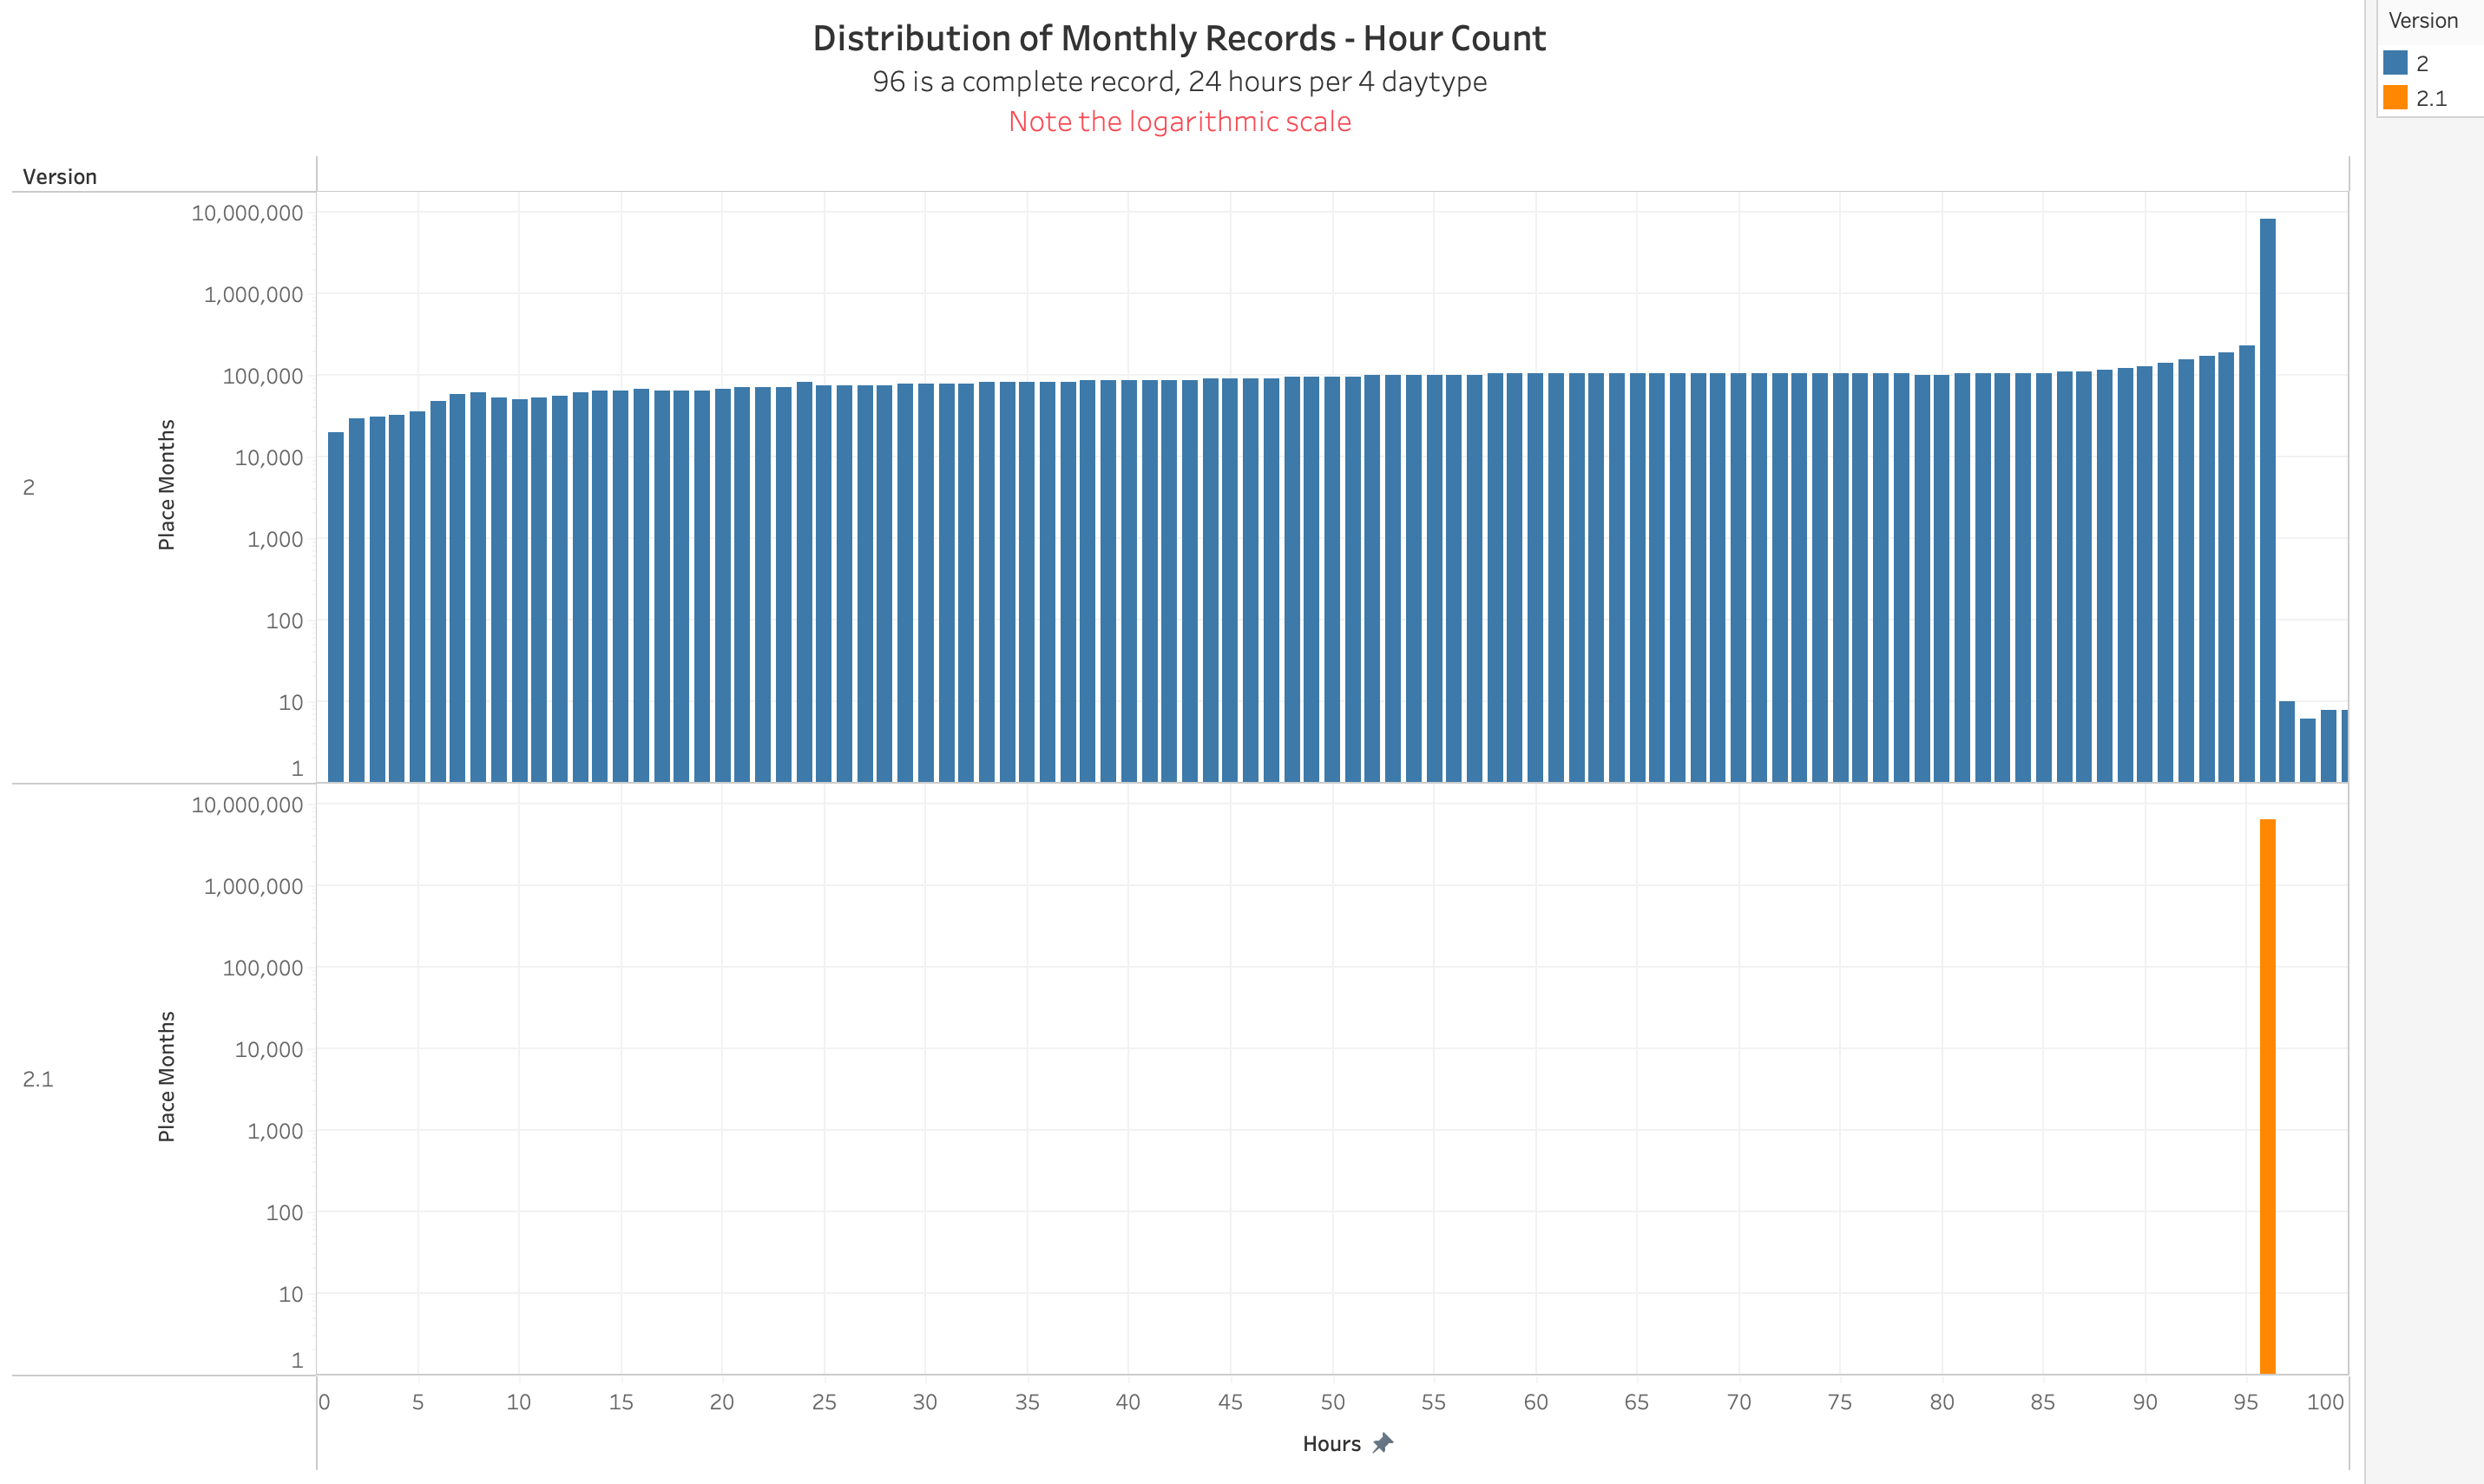
For a given month across all day types, Motionworks reports 96 total hourly visits and dwells. This represents 24 hours across 4 day types (i.e., weekday, Friday, Saturday, and Sunday). The histograms below show the range of hours reporting in Placecast 2.0 compared to Placecast 2.1. In Version 2.0, Motionworks reported approximately 20 hours across all day types with a spread across all possible combination of hours between 0 and 96. In Version 2.1, Motionworks is reporting all places with 96 hours of data. Note that some places may return NULL measurement values for certain hours. These hours are being suppressed for privacy purposes at those places.
Months Coverage
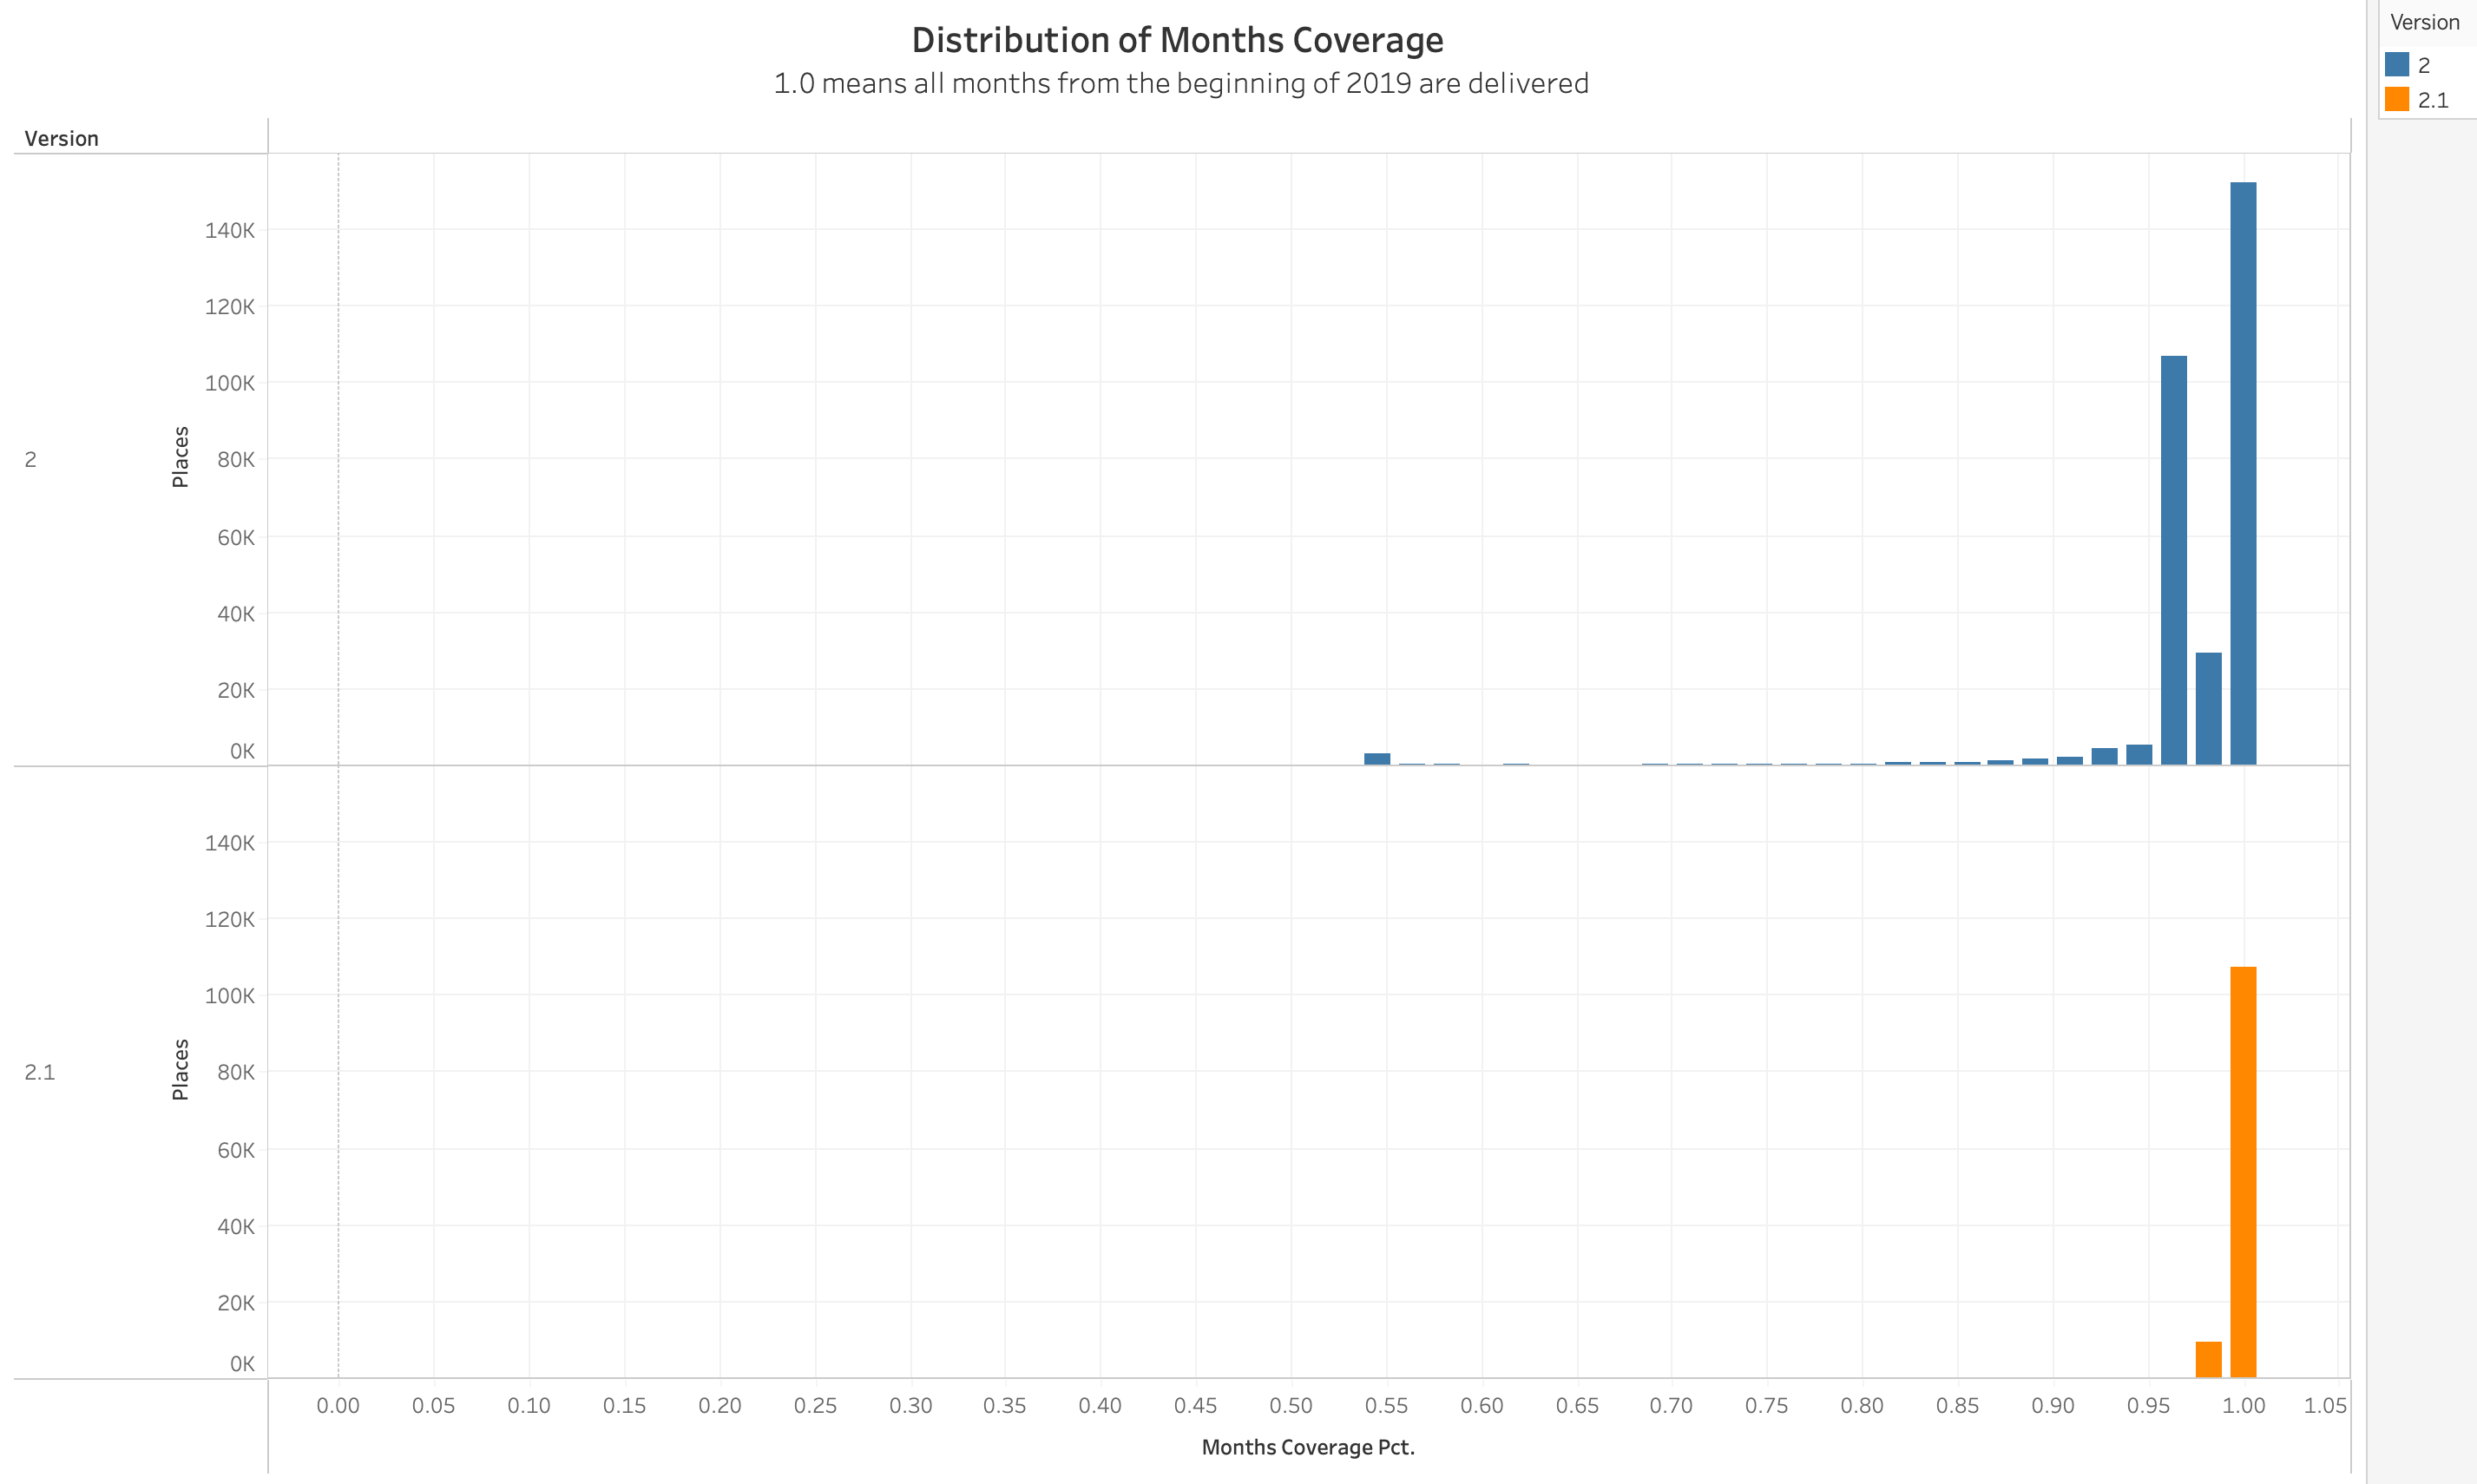
In addition, Version 2.1 has complete coverage over all months since the beginning of 2019. This was not the case for Version 2.0. The figure below shows the distribution of the months coverage (as a percentage). All places, except around 9,000 medical offices have full coverage. Medical offices specifically are being delayed since the beginning of July 2023 as Motionworks collaborates with its data partners around new medical privacy standards being implemented in certain states.
Weekly Visits Changes
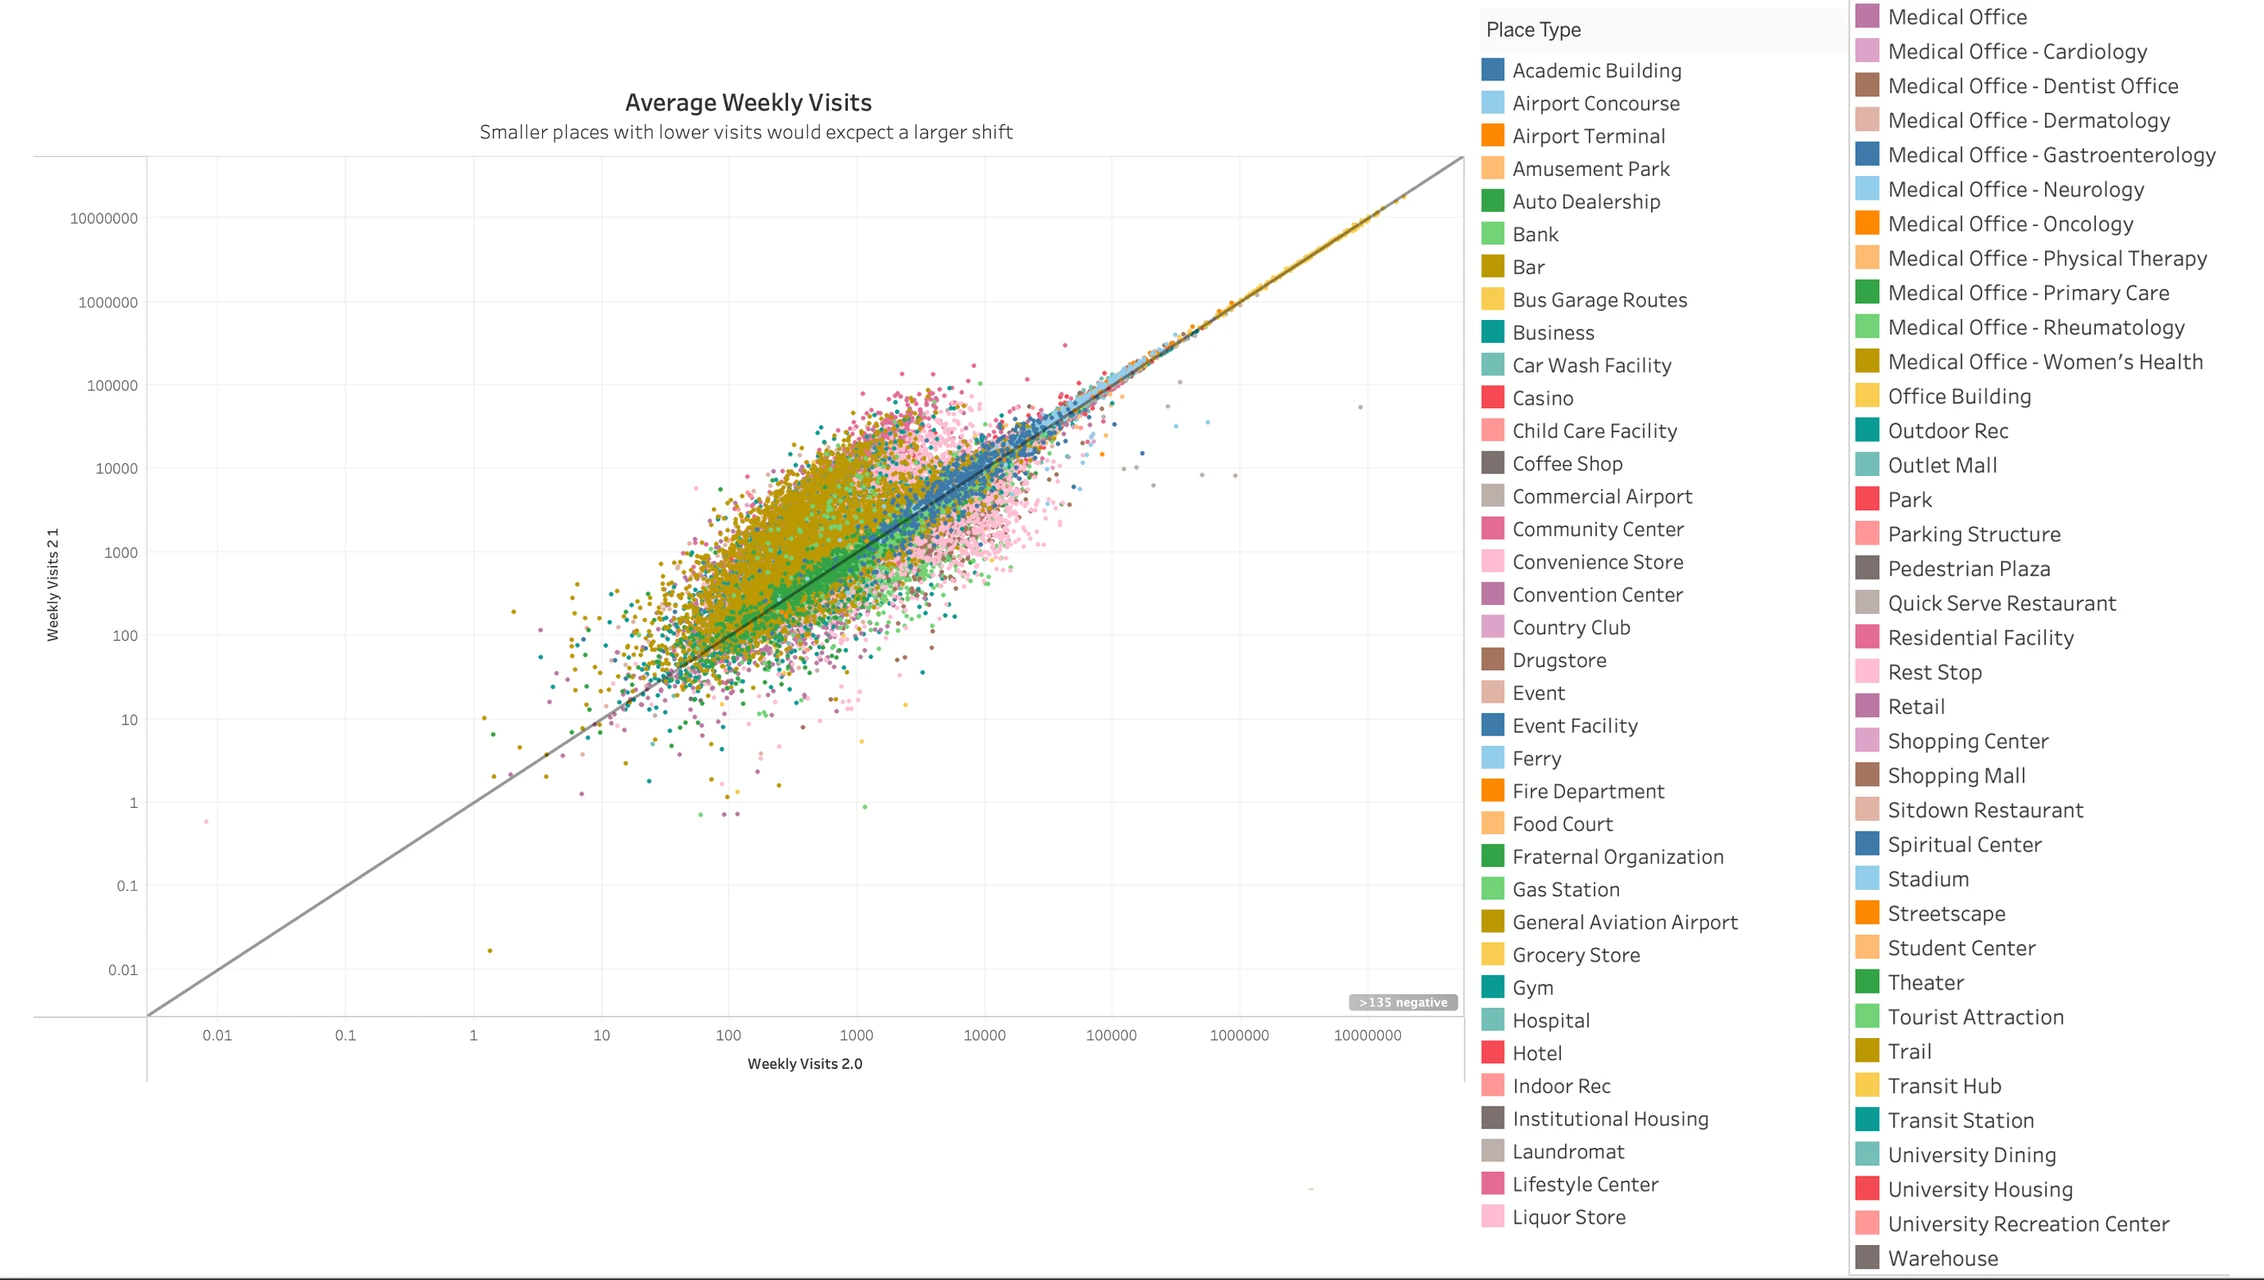
The two graphs below show the shift in the average weekly visits from Version 2.0 to Version 2.1 methodology. The graph show the change in Average Weekly Visits between the old (Version 2.0) and new (Version 2.1) methodology. Reflective of the discussion above, places with fewer visits have the largest shift in reported visits in the Placecast 2.1 methodology. These are the places most likely to have high coefficient of variations at the hourly, daily, and weekly level.
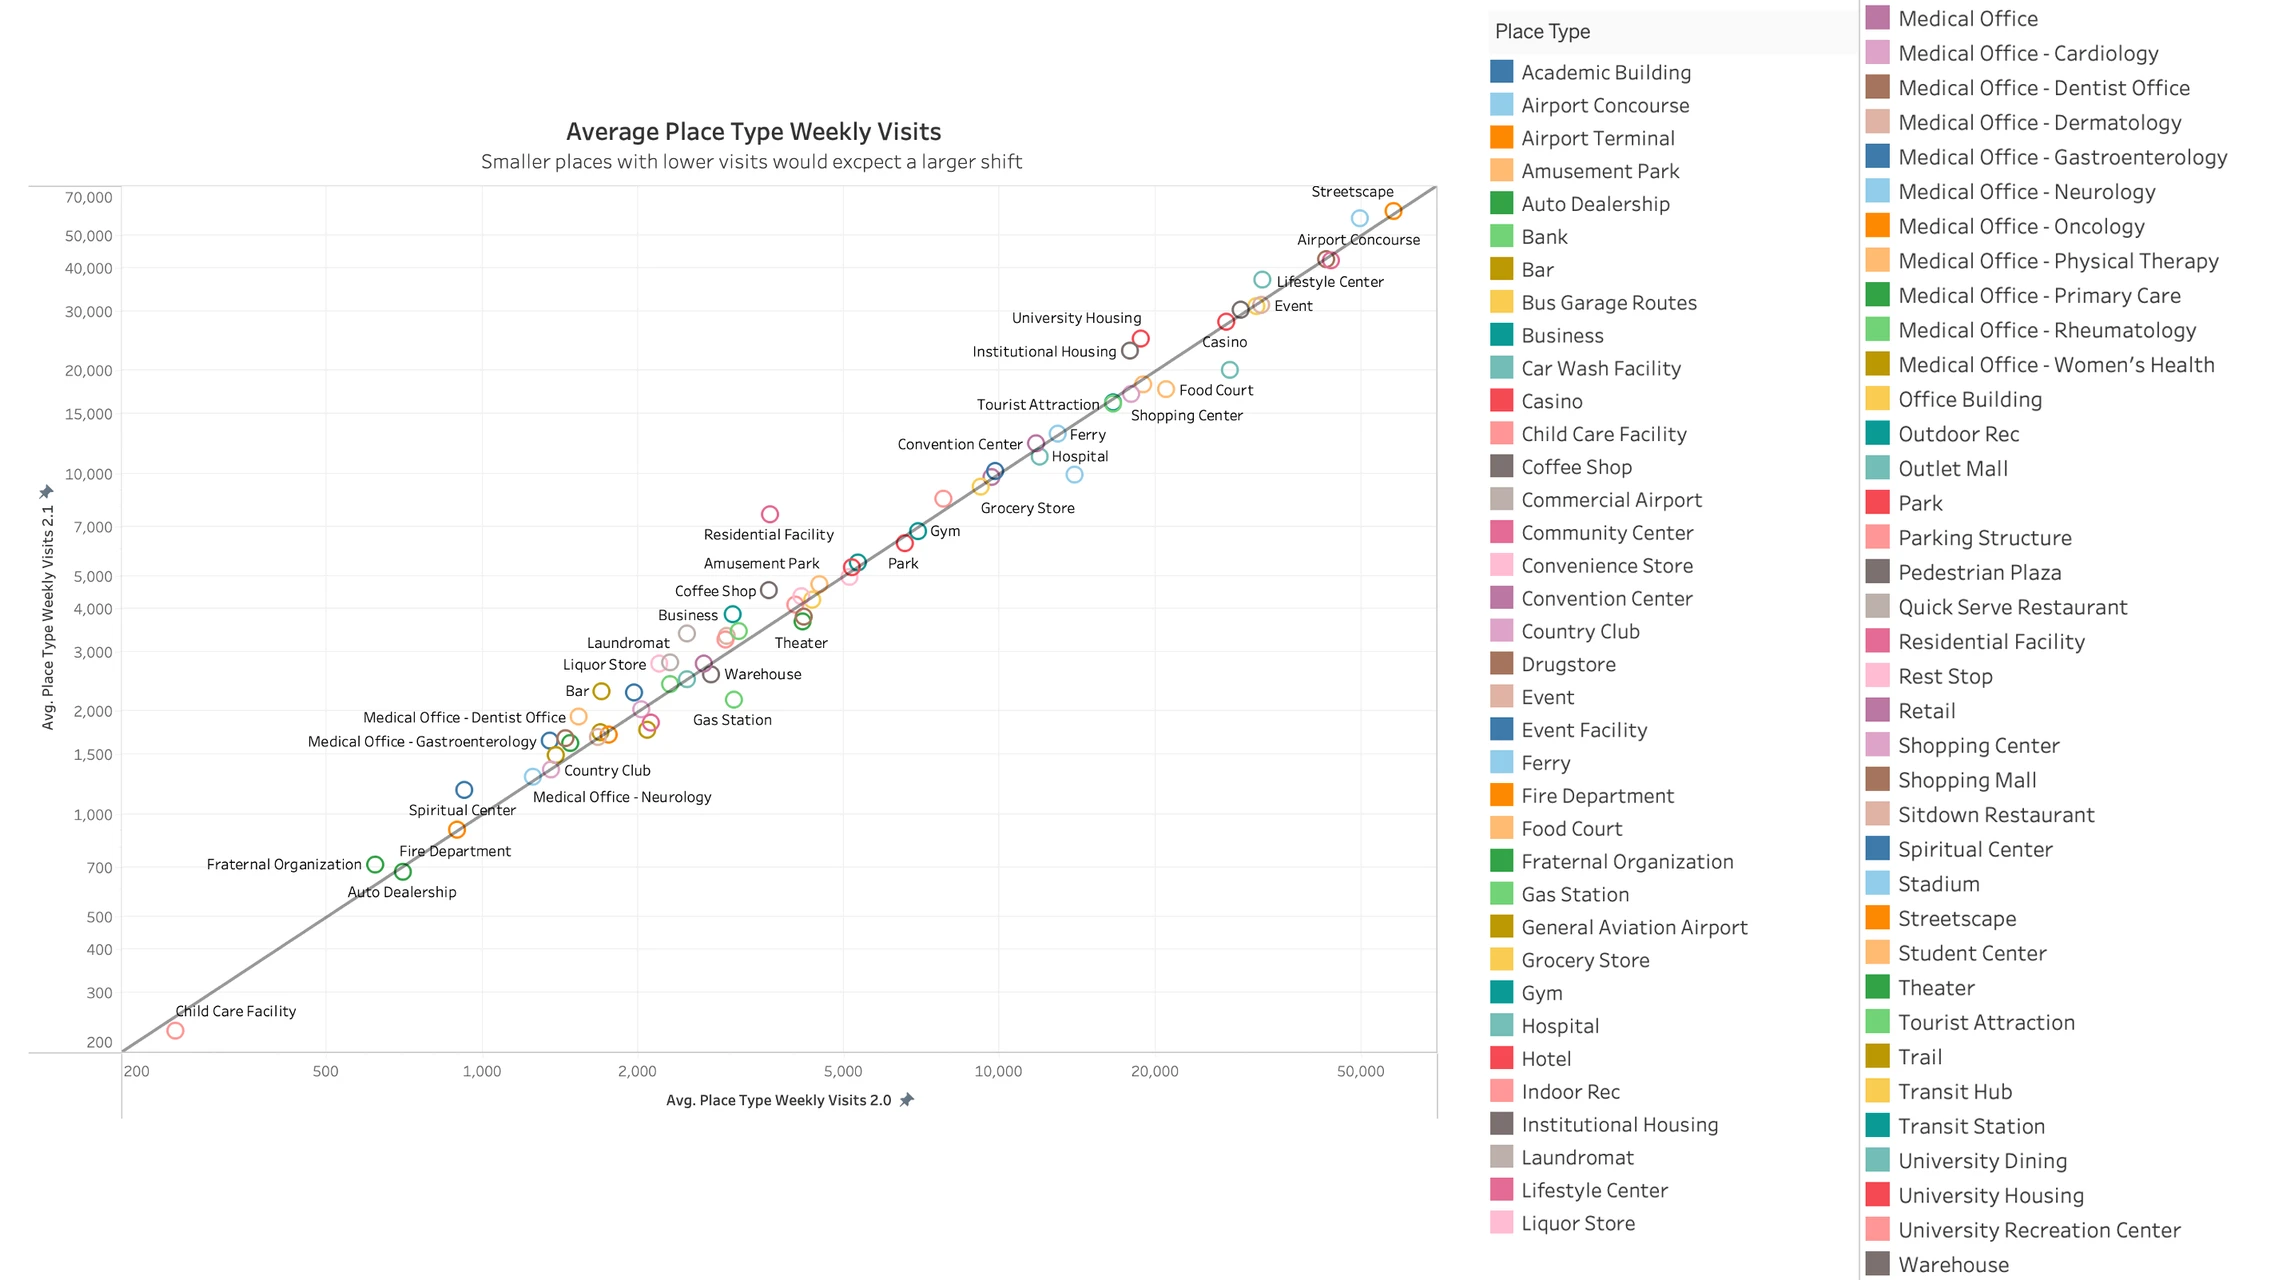
At an aggregate level in the second chart, all place types will remain relatively consistent.
Updated 4 months ago