
Basecast™ by Date Report (Version 1) - July 2019
Motionworks Basecast™ by Date measures total trips and person-miles traveled for the population living in counties and Designated Market Areas (DMAs).
Motionworks Basecast by Date
Motionworks Basecast™ by Date measures total trips and person-miles traveled for the population living in counties and Designated Market Areas (DMAs). The insights are produced using the proprietary Motionworks Population Intelligence Platform. Basecast™ by Date is best used for understanding the variation in total trip counts and person-miles traveled through time.
Person Miles Traveled
Motionworks estimates Person Miles Traveled (PMT) each month for each county in the United States. PMT is a measure of total travel that also including driving, transit, walking, air travel, and riding as a passenger in a car. PMT in the United States is seasonal with highest amounts of PMT occurring in the warmer months and the lowest levels of PMT occurring over the winter. In addition to season patterns, there are clear weekly trends in the data as well. PMT is typically higher during the week peaking on Friday compared to weekends with Sunday typically being the least traveled day of the week. The chart below provides a view of the current daily estimates for the last 52 weeks where both of these trends can be observed.
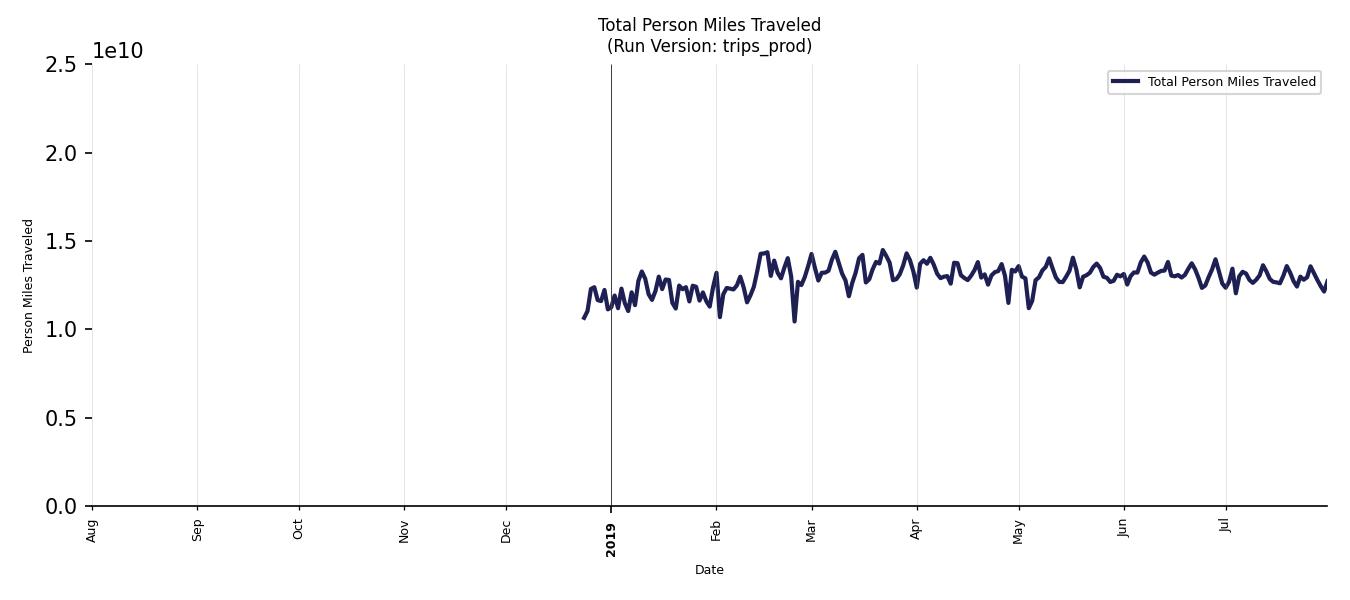
Motionworks estimates 39.0 miles traveled per day per person for July 2019. The table below provides a breakdown of the PMT rates by day type in the month.
| Day Type | PMT per Capita |
|---|---|
| All Days | 39.0 |
| Weekdays | 38.4 |
| Fridays | 40.7 |
| Saturdays | 40.0 |
| Sundays | 39.0 |
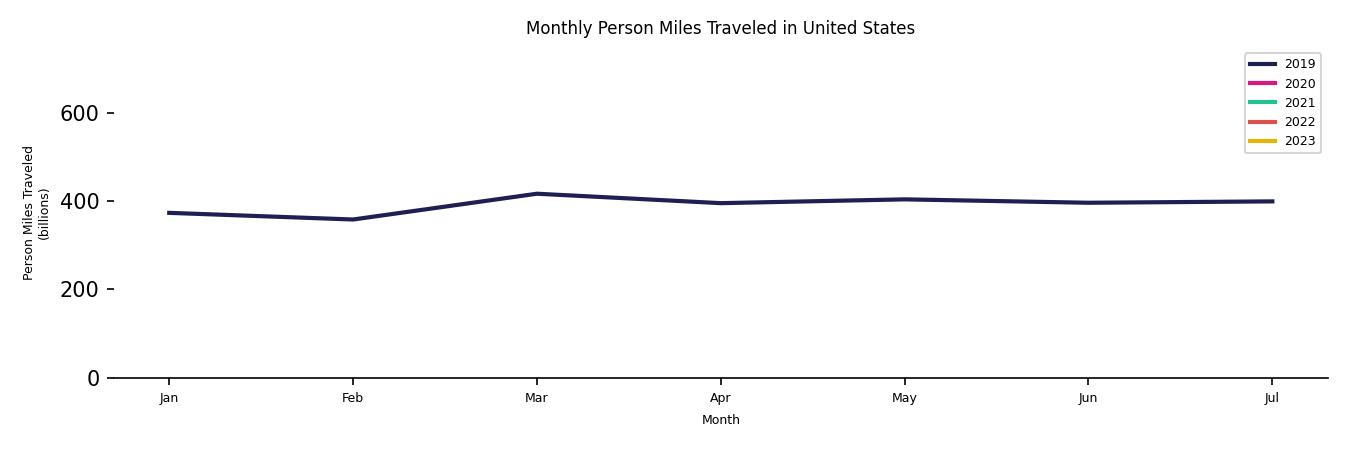
Nationwide Trends
As stated above, person miles traveled has seasonal trends. The chart below highlights the monthly and seasonal trends over the past four years.
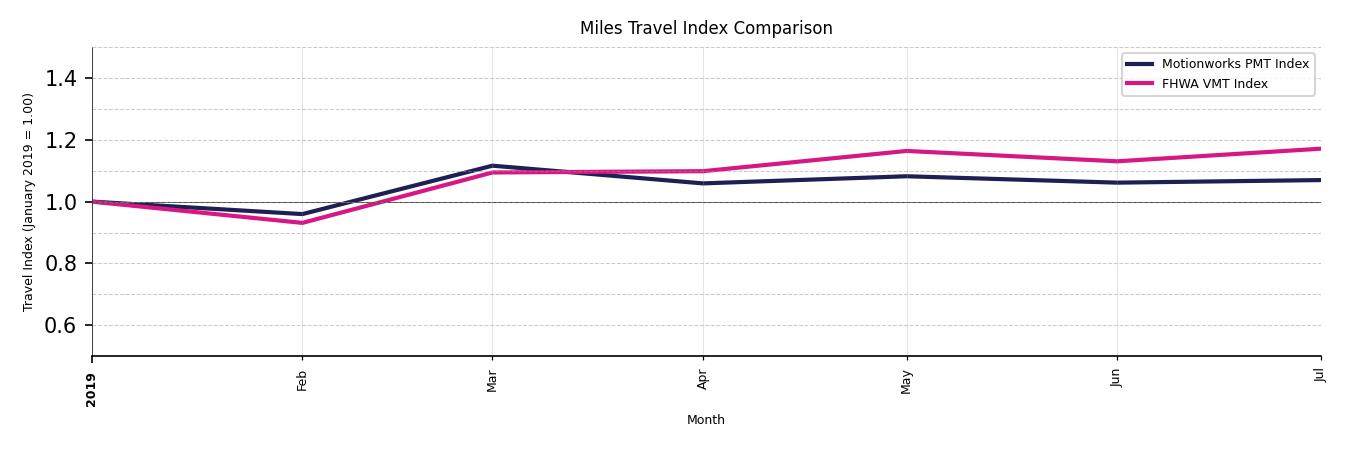
Each month the United States Federal Highway Administration (FHWA) publishes a snapshot of nationwide Vehicle Miles Traveled (VMT). VMT is a measure of the amount of auto travel people make in a month. Motionworks uses this monthly estimate as a benchmark of its own nationwide estimate of Person Miles Traveled (PMT). PMT is a measure of total total travel that also includes transit, walking, air travel, and riding as a passenger in a car. Motionworks checks for monthly consistency between FHWA’s VMT index and Motionworks’ PMT index.
Motionworks indexes VMT and PMT to a January 2019 baseline. Motionworks uses this index rather than absolute values because VMT is a subset, albeit a large subset, of total person miles traveled in the United States. Because VMT is such a large portion of total person miles traveled, PMT should generally track consistently with it.
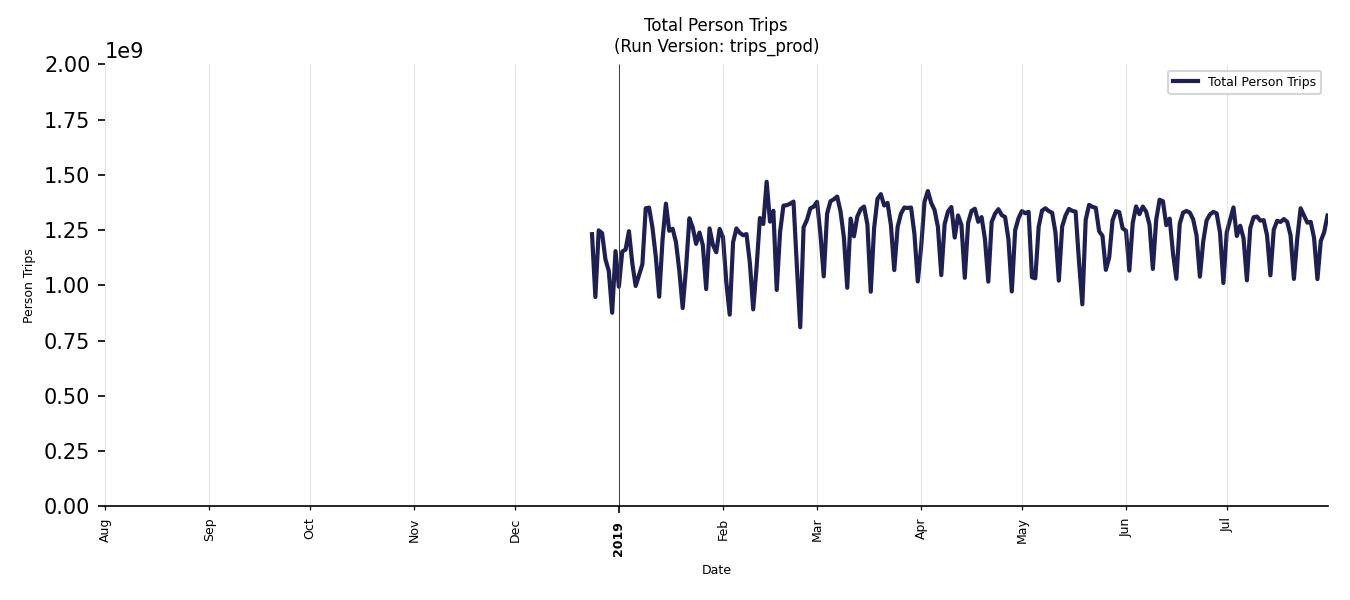
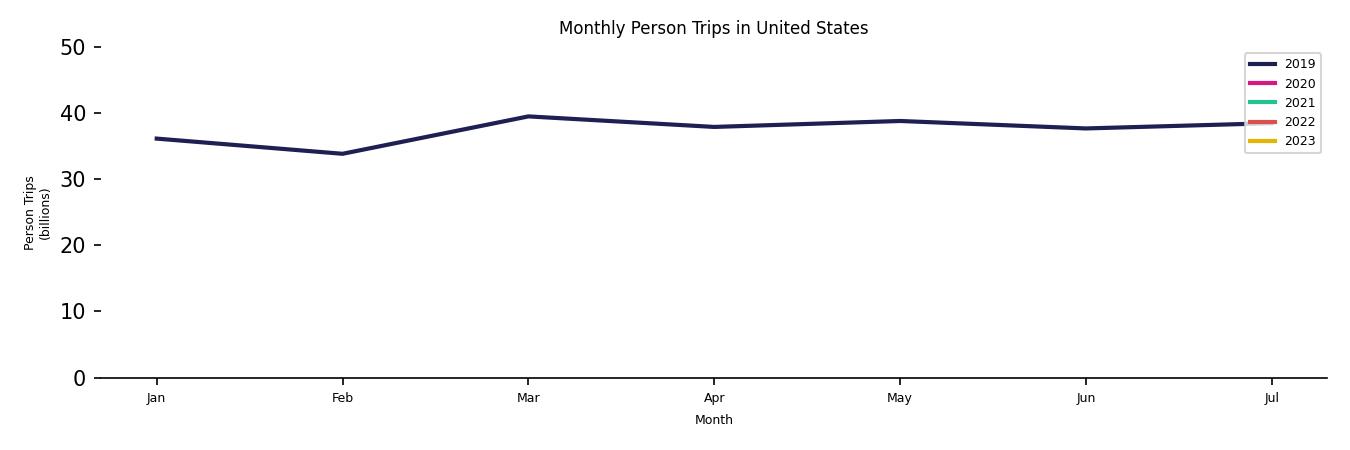
Total Trips
Motionworks estimates total person trips each month for each county in the United States. Motionworks trips are defined by dwells at each end of a trip: origin and destination. Motionworks considers any stay at a location for more than six (6) minutes to be a dwell at a location and thus marking it as an origin or destination for a trip. The Motionworks estimate of trips includes auto, bike, walk, transit, air, and all other modes of travel. Motionworks estimates 3.8 trips per person per day nationally for July 2019. The table below provides a breakdown of the trips rates by day type in July 2019.
| Day Type | Trips per Capita |
|---|---|
| All Days | 3.8 |
| Weekdays | 3.9 |
| Fridays | 3.9 |
| Saturdays | 3.7 |
| Sundays | 3.1 |
The table below presents a time series analysis of the total number of trips made each day in the United States in the prior 52 weeks.
National Trends
Similar to the person miles traveled chart above, the chart below highlights the monthly and seasonal trends over the past four years for trips.
Motionworks reviews trip rates for consistency with national trends reported in the 2017 National Household Travel Survey (NHTS). The following charts show how the July 2019 trip rates compare to the NHTS by day type (e.g., weekday, Fridays, Saturdays, Sundays).


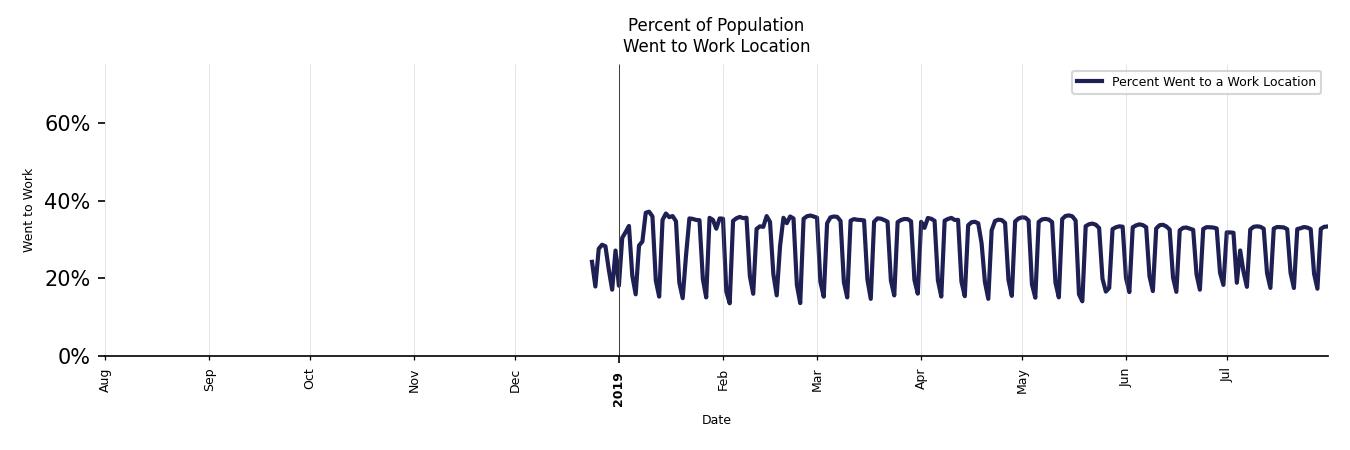
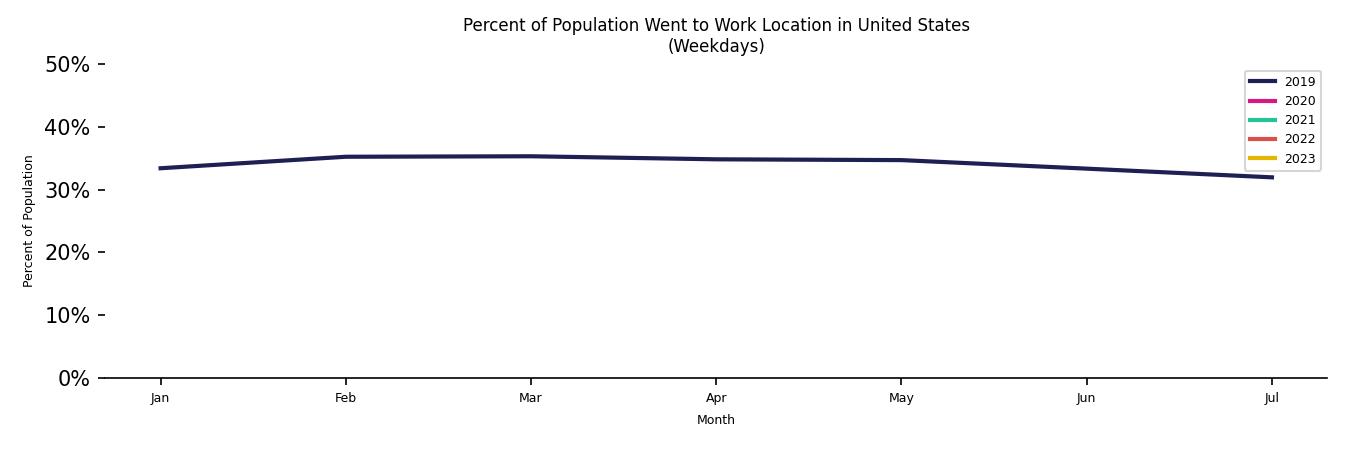
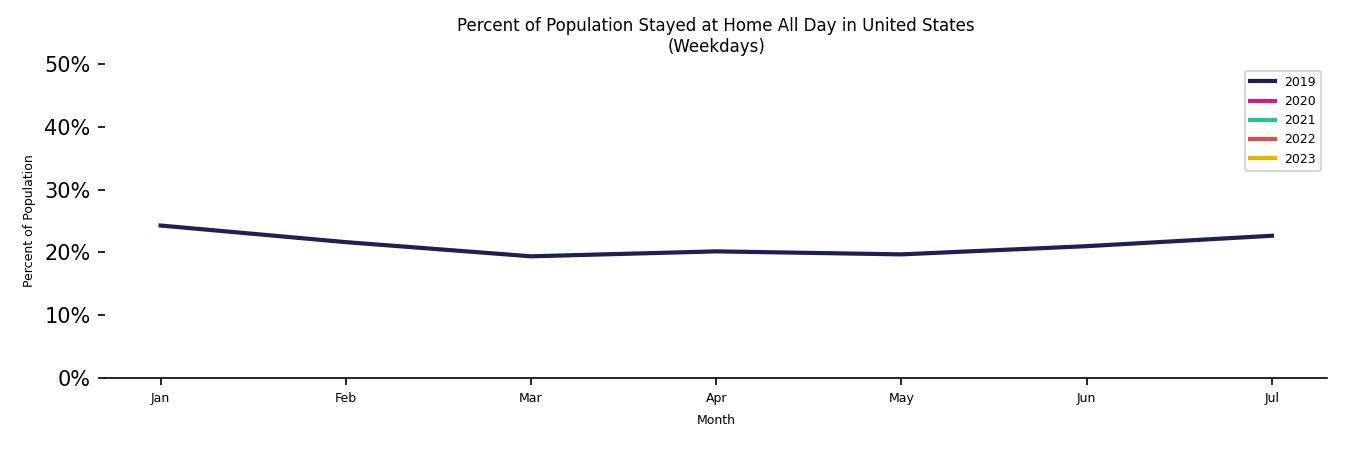
Went to Work
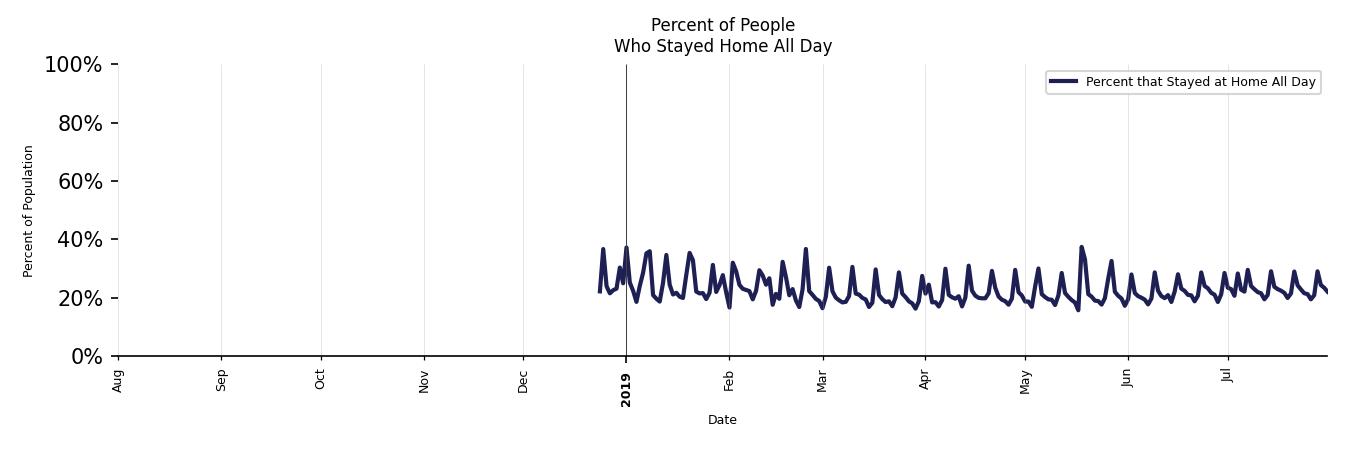
Stayed At Home
Population
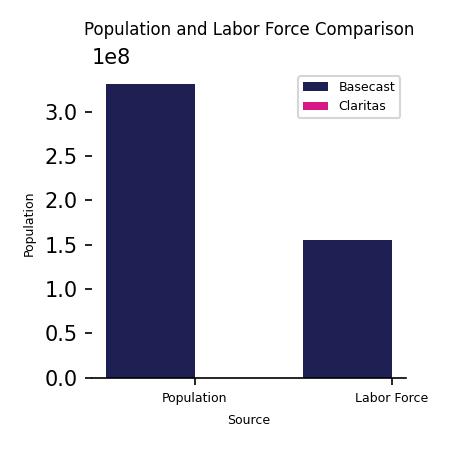
Motionworks assigns weights to each device in its panel. The sum of these weights at the county and national level represent the total population of the county or nation.
For July 2019, the calculated United States population from the Motionworks panel is 330,587,454 with a labor force of 155,432,622. The chart below compares the weighted population from the Motionworks panel to the target population derived from the Claritas estimates.
Motionworks Panel
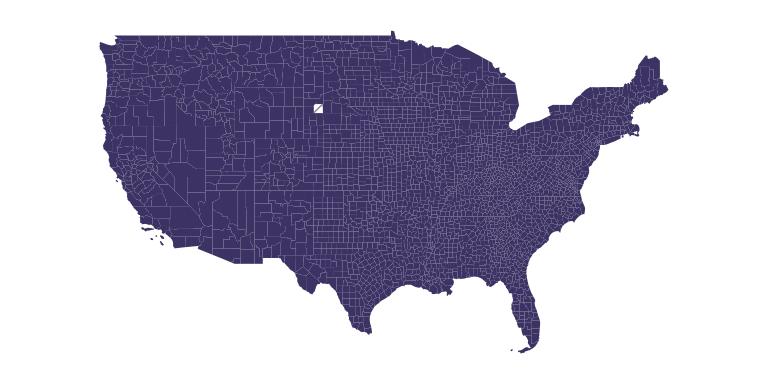
Motionworks analyzes location data from 158.0 million personal devices in the United States in July 2019. In order to develop insights for the Basecast by Date product, Motionworks uses a selection of the most active and stable devices observed. Our activity filters require that we observe activity from devices for a minimum number of hours each day. Motionworks also applies robust filtering methods to flag and remove potentially erroneous data from our feeds. The map below shows the penetration rate of panel devices used to calculate national and county level travel statistics.
Updated 4 months ago