Motionworks Placecast™ General Aviation Airports Report
Motionworks Placecast™ products provides for Places and Regions since 2019.
General Aviation Airports
Motionworks Placecast™ provides visits and occupancy for Motionworks Places and Regions since 2019. These insights are produced with the Motionworks Population Intelligence Platform. Placecast™ is used for investigating visitation trends at locations through time.
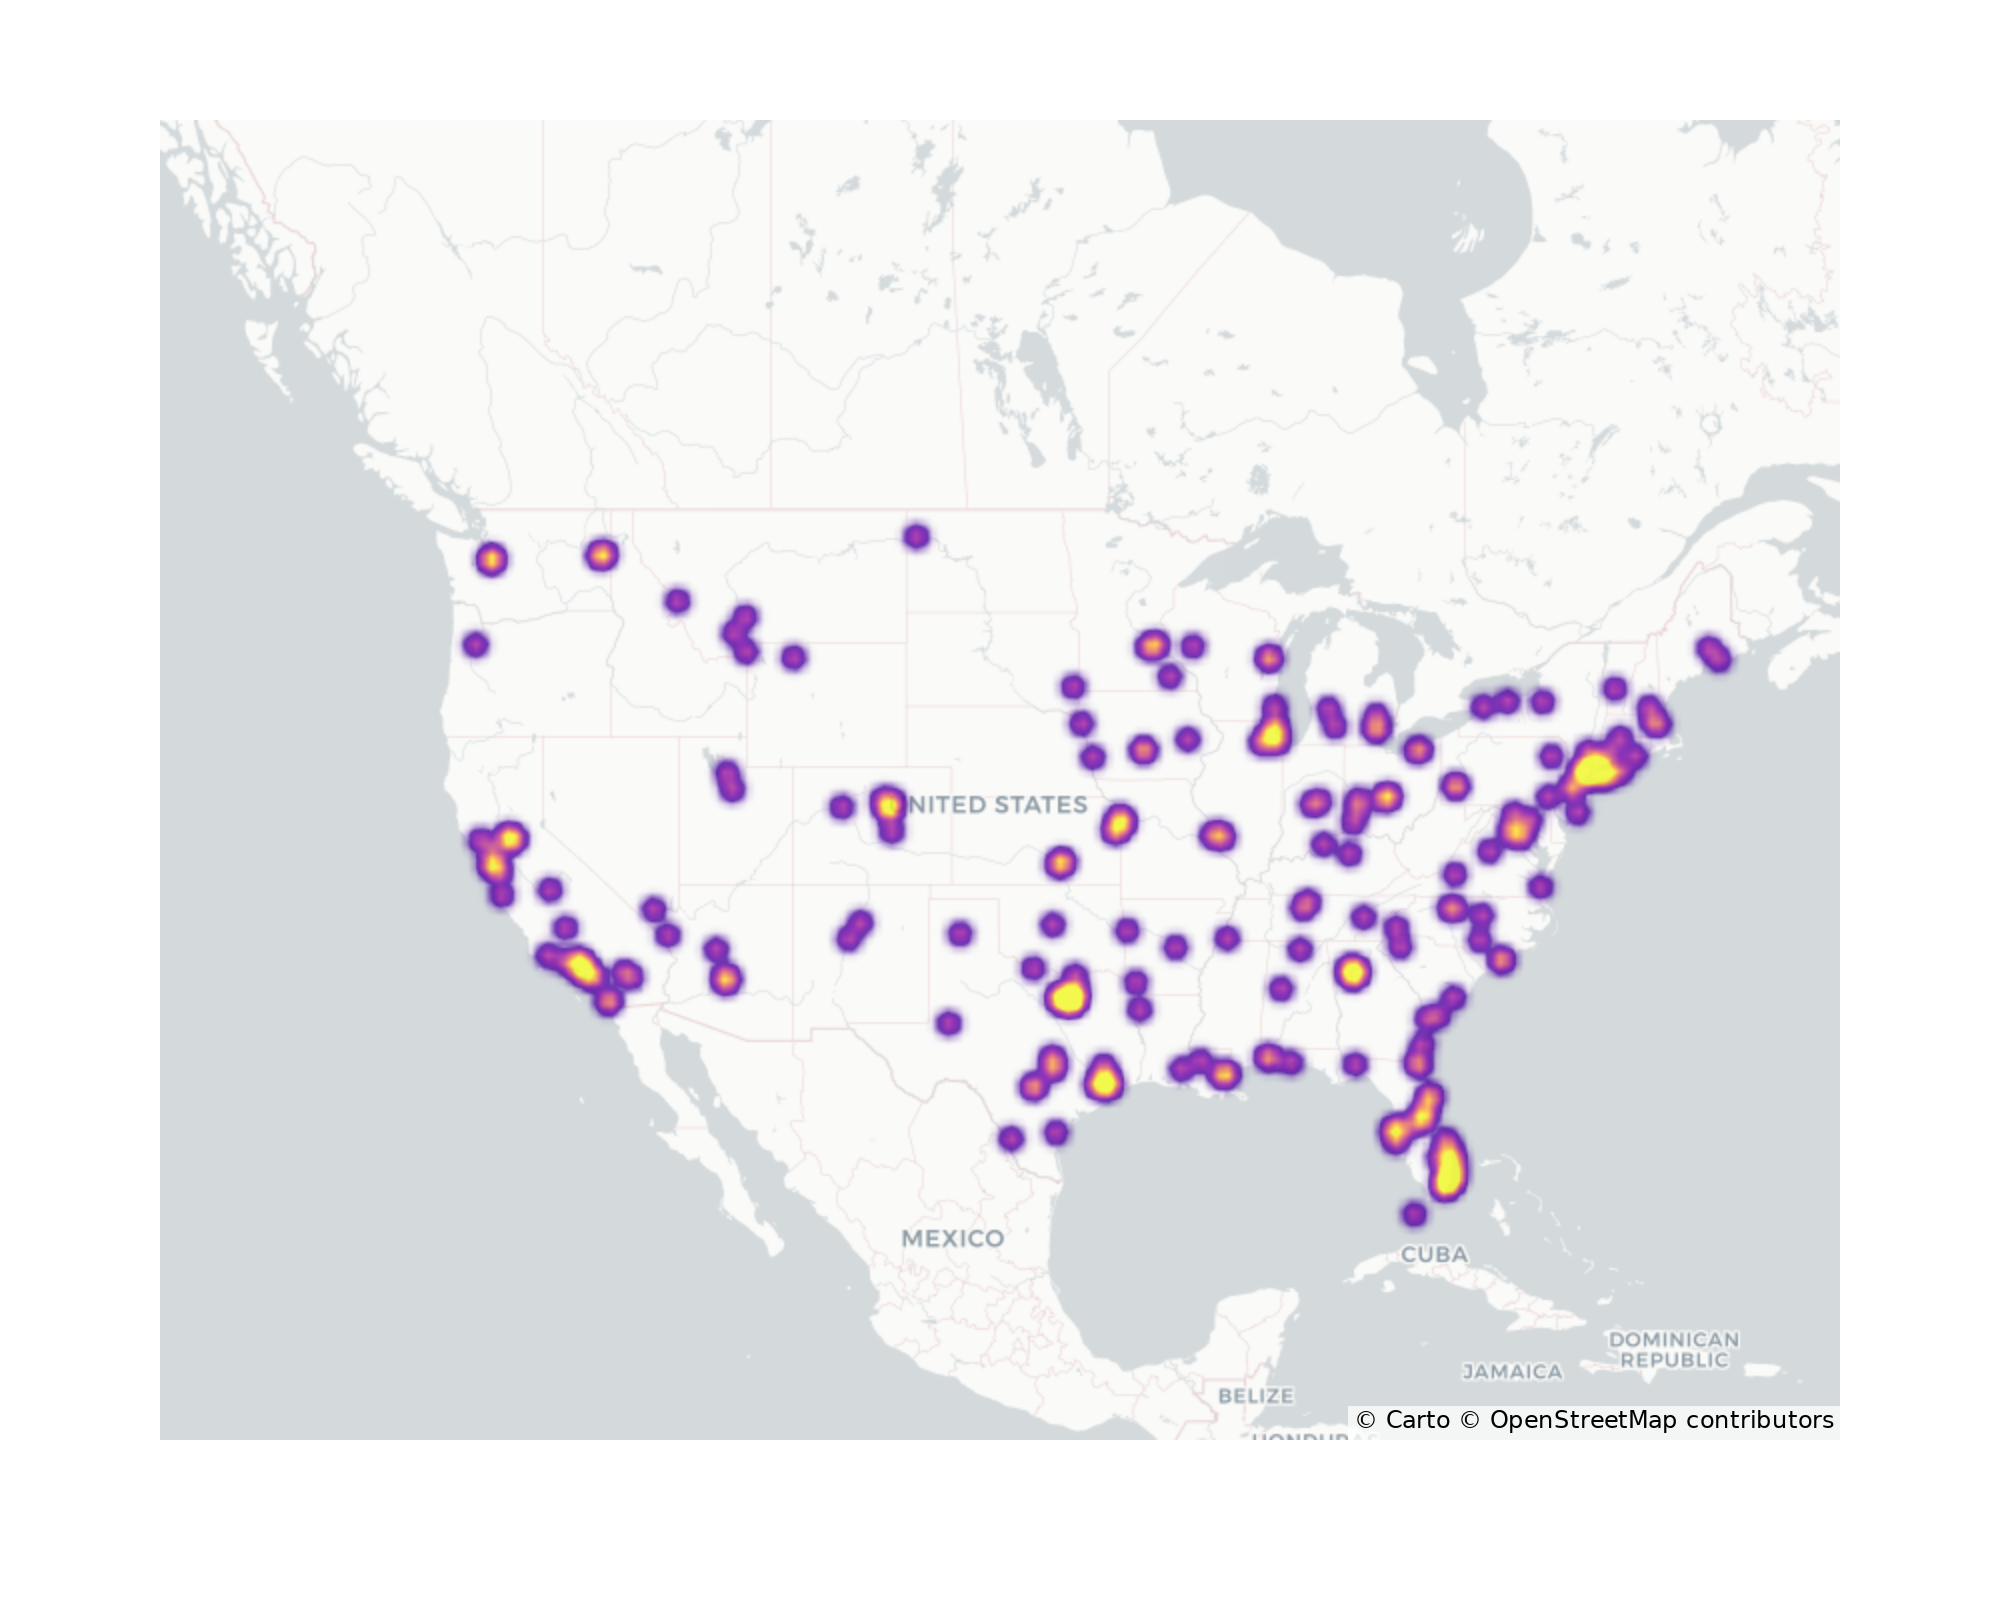
The following document provides an overview of the validation of Motionworks General Aviation Airports. Motionworks currently measures visitation at 259 general aviation airports. Places can be standalone or within a larger building or a complex. Out of the total number of places measured, 259 are standalone locations where they can be directly measured. The figure below indicates the distribution of all Motionworks General Aviation Airports across the United States.
Place Description
Buildings at airports associated with private or general aviation flights including hangars and offices.
Place Stats
| Place Type | Number of Places | Minimum Size -sq ft- | Median Size -sq ft- | Average Size -sq ft- | Maximum Size -sq ft- |
|---|---|---|---|---|---|
| General Aviation Airport | 259 | 4,589 | 121,726 | 157,748 | 1,377,813 |
| Median Visits per Week 2025 | Median Visits per Week 2024 | Median Visits per Week 2023 | Median Visits per Week 2022 | Median Dwell Time 2025 | Median Dwell Time 2024 | Median Dwell Time 2023 | Median Dwell Time 2022 | |
|---|---|---|---|---|---|---|---|---|
| V2.2 | 2,540 | 2,072 | 2,520 | 1,493 | 46 | 46 | 47 | 46 |
| V2.3 | 3,111 | 2,832 | - | - | 46 | 47 | - | - |
Weekly Visit Trends
The figure below shows the trend of weekly visits - median (red) as well as the 25th to 75th percentile band (green) - over time across all general aviation airports.

Weekly Visit Per 1K SQFT Trends (Standalone)
The figure below shows the trend of weekly visits per 1000 square feet of space (ksf) - median (red) as well as the 25th to 75th percentile band (green) - over time across only standalone general aviation airports that can be directly measured or at least have a polygon/size.

Day of Week and Hour of the Day Profiles
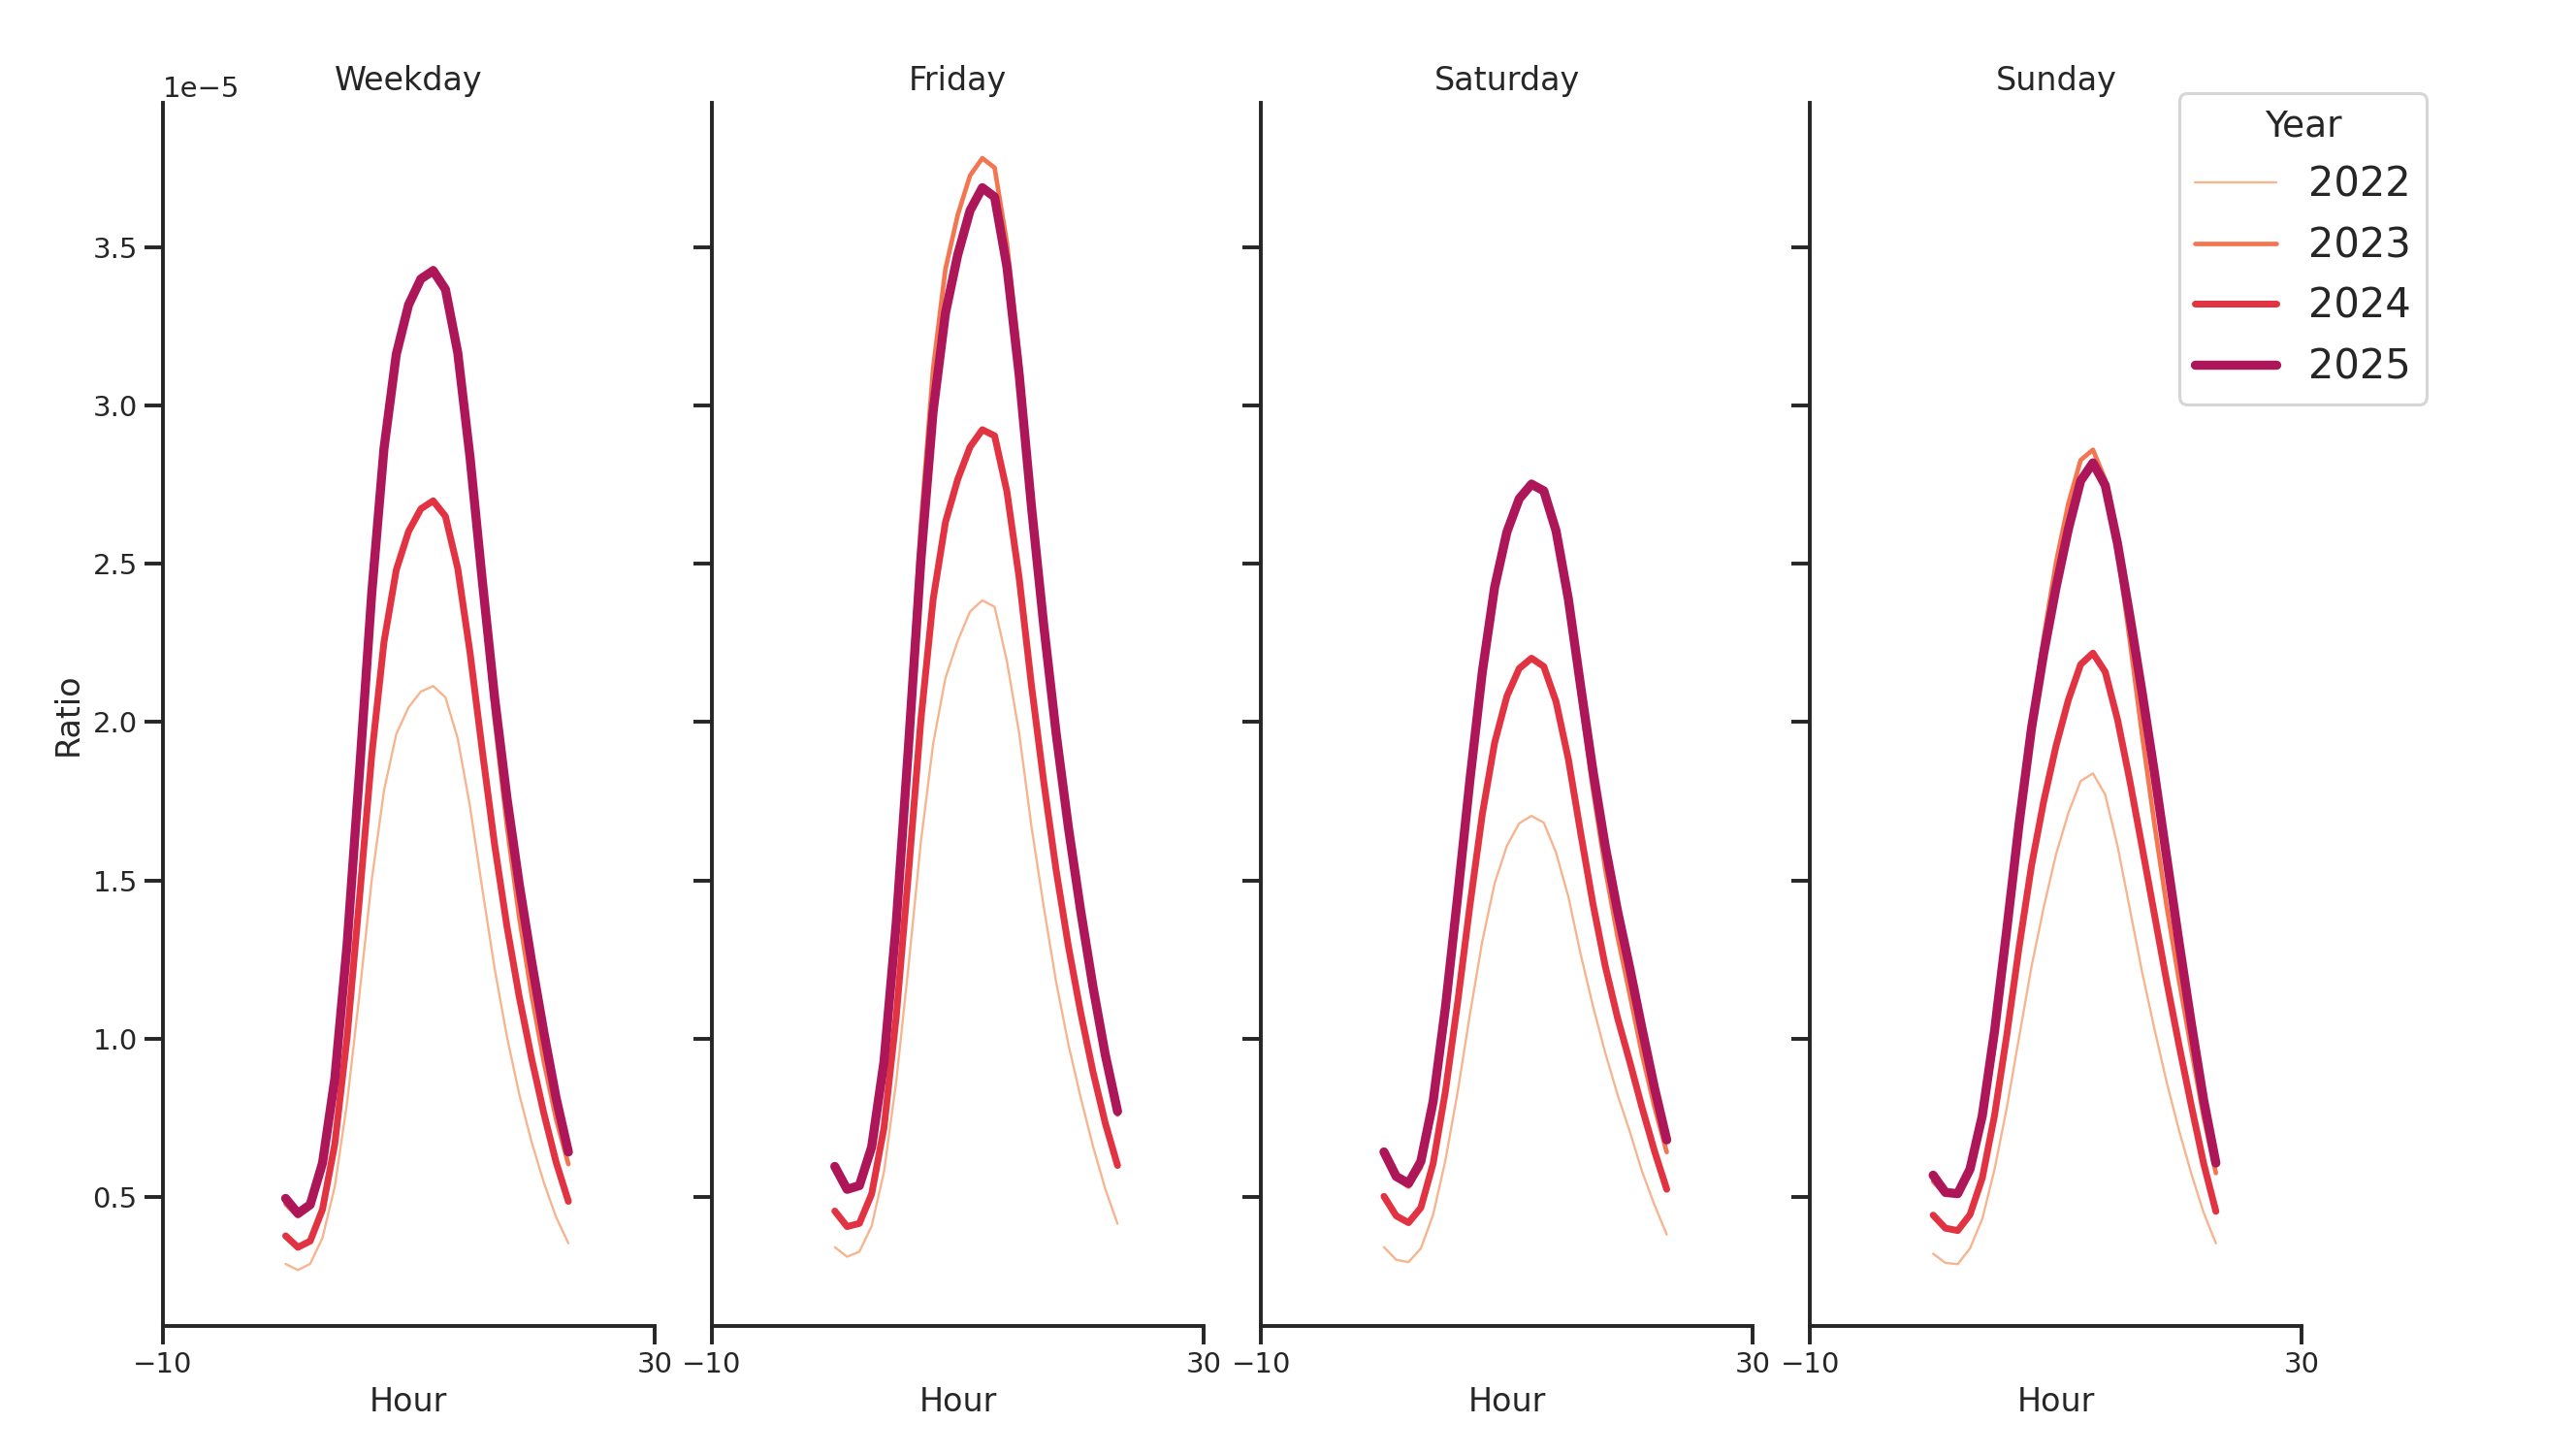
The figure below shows the average ratio of the weekly visits that fall within a specific hour of a specific day of the week. The color represents the year, and each band represents the variation over the months of the year.
Weekly Visit Scores
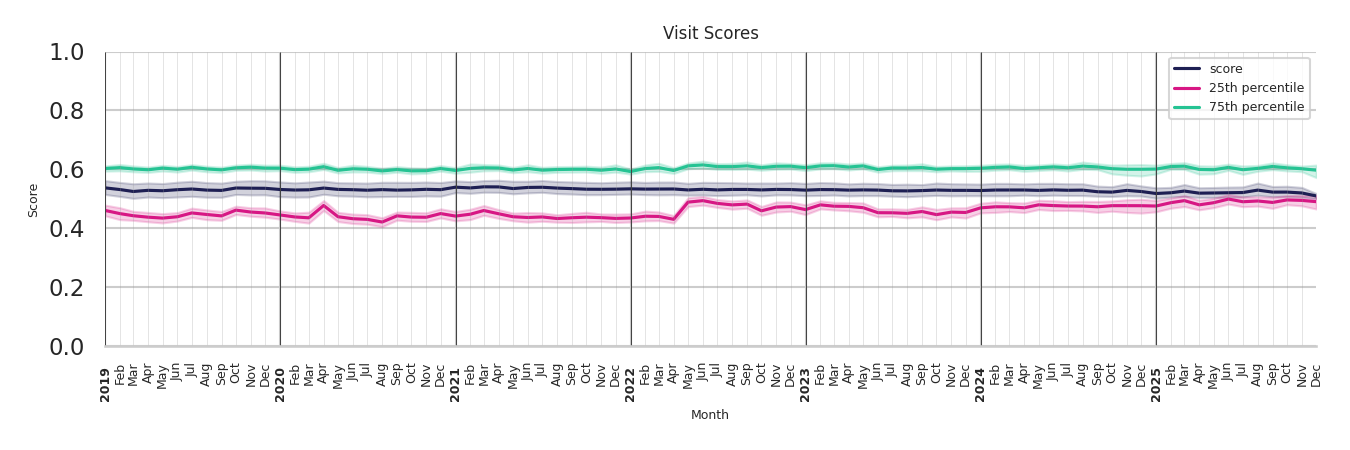
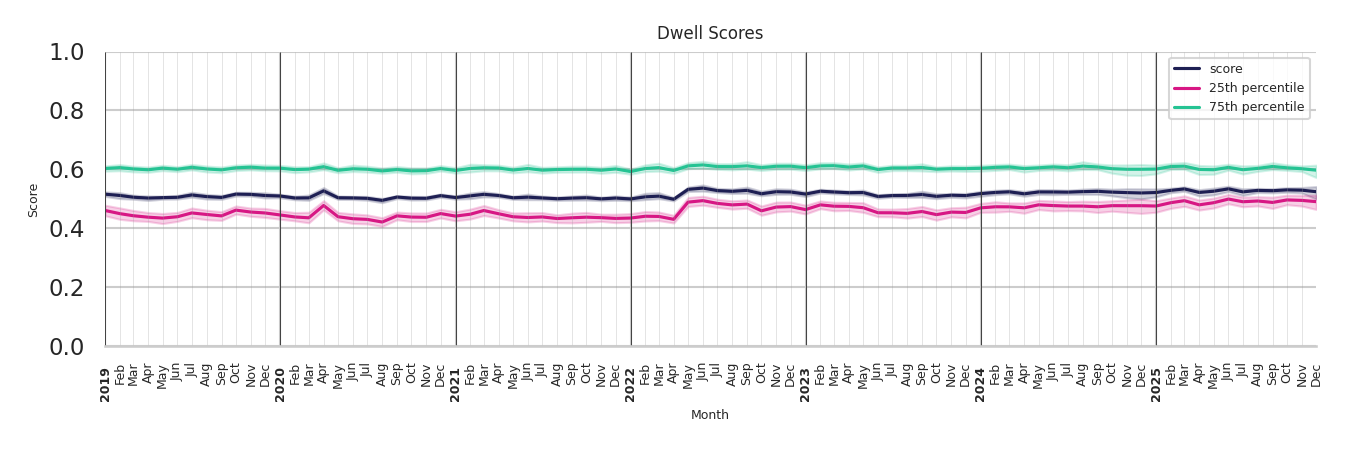
The table below presents the historic average scores for General Aviation Airports. Note that 1 is a good/perfect score and 0 is a bad/worst score. Scores for each place are calculated based on how well the place compares with their cohort of places, and how far off is the place’s observed (1) visitation, (2) dwell time, (3) hourly profile, and (4) trade area distance footprint from our best estimated place based on their location, size, urbanicity, and the type of place.
If a place's score is below a certain threshold, then the place is considered unfocused and therefore processed through the unfocused methodology, which results in their stats being estimated based on the location, size, and place type of other focused places in the vicinity.
| Average Dwell Score | Average Trade Area Distance Footprint Score | Average Profile Score | Average Visit Score | |
|---|---|---|---|---|
| V2.2 | 0.51 | 0.51 | 0.51 | 0.51 |
| V2.3 | 0.51 | 0.51 | 0.51 | 0.51 |
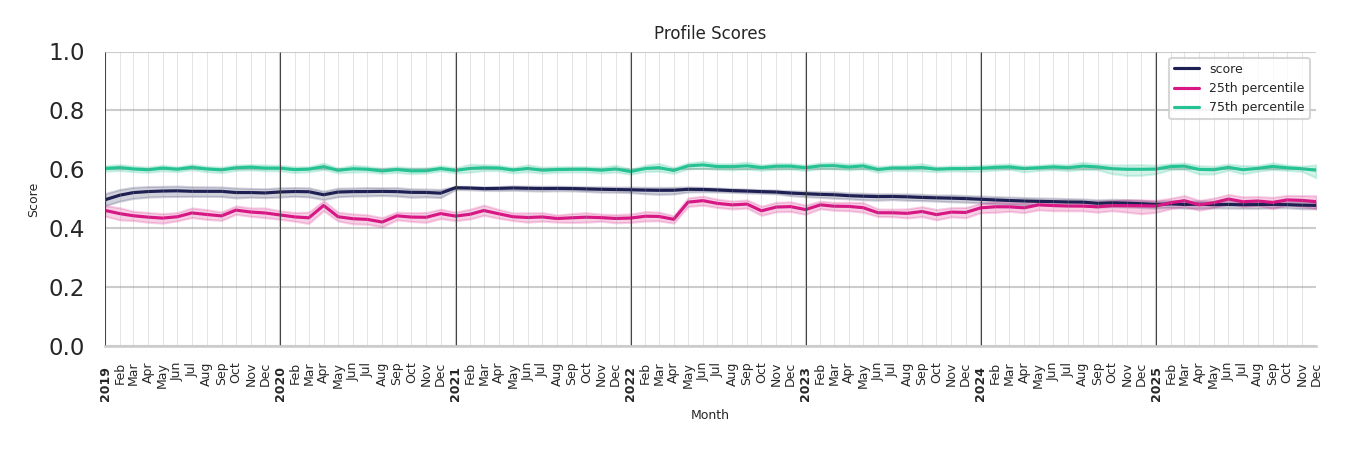
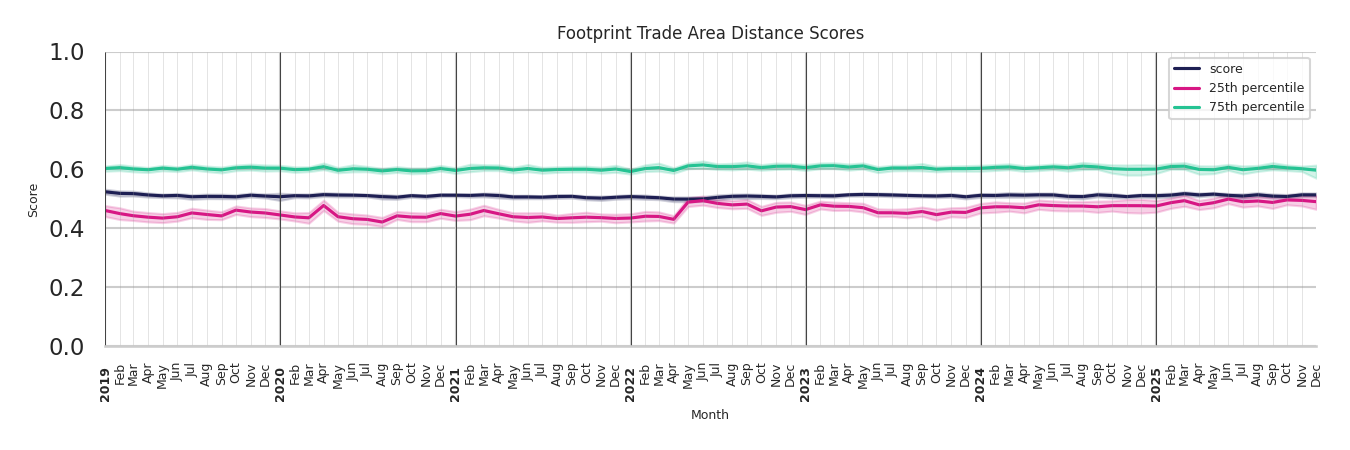
The figures below shows the average and 25th/75th percentiles of the score across all of the General Aviation Airports for every month since January 2019.
Visit Score Graph
Dwell Score Graph
Profile Score Graph
Footprint Trade Area Distance Score Graph
Tradeareas
A trade area is where customers or visitors live and how far they are likely to travel to an establishment or neighborhood. Motionworks Placecast™ Trade Areas documents the home location of visitors by the number of visits to a Motionworks Place or Region every month since 2019. These insights are produced with the Motionworks Population Intelligence Platform.
Verification
Motionworks verifies Trade Area estimates to ensure confidence and illustrate the quality of our data. Motionworks maintains data on expected trade areas by place type from trusted third parties such as travel surveys and academic research. The following tables provide an overview of verification for each Motionworks place type nationally compared to target values Motionworks has identified for each place type. Due to the detail of Motionworks place types, there is not always a one-to-one relationship between Motionworks place types and those identified in studies and research. As a result, some values from studies and research are shared across multiple Motionworks place types.
Tradeareas visits distribution
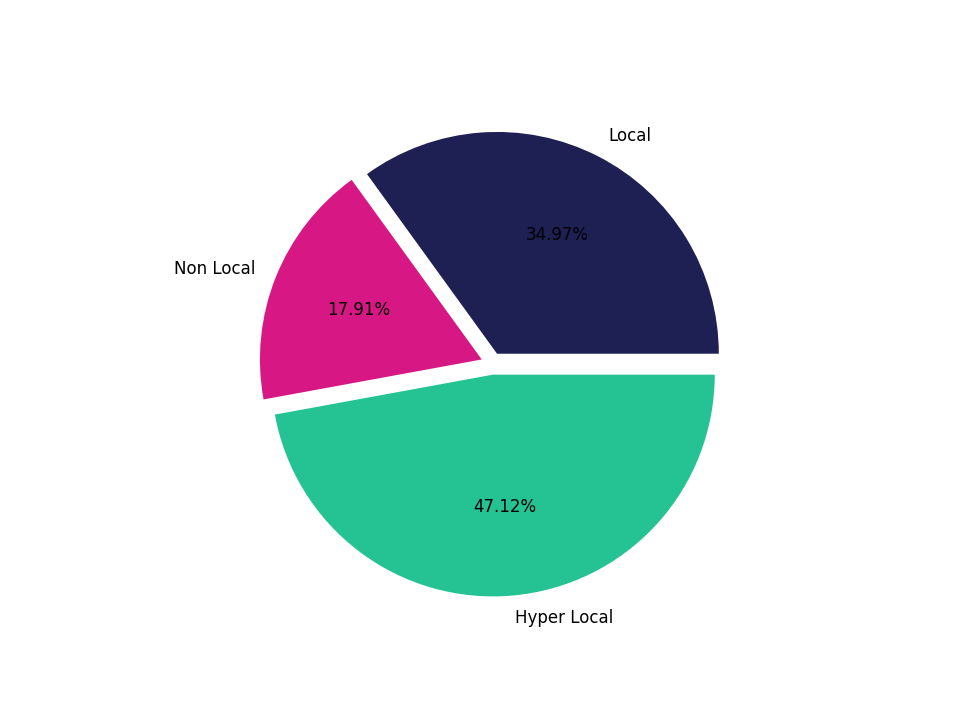
Motionworks segments trade areas by 1) local, 2) hyper local, 3) non-local. Local is defined as the home to place distance is < 50 miles, Hyper local is defined as the home and place have the same Census block group, and Non-local is defined as the home to place distance is > 50 miles. The figure below illustrates the distribution of visits by trade area segment.
Local (< 50 miles from home) Statistics
| Version | Mean Travel Distance to Location | Motionworks Estimated Mean (202512) | Change from prior month | Change from prior year |
|---|---|---|---|---|
| v2.2 | 21.4 miles | 24.6 miles | 6.8 % | 13.9 % |
| v2.3 | 22.1 miles | 23.1 miles | 2.6 % | 0.8 % |
Hyper Local (same home and place Census block group) Statistics
| Version | Mean Travel Distance to Location | Motionworks Estimated Mean (202512) | Change from prior month | Change from prior year |
|---|---|---|---|---|
| v2.2 | 9.1 miles | 8.9 miles | -2.7 % | -3.6 % |
| v2.3 | 10.0 miles | 8.2 miles | 29.5 % | -12.5 % |
Non-Local (>50 miles from home) Statistics
| Version | Mean Travel Distance to Location | Motionworks Estimated Mean (202512) | Change from prior month | Change from prior year |
|---|---|---|---|---|
| v2.2 | 516.9 miles | 621.0 miles | 4.7 % | 5.3 % |
| v2.3 | 810.5 miles | 820.0 miles | -0.7 % | -11.2 % |
Home to place distance distribution
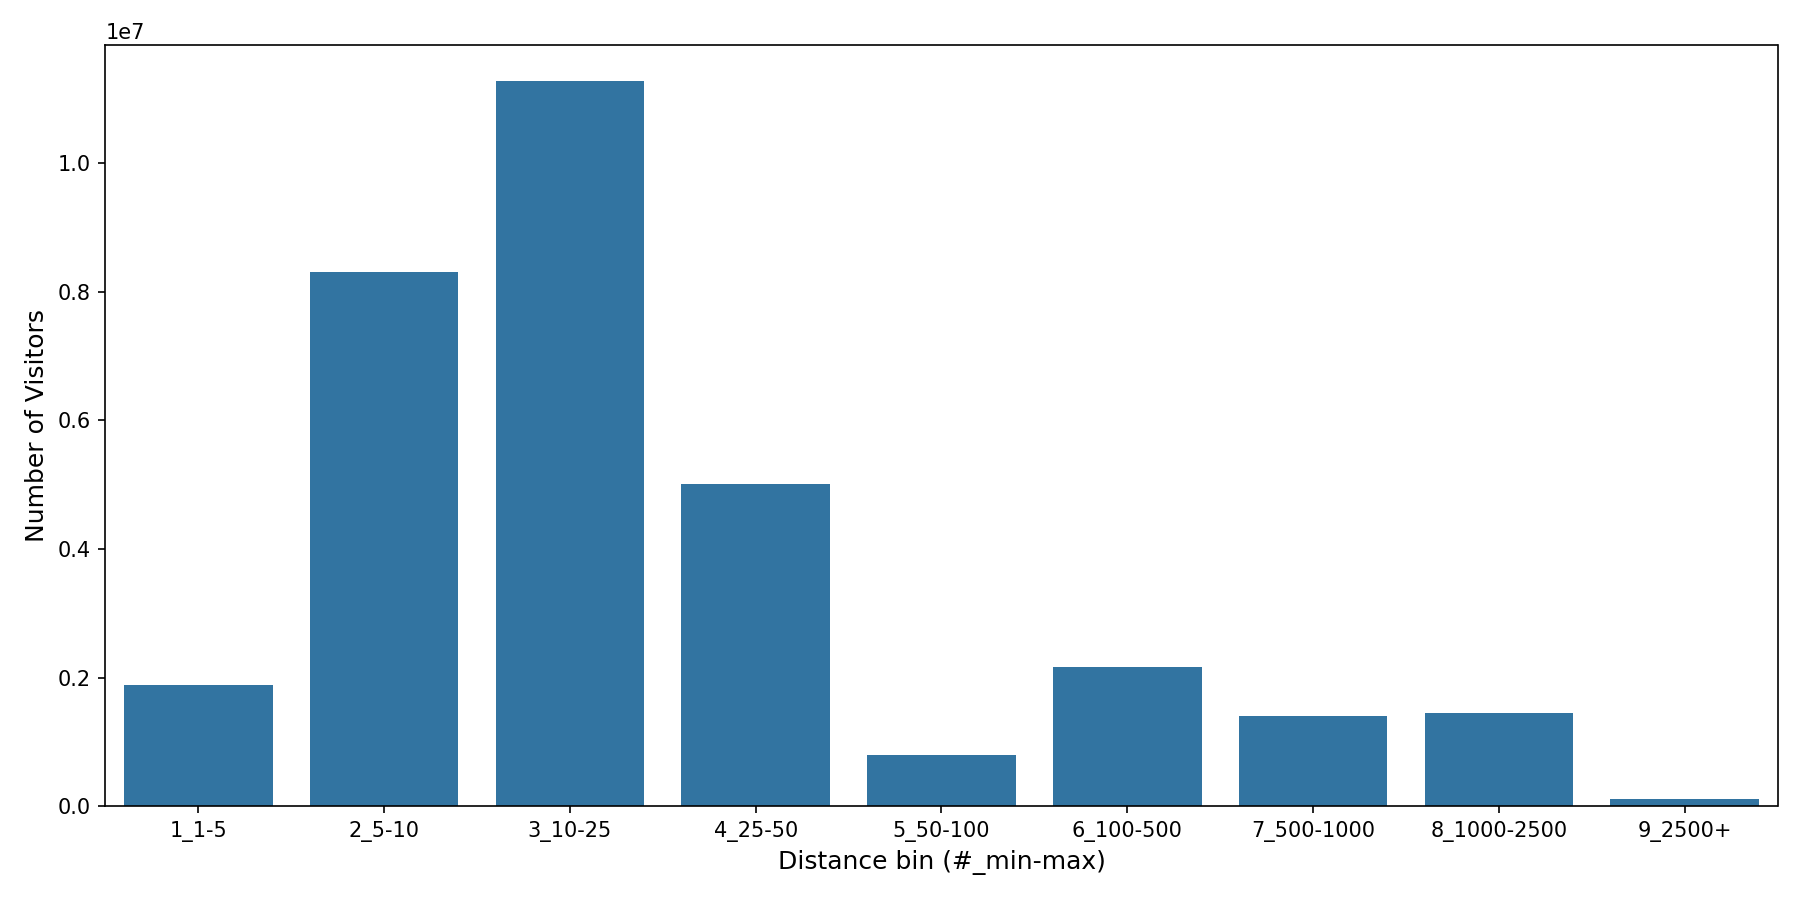
The figure below illustrates the home to place distance distribution by distance bin.
Updated about 1 month ago