
2023 Motionworks Popcast™ Digital Pop Validation
Validation report for 2023 United States Motionworks Popcast™ Digital Pop.
Introduction
When marketing a product or service, it is helpful to look at the relationship between demographics for a geographic area. For example, one might be curious about the relationship between family size and household income in midtown Atlanta to either market a luxury minivan or locate a new preschool. Traditionally, this involves either performing a survey or finding an existing source that has predefined cross-tabulations and set variable categories (e.g. US Census’ American Community Survey, Claritas). Either way, data acquisition is time and cost inefficient. With traditional surveying, there are also increasing non-response biases.
A digital population, also called a "synthetic population", is a virtual representation of a true population that can be used to analyze an audience. Put succinctly, a digital population is a simplified, microscopic representation of an actual population. It is simplified in the sense that it does not contain all possible population attributes---only those part of its design; and it is microscopic, meaning that every person and household is represented individually. That being said, a digital population is not identical to a real population. You will not find an exact virtual copy of yourself, or anyone else, within it. Rather, it is generated in such a way that a virtual person exists that is statistically representative of you, and anyone else in the real population. Because of this, the use of digital populations has the added benefit of protecting individuals’ privacy.
Validation at National Level
Figures in this section show high-level distributions of nationwide households and persons across various features such as age, gender, household income, etc. Comparisons are presented with the latest available US Census American Community Survey 5-Year Data from 2017-2021 and Claritas PopFacts from 2023.
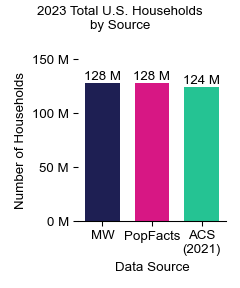
Total Households (National)
The chart below compares total households in the United States between 2015-2019 5-Year American Community Survey (ACS), 2022 Motionworks Digital Population (MW), and 2022 Claritas PopFacts. The Digital Population matches closely with 2022 PopFacts and indicates a reasonable growth of 1.6 percent annual household growth from the 2015-2019 ACS estimate.
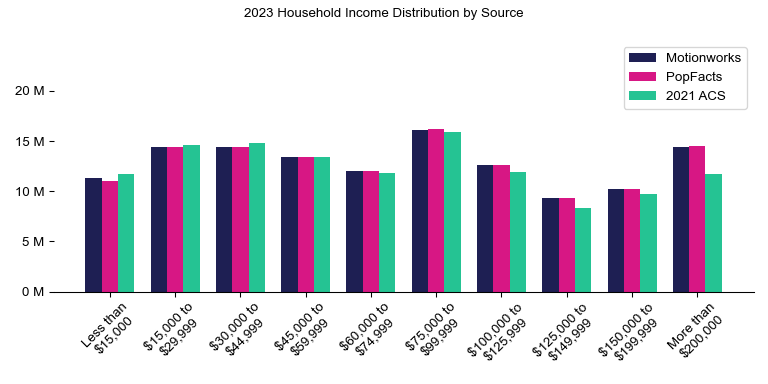
Households By Household Income (National)
Motionworks uses Claritas household income estimates for controls for the Digital Population. The chart below represents the control category bins and the comparison in household counts for the Digital Population, Claritas, and the 2017-2021 5-Year ACS.
The Claritas income represents household incomes in 2023 dollars, and represents the most significant reason why Claritas household incomes skew higher than the 2017-2021 5-Year ACS. Between 2021 and 2023, Claritas is reporting growth in real income and also increases in household income due to inflation. In the past two years, the U.S. Bureau of Labor Statistics reports a 14 percent increase in the Consumer Price Index.
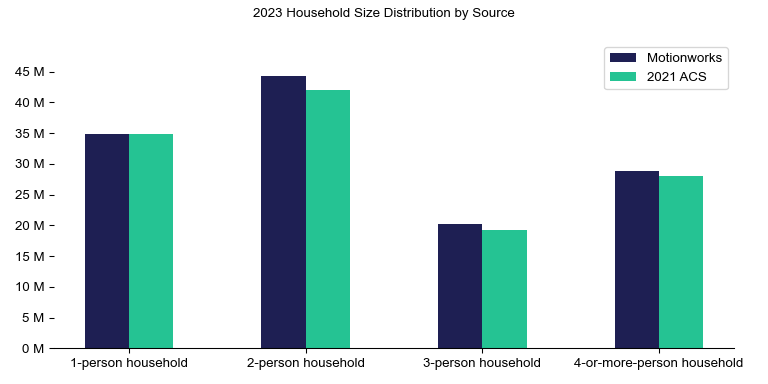
Households by Household Size (National)
The charts below represent Motionwork's 2023 Digital Population compared to the 2017-2021 5-Year ACS. In general, the Digital Population by household size compares well to the ACS data. The Digital Population does have higher counts of households given the additional two years of population growth included in the data.
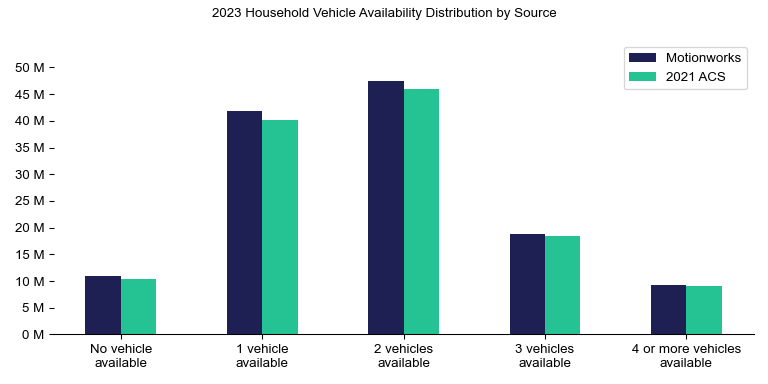
Households by Vehicle Availability (National)
The charts below represent Motionwork's 2023 Digital Population compared to the 2017-2021 5-Year ACS for households segmented by vehicle availability. In general, the Digital Population by vehicle compares well to the ACS data distribution. The Digital Population does have higher counts of households given the additional two years of population growth included in the data.
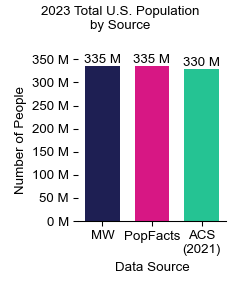
Total Population (National)
The chart below compares total population in the United States between 2017-2021 5-Year American Community Survey (ACS), 2022 Motionworks Digital Population (MW), and 2022 Claritas PopFacts. The Digital Population matches closely with 2022 PopFacts and indicates a reasonable growth of 0.7 percent annual population growth from the 2015-2019 ACS estimate.
This population growth rate is slower the than household annual growth rate referenced above. Households are growing at a more rapid pace as average household sizes decrease due to an aging population with increasing empty nesters and more young people choosing to live alone.
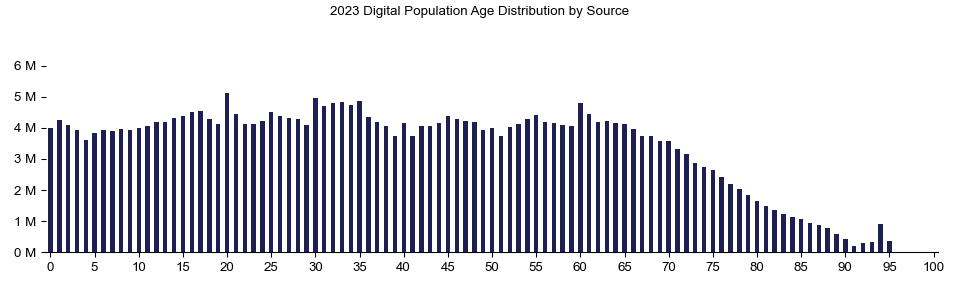
Total Population by Age (National)
The charts below represent Motionwork's 2023 Digital Population age distribution. This chart is provided in isolation to review any clumps within age groups. Due to the self reported nature of the American Community Survey, the chart does reveal some clumping on the five-year age groups like 20, 30, and 60.
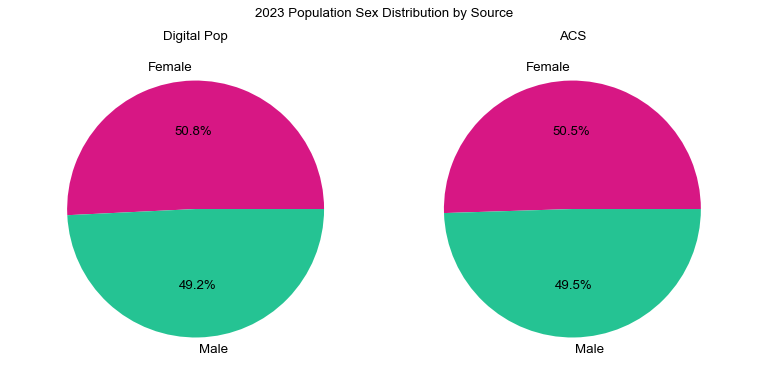
Total Population by Sex (National)
The charts below represent Motionwork's 2023 Digital Population compared to the 2017-2021 5-Year ACS for the total population by sex. In general, the Digital Population by sex compares well to the ACS data distribution. The Digital Population does have a slightly higher proportion of females compared to the latest ACS data.
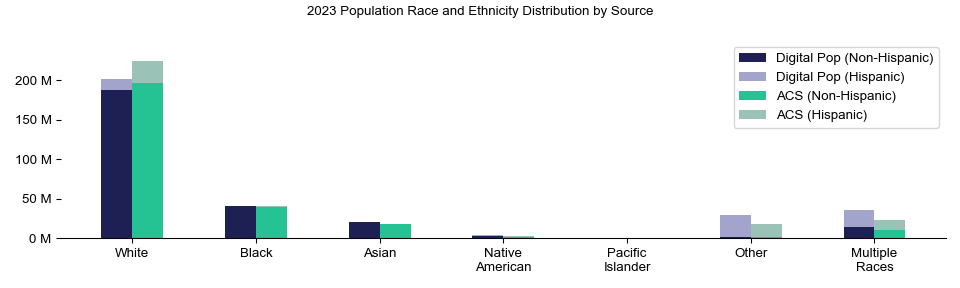
Total Population by Race and Ethnicity (National)
The charts below represent Motionwork's 2023 Digital Population compared to the 2017-2021 5-Year ACS for the total population by race and ethnicity. In the U.S. Census Bureau defitions, race and hispanic ethnicity are different but related concepts. A person can identify as any race (e.g., White, Black, Native American) and identify as Hispanic ethnicity.
In general, the Digital Population by race and ethnicity compares well to the ACS data distribution. The Digital Population does tend to represent Hispanic ethnicity higher in the Other and Multiple race categories at the expense of White Hispanics. This is likely due to reporting issues within the Census Public Use Microdata Sample (PUMS) used as input seeds for the Population Synthesis.
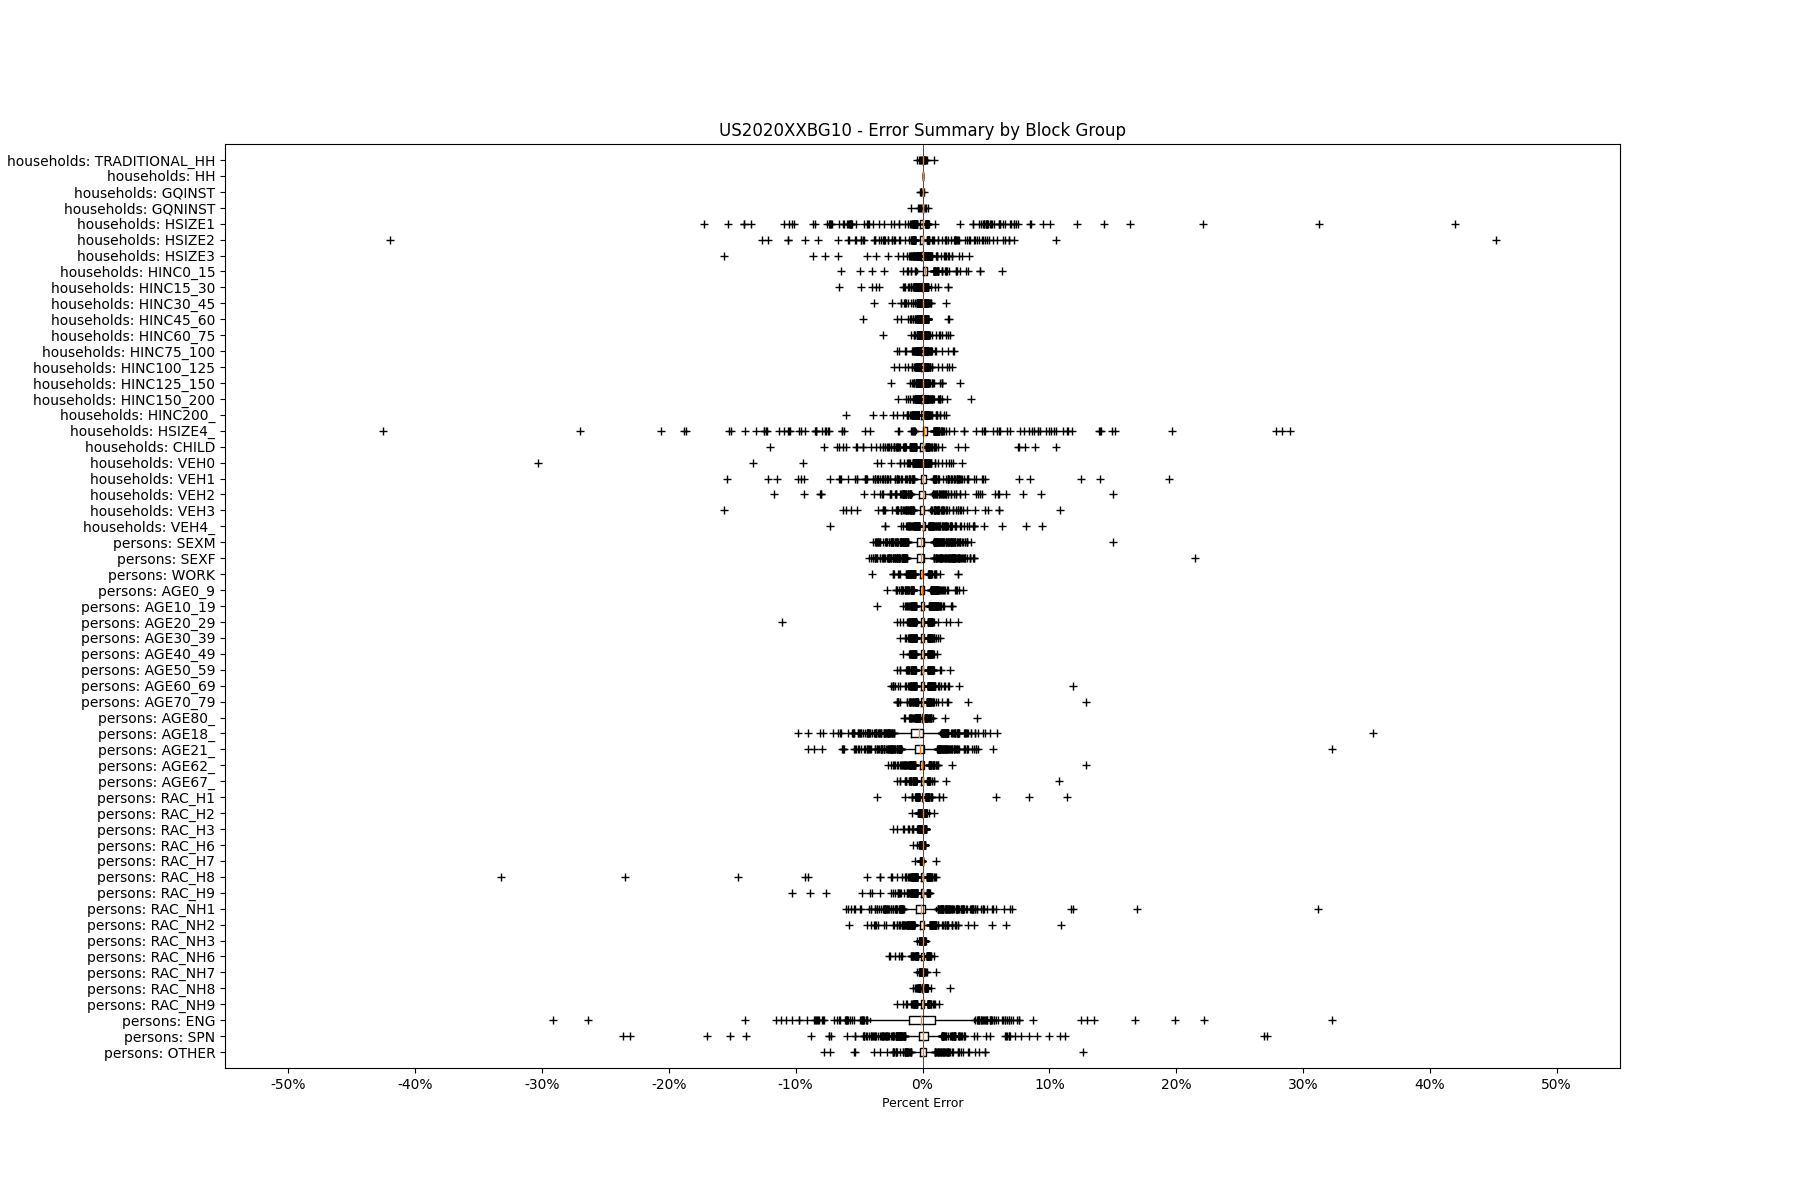
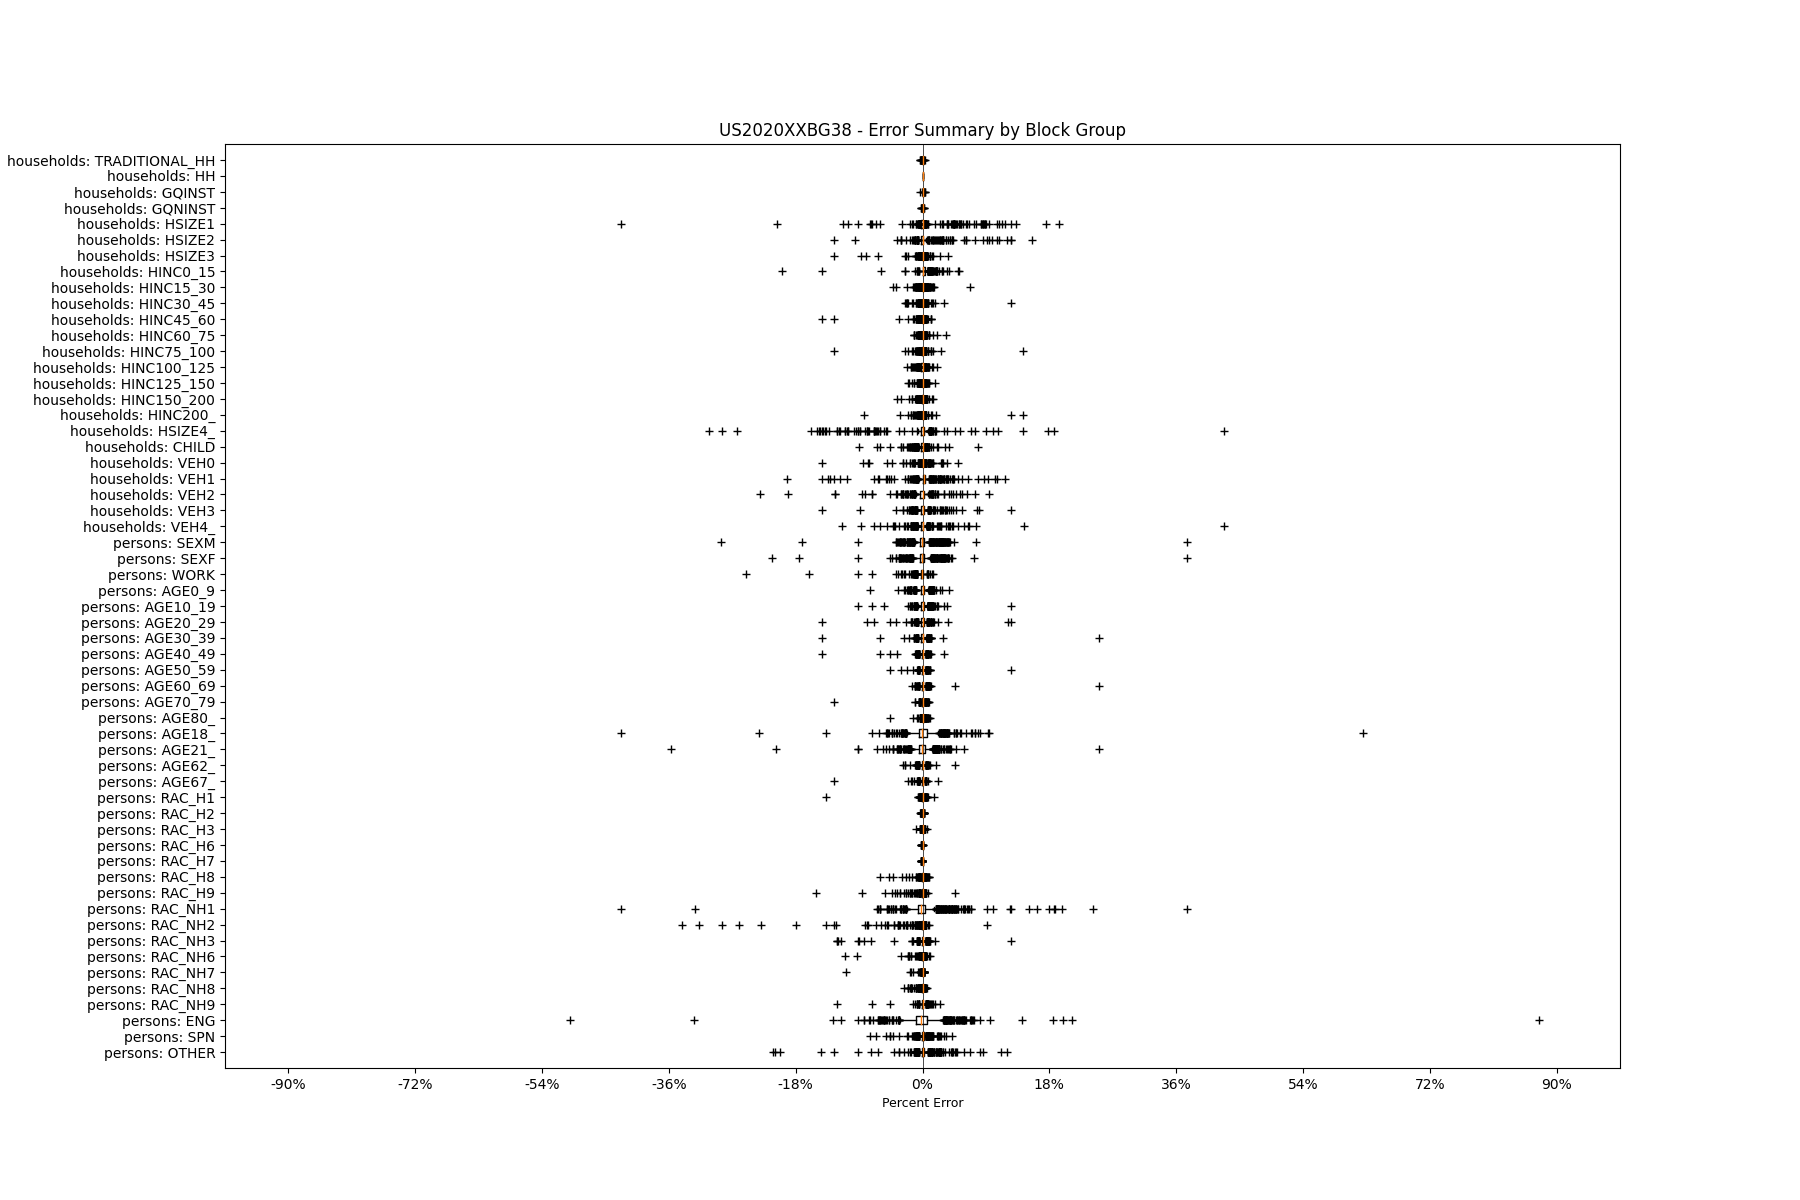
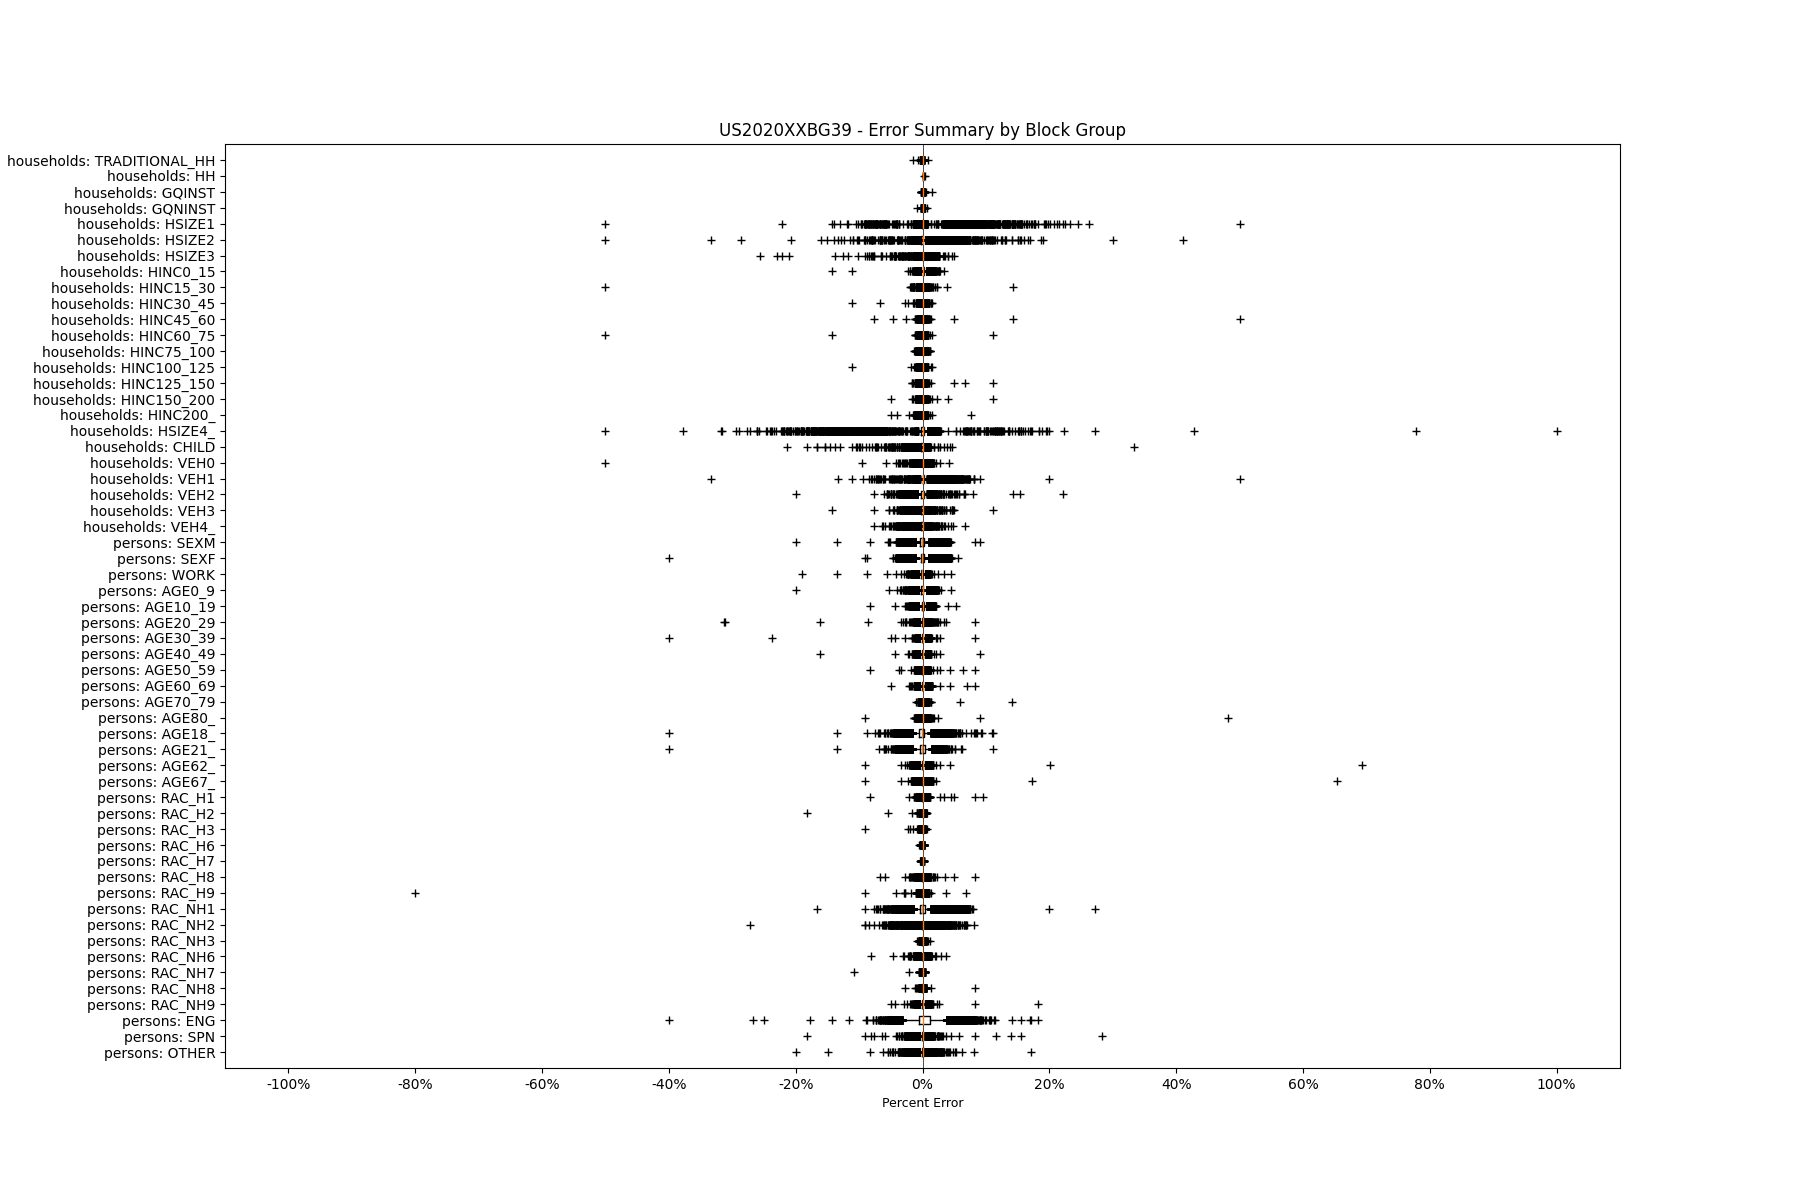
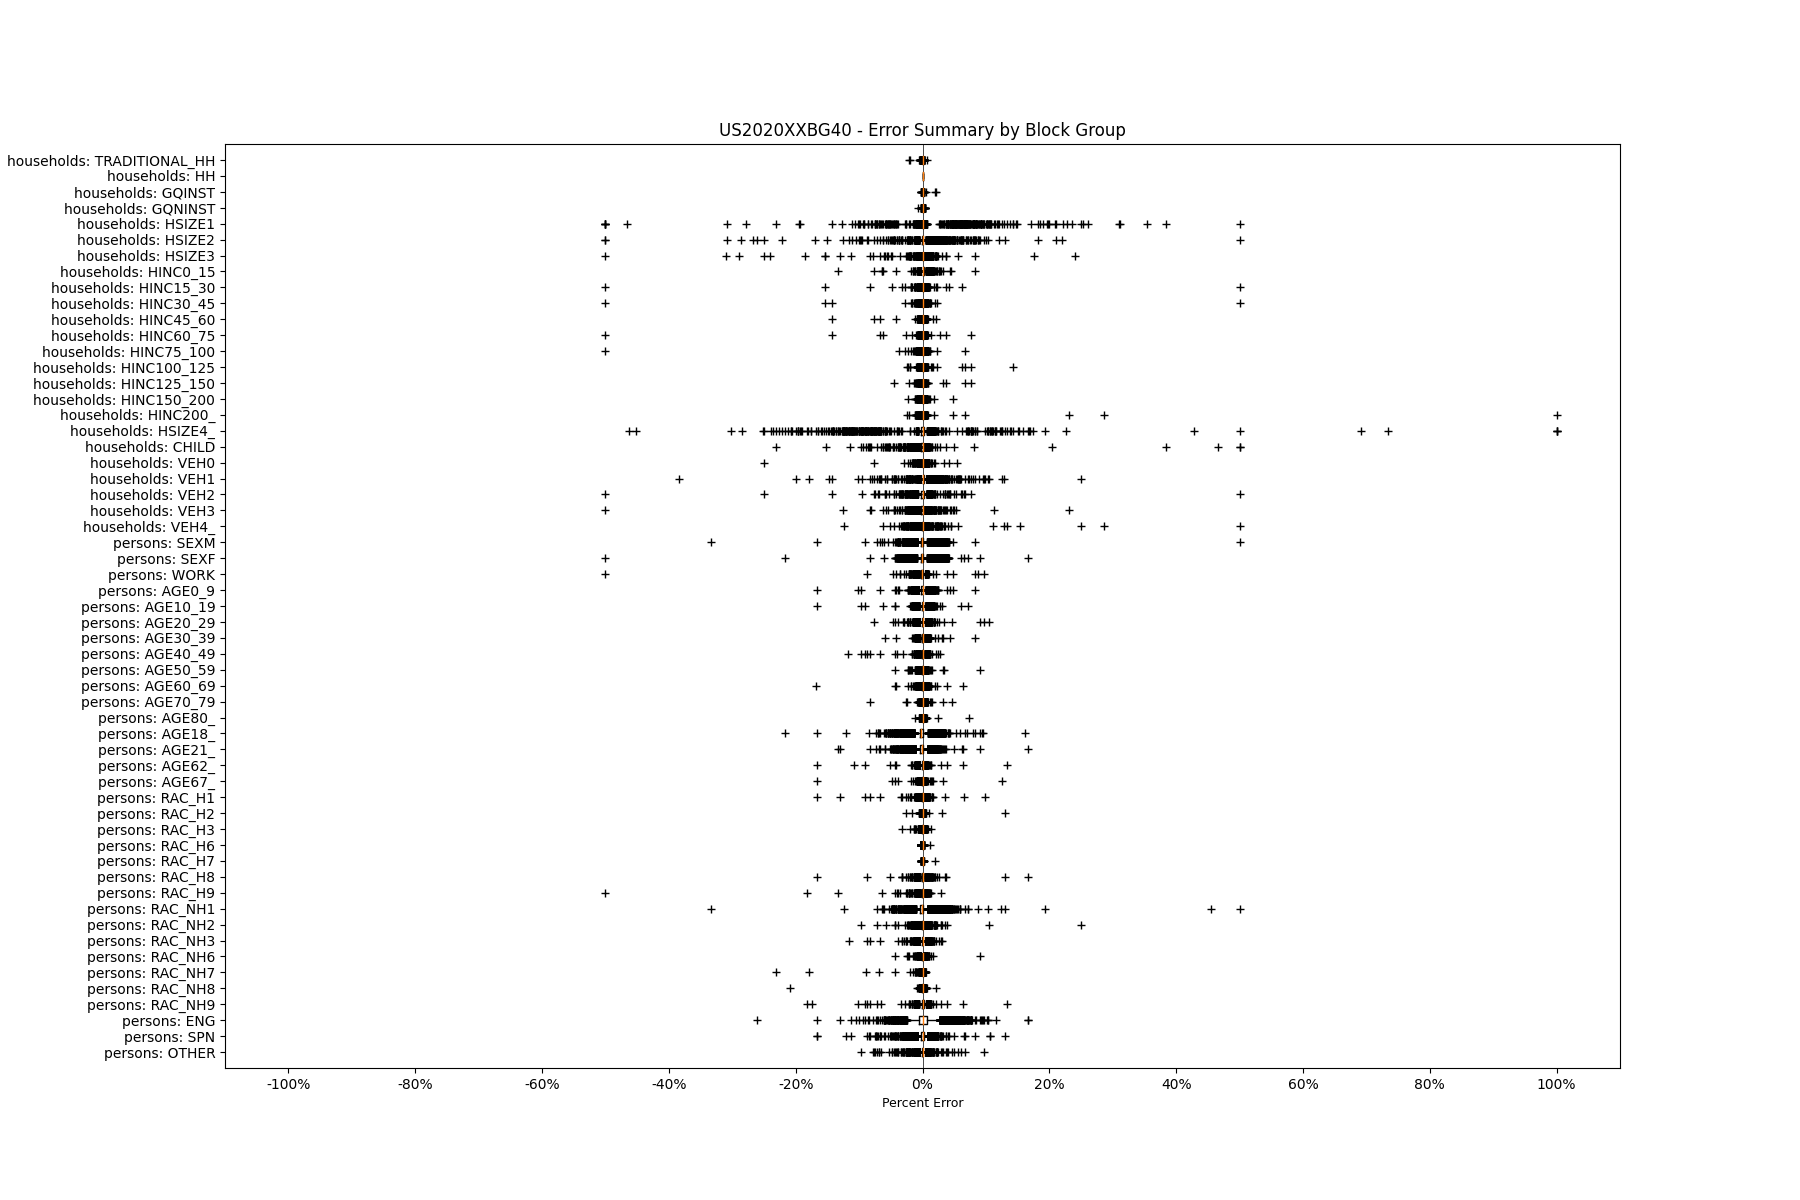
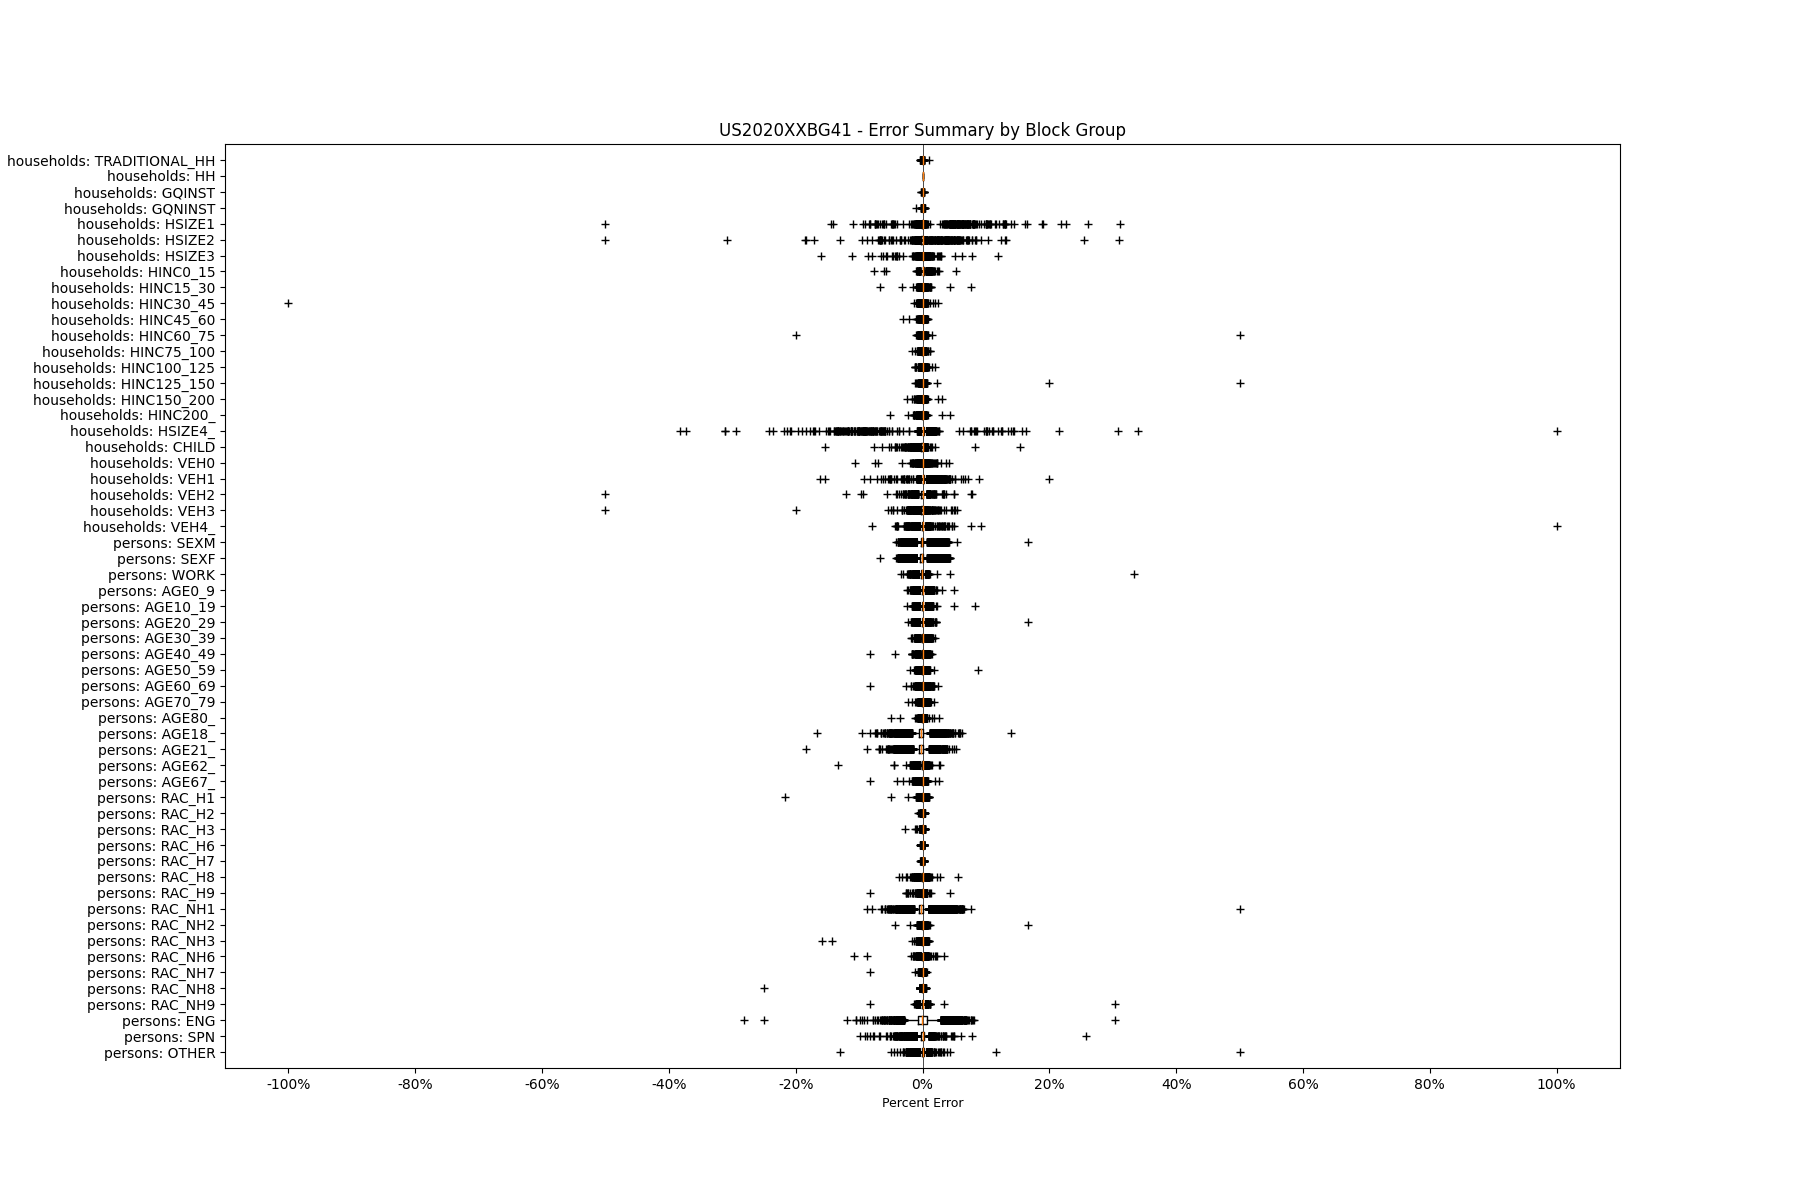
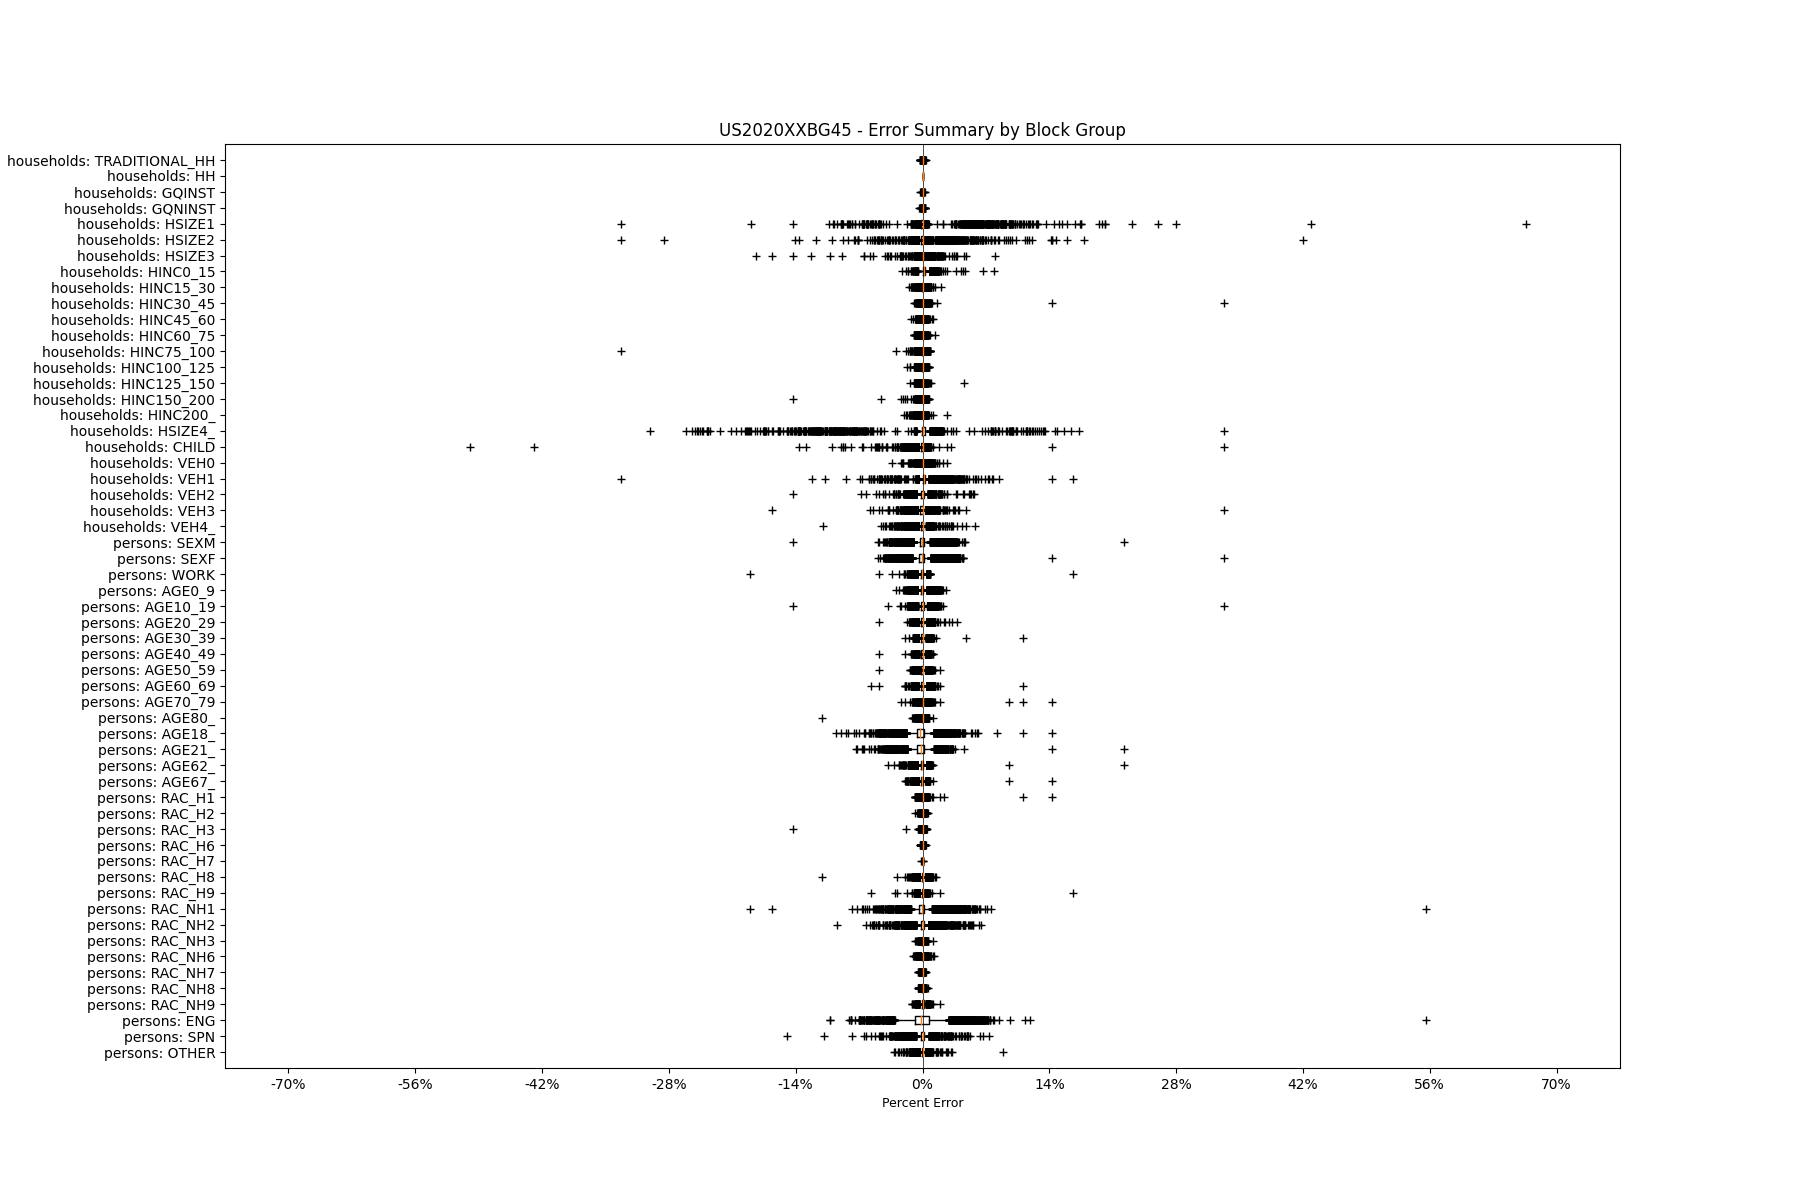
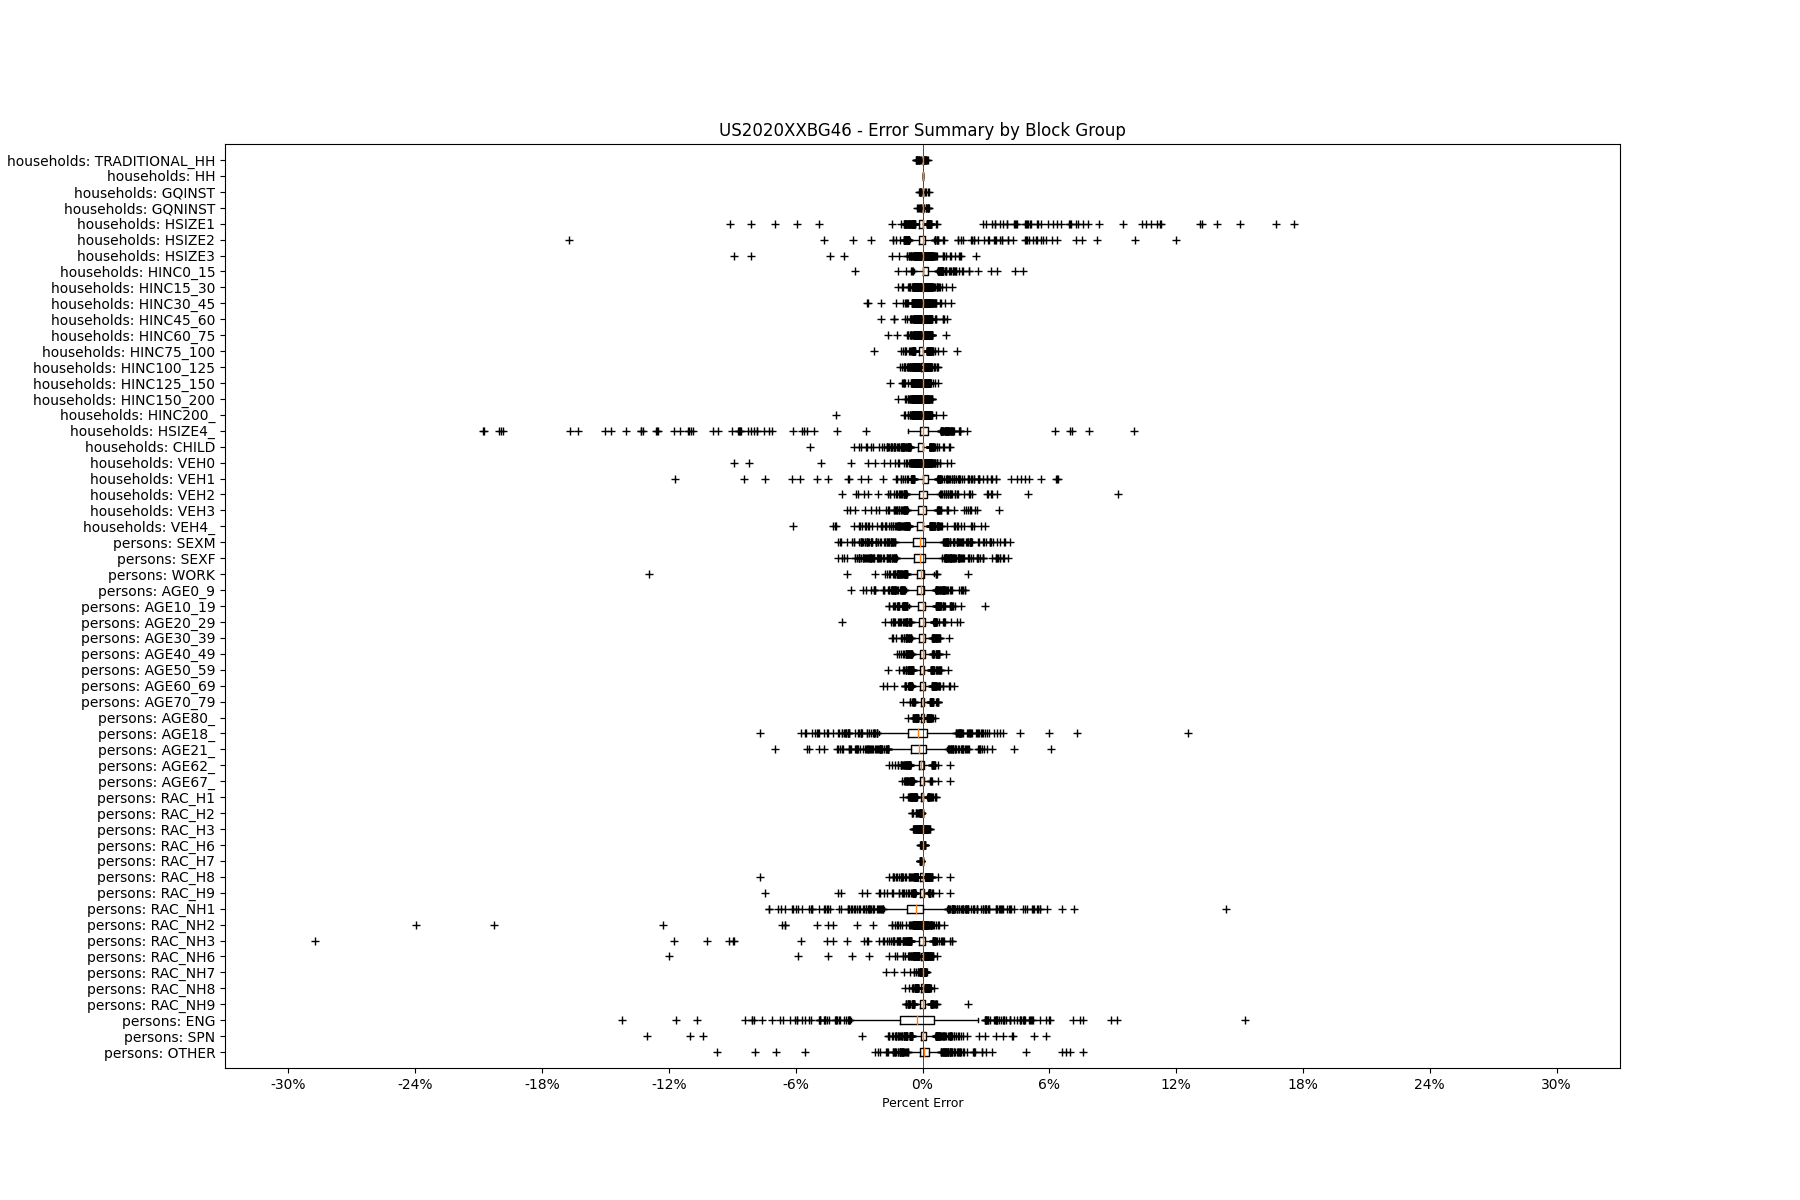
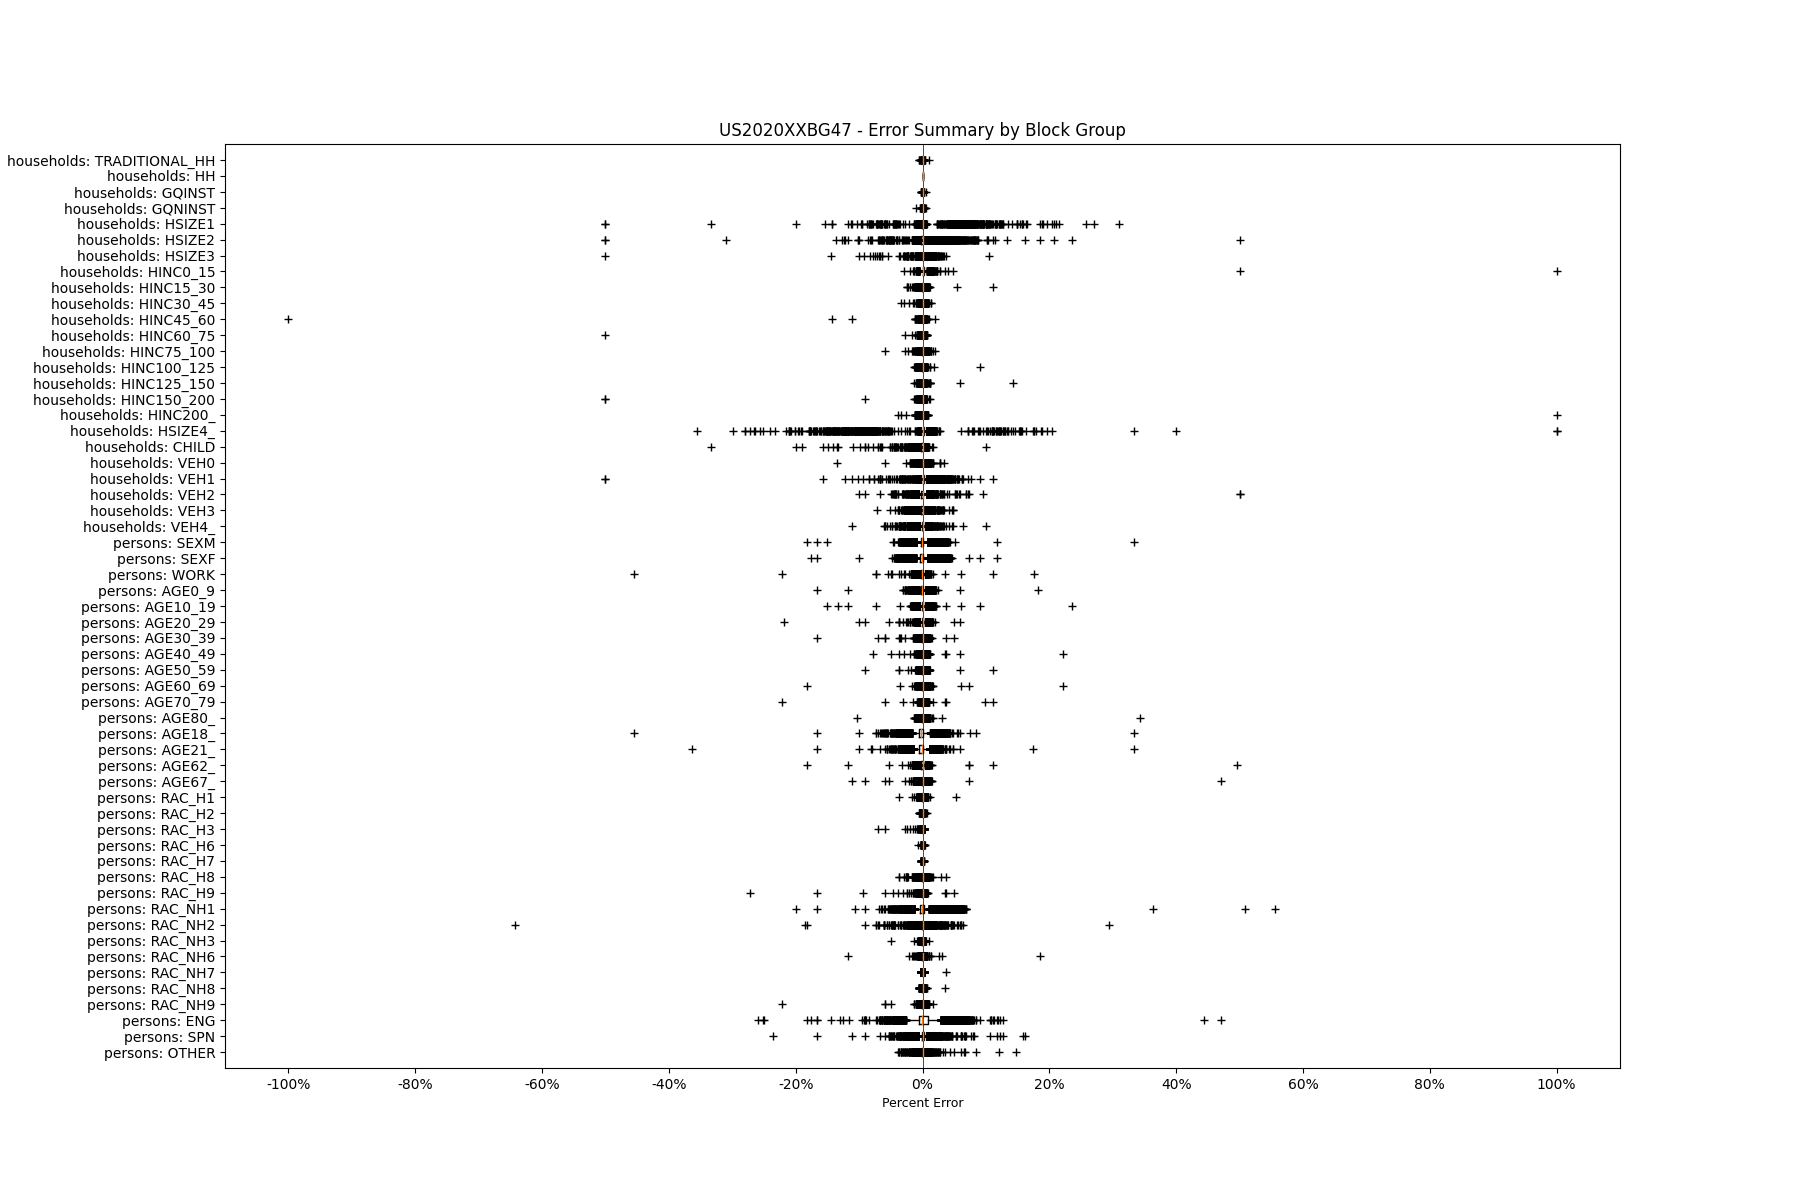
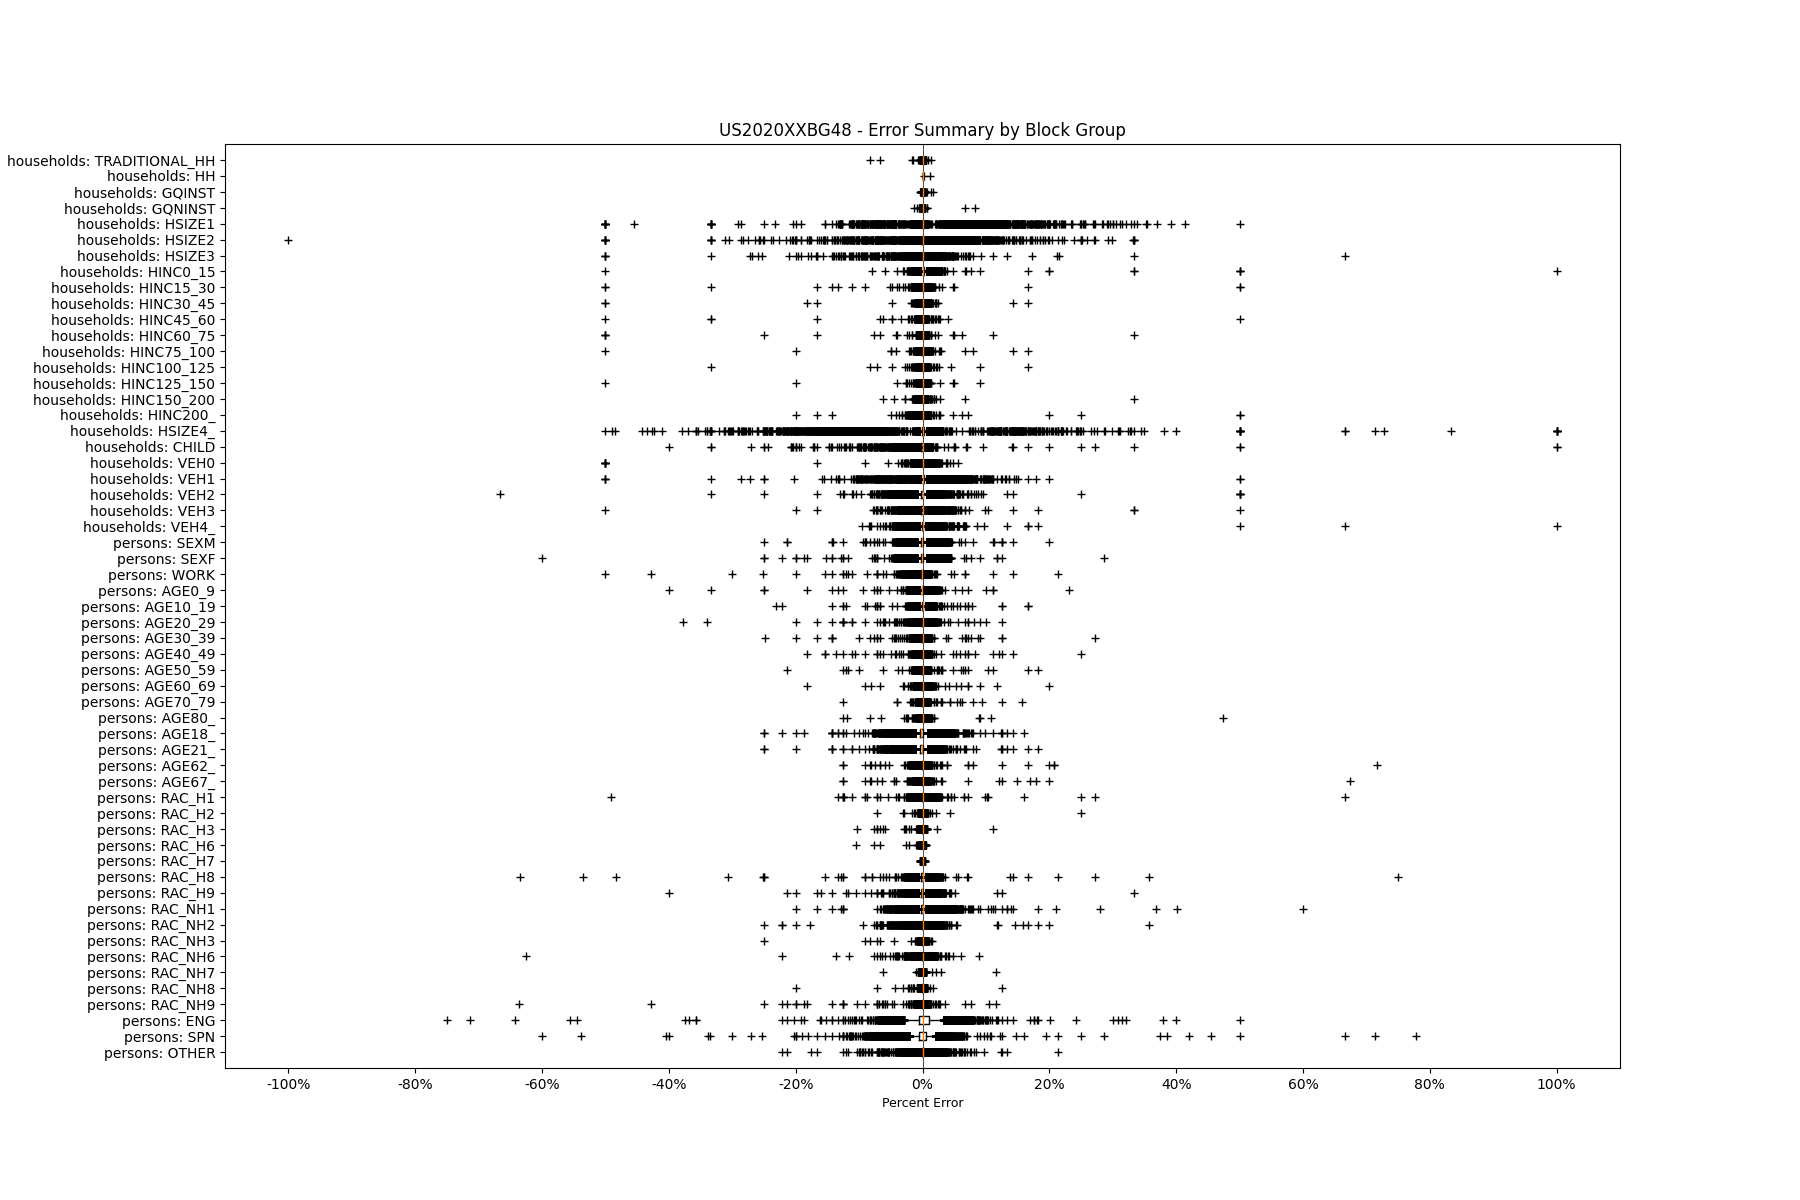
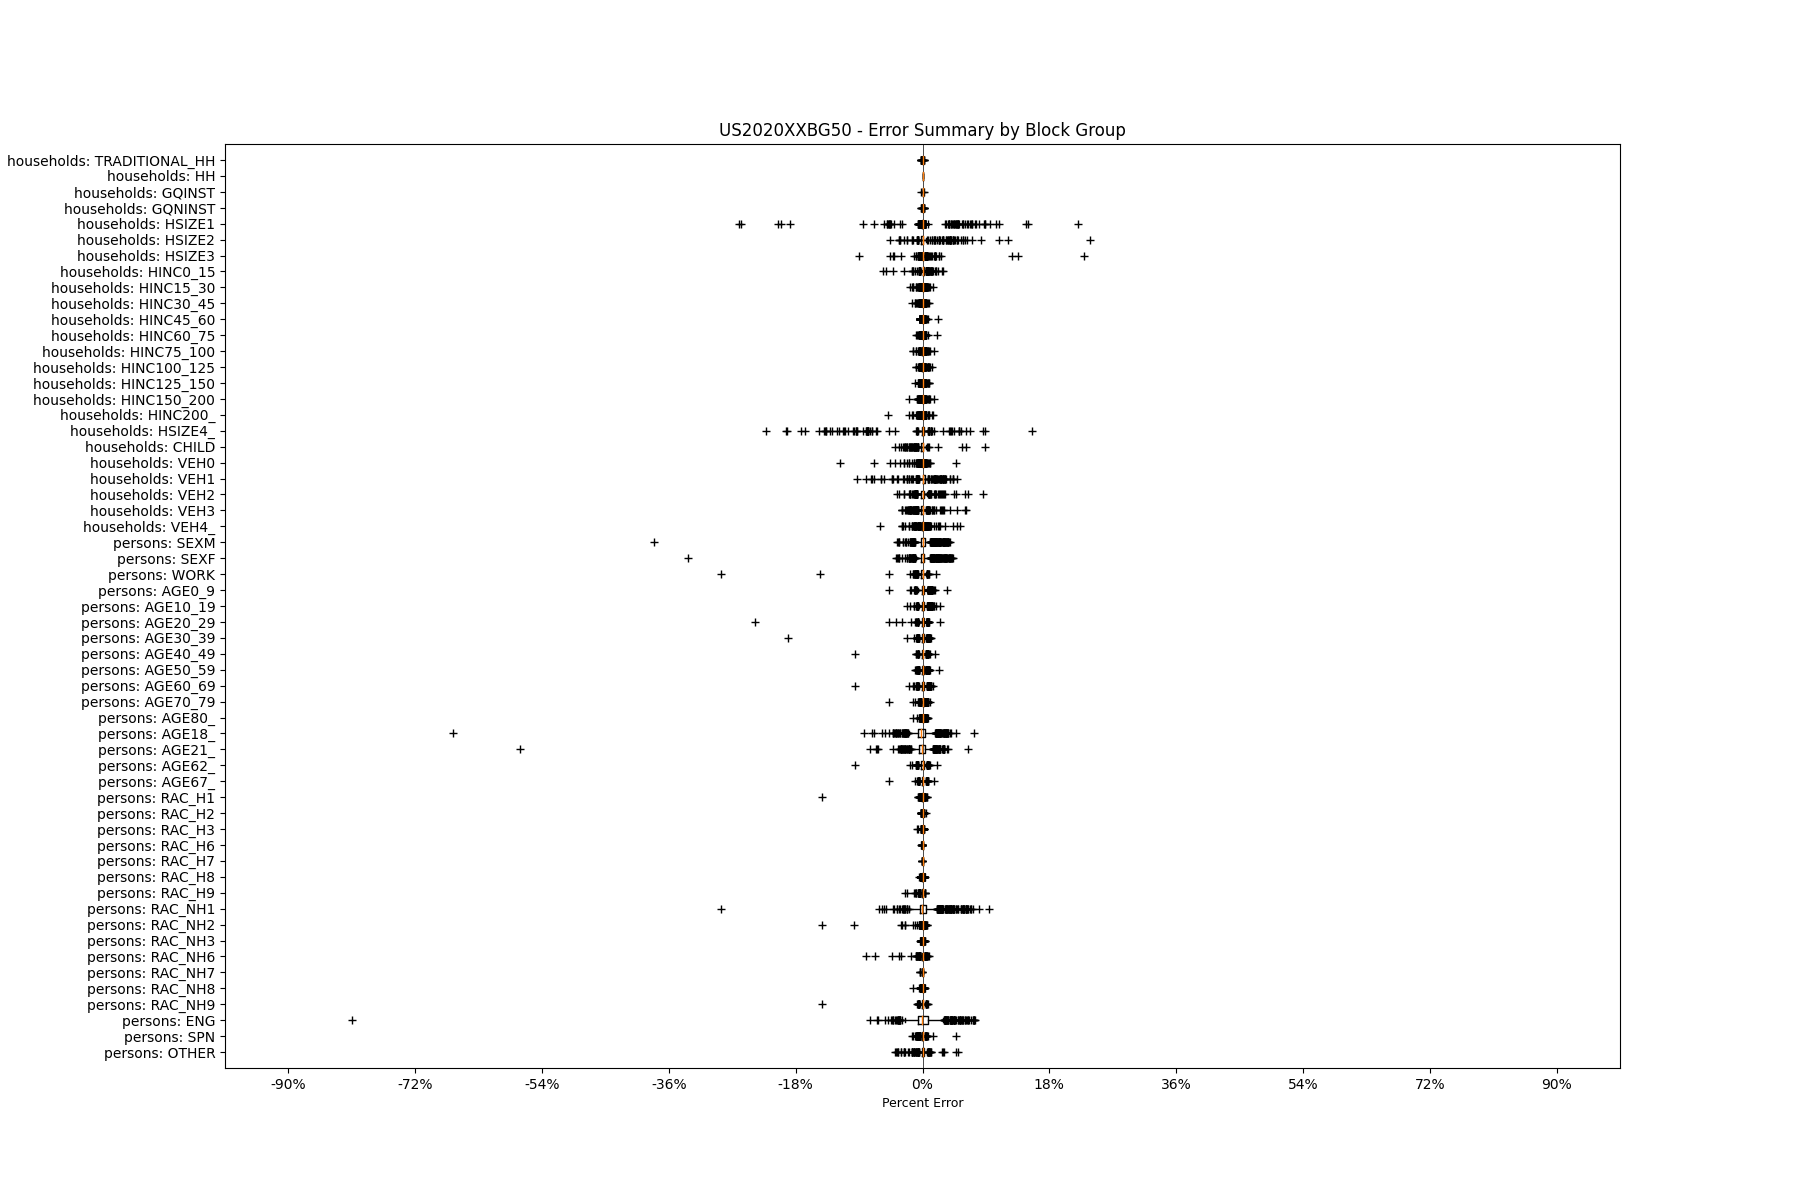
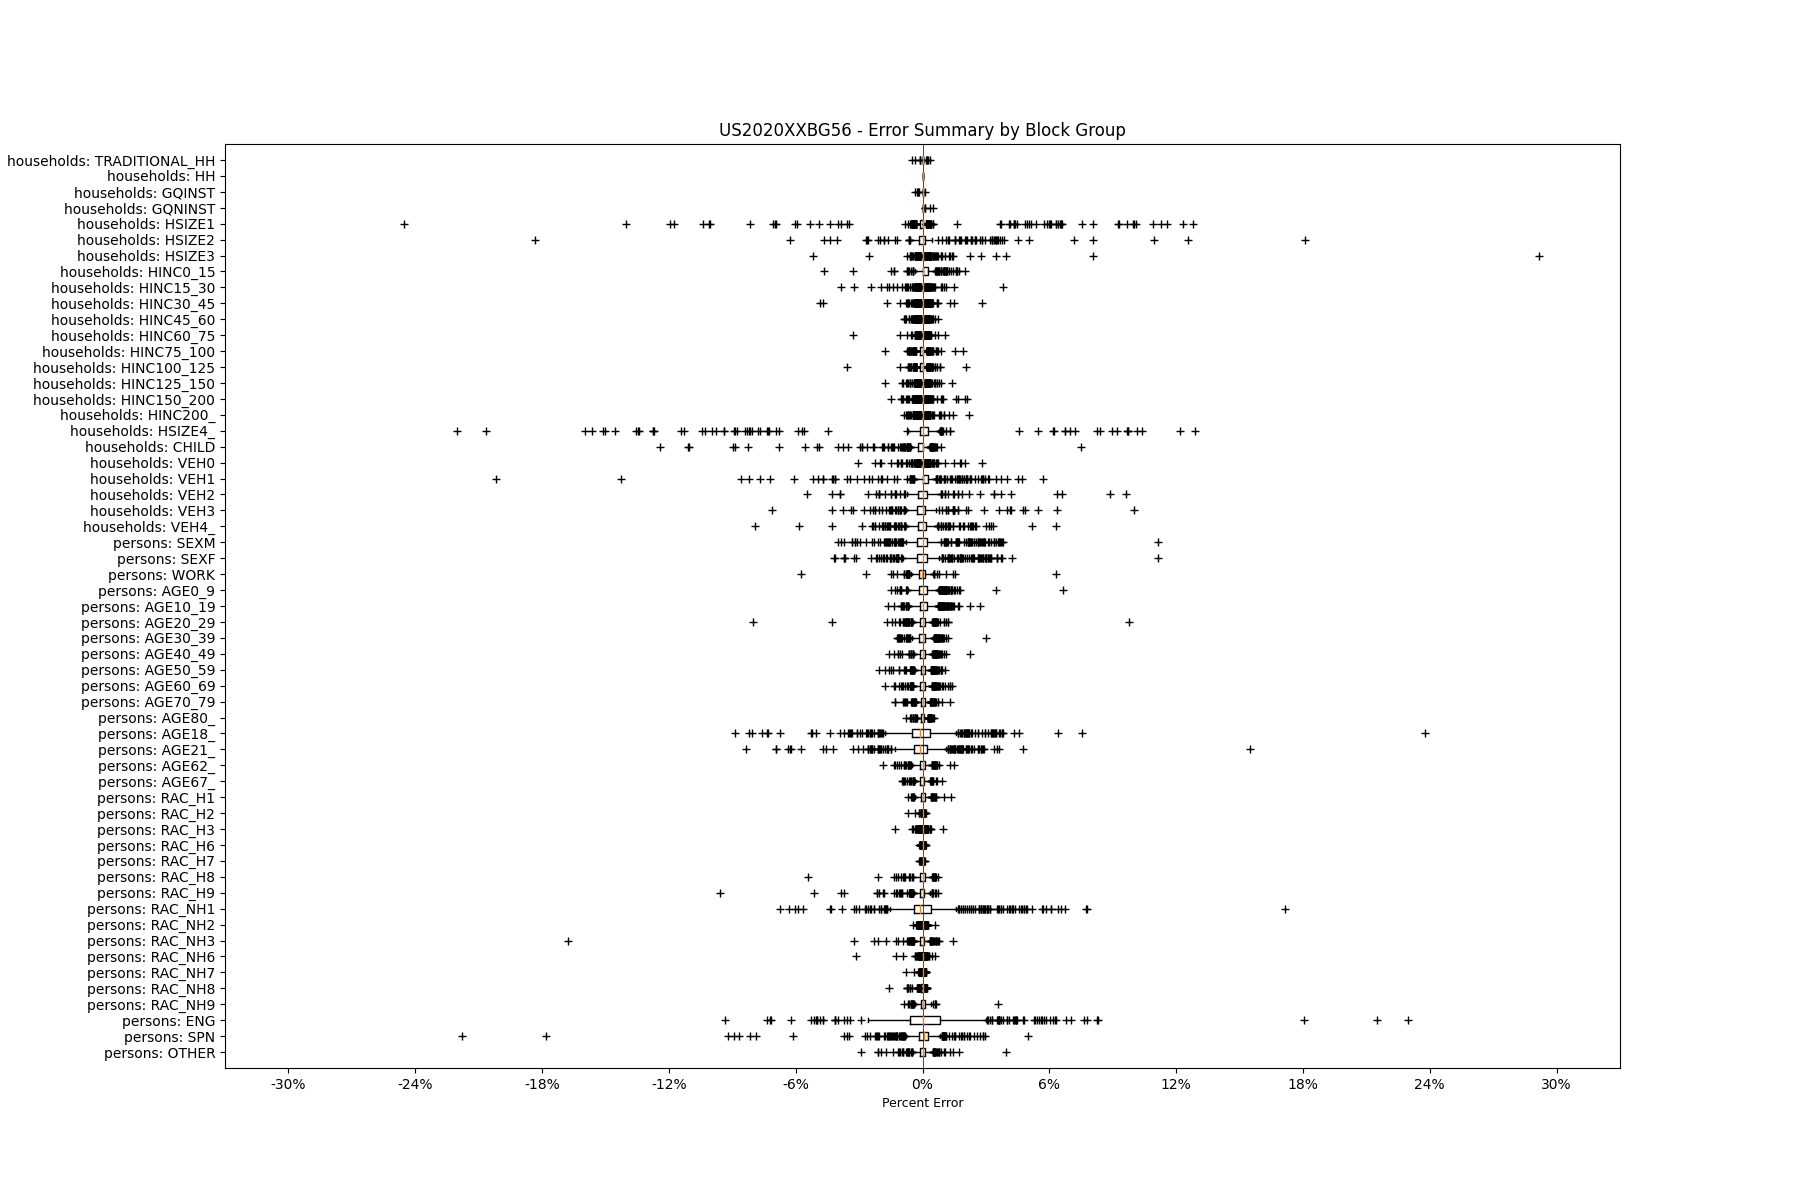
Validation at Neighborhood Level
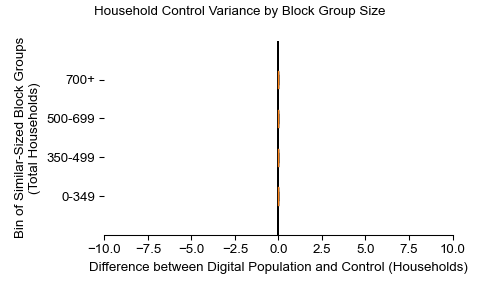
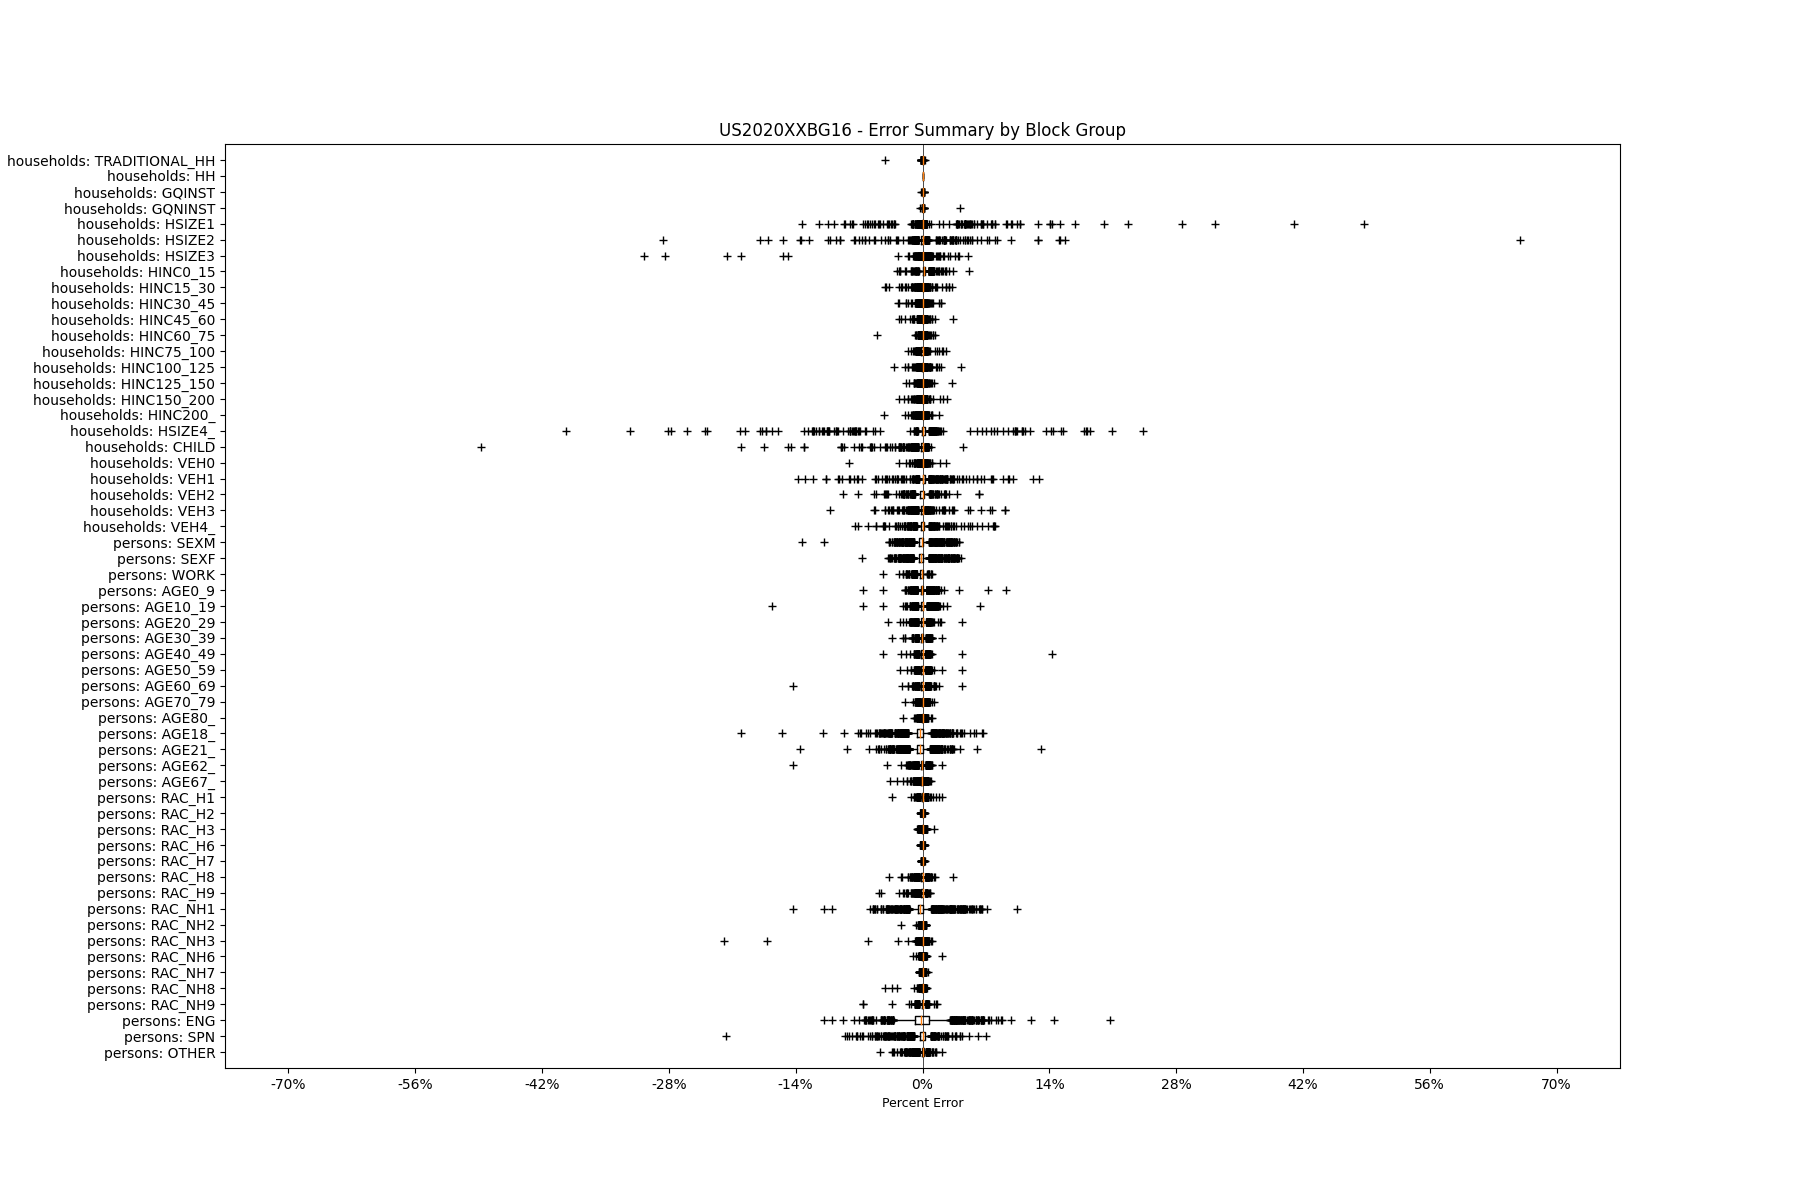
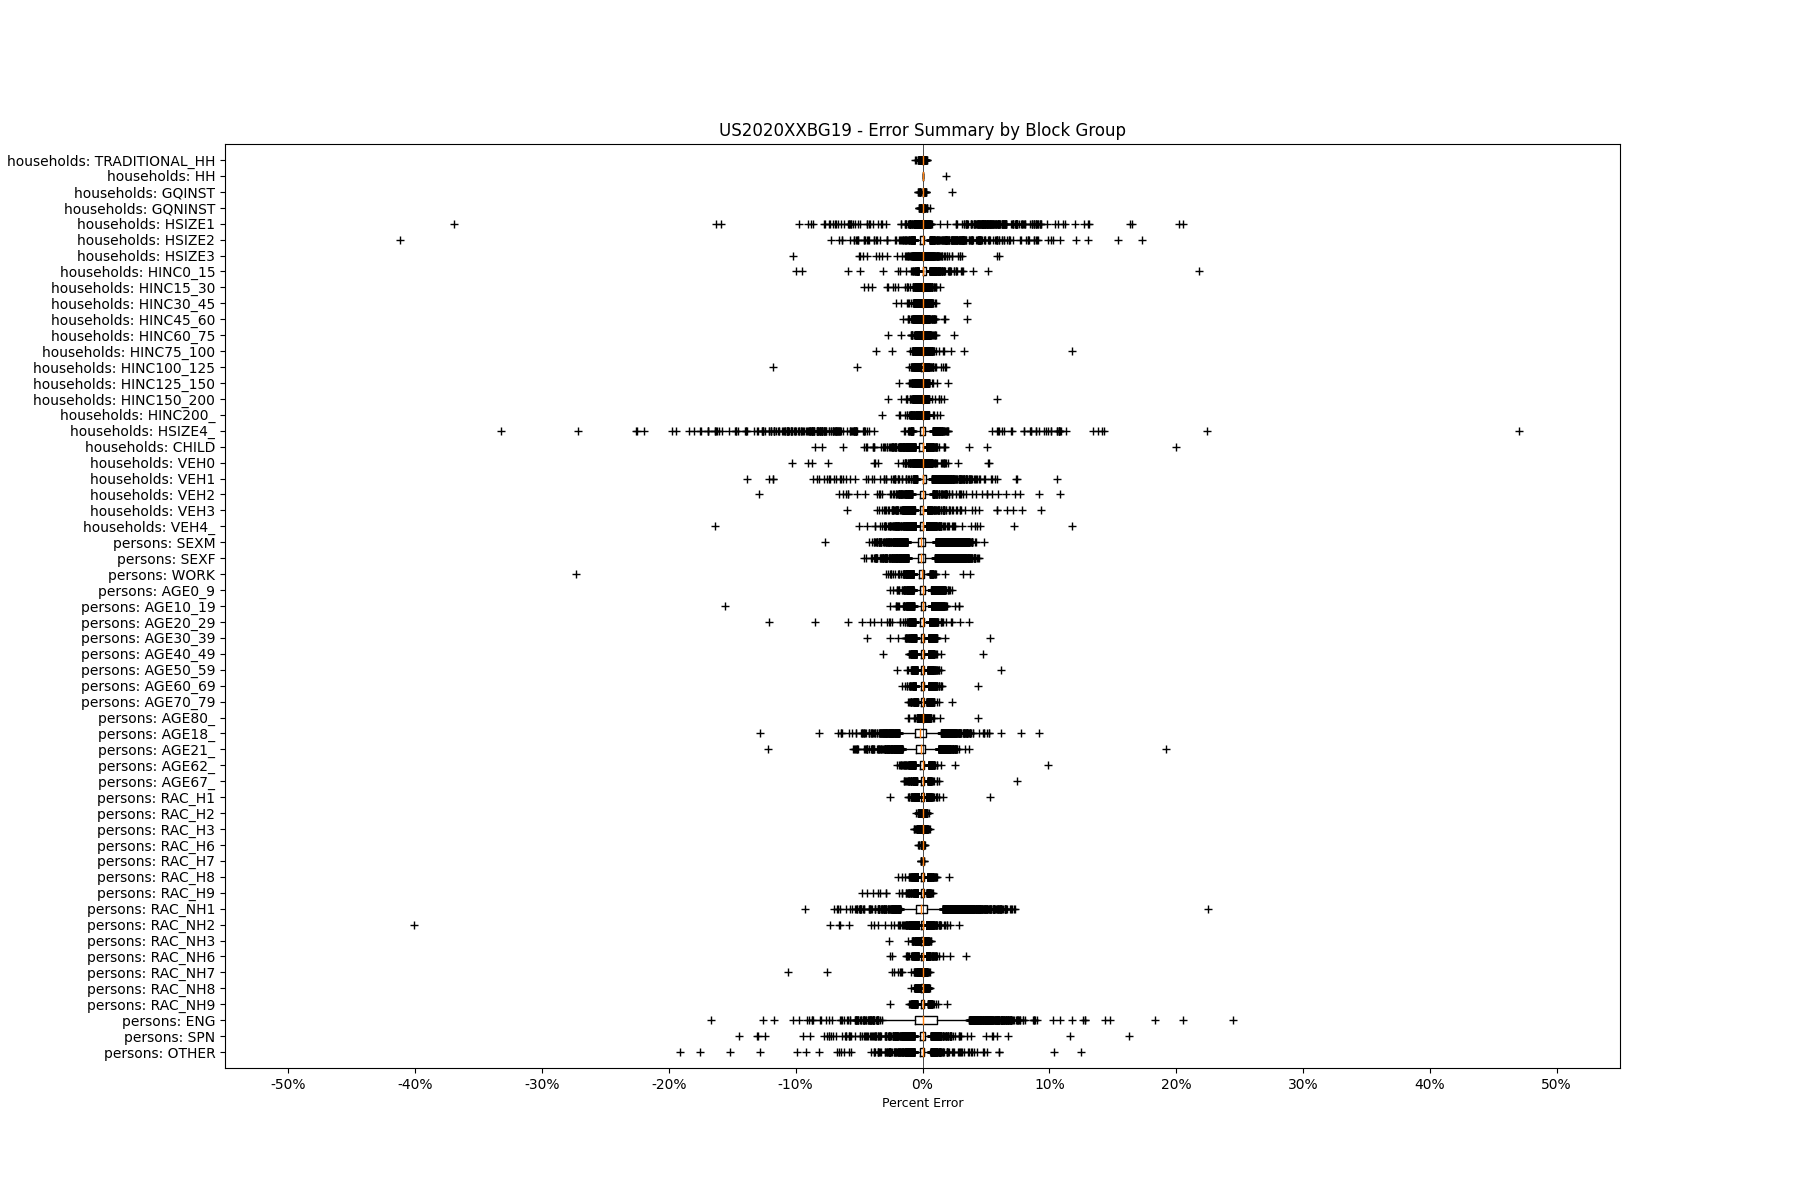
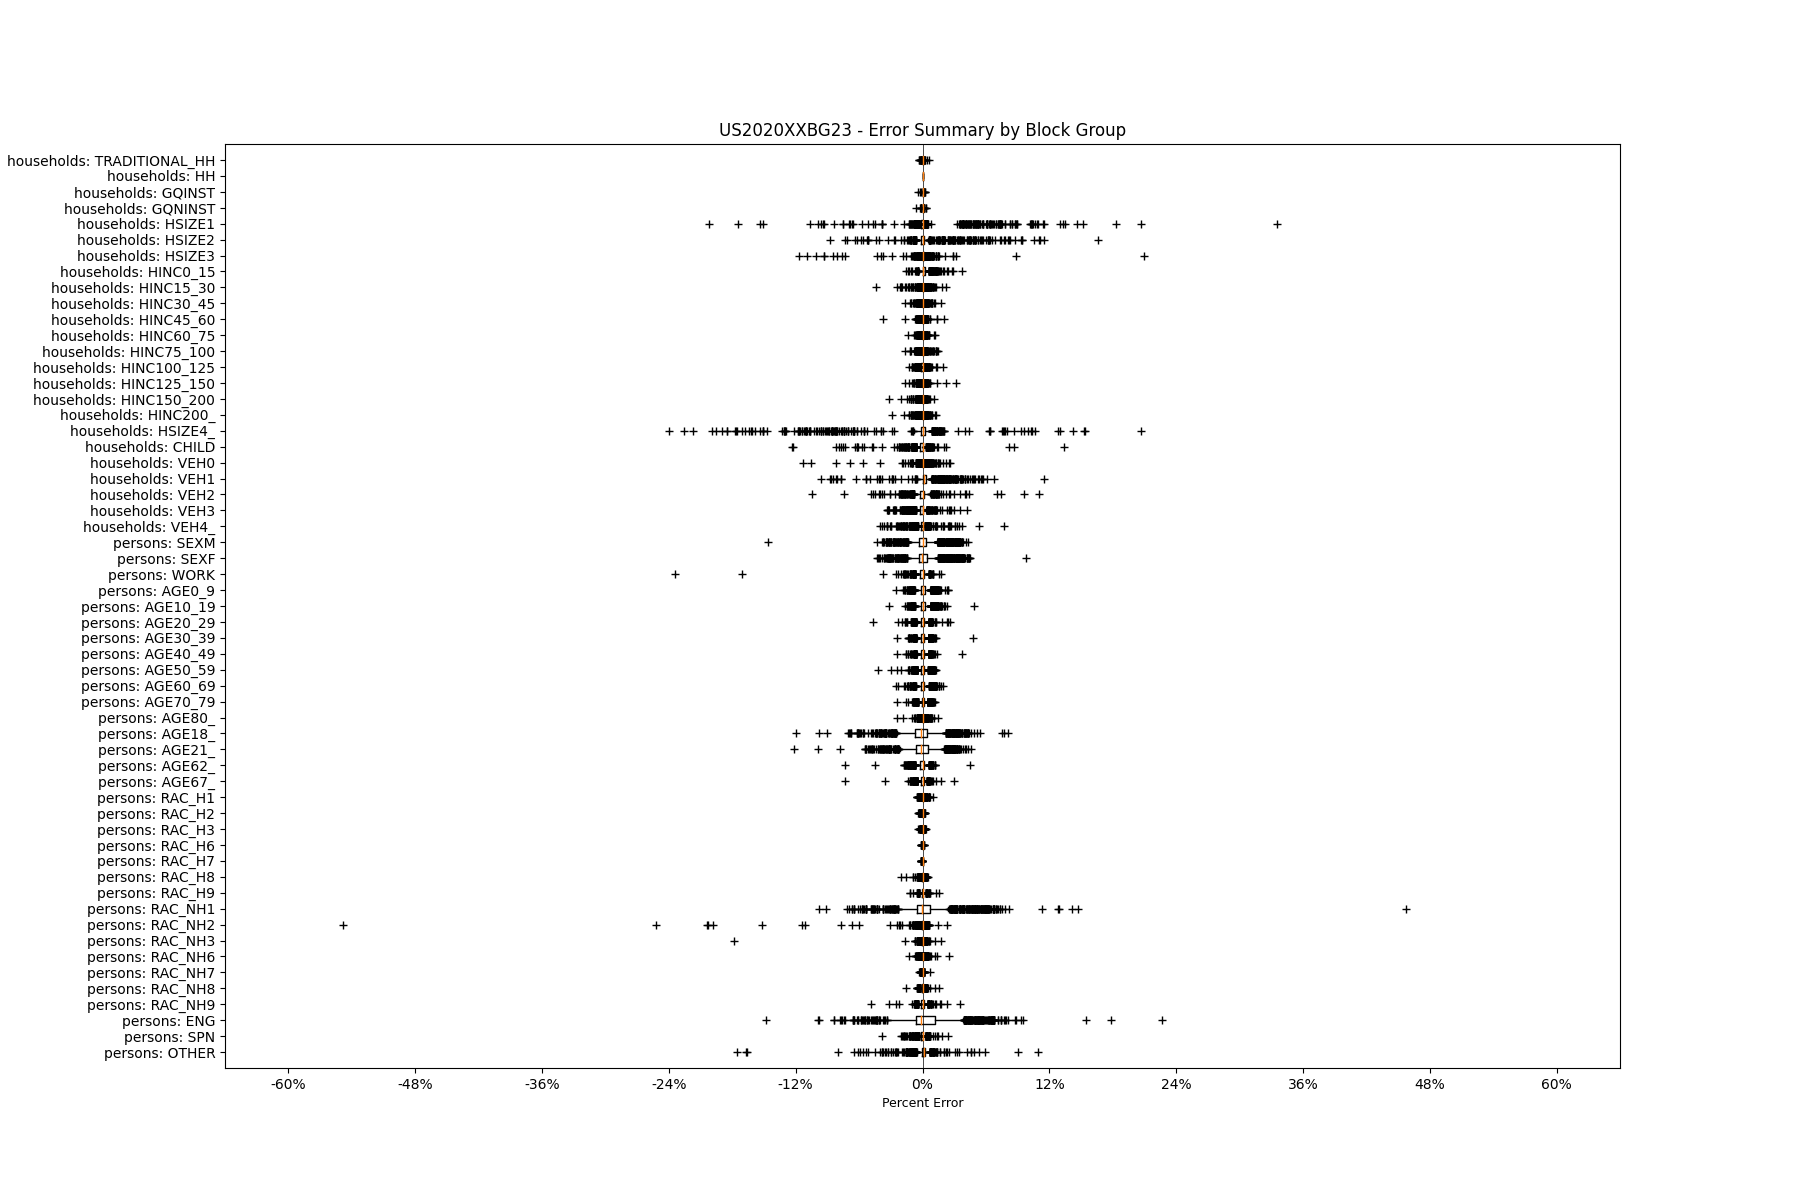
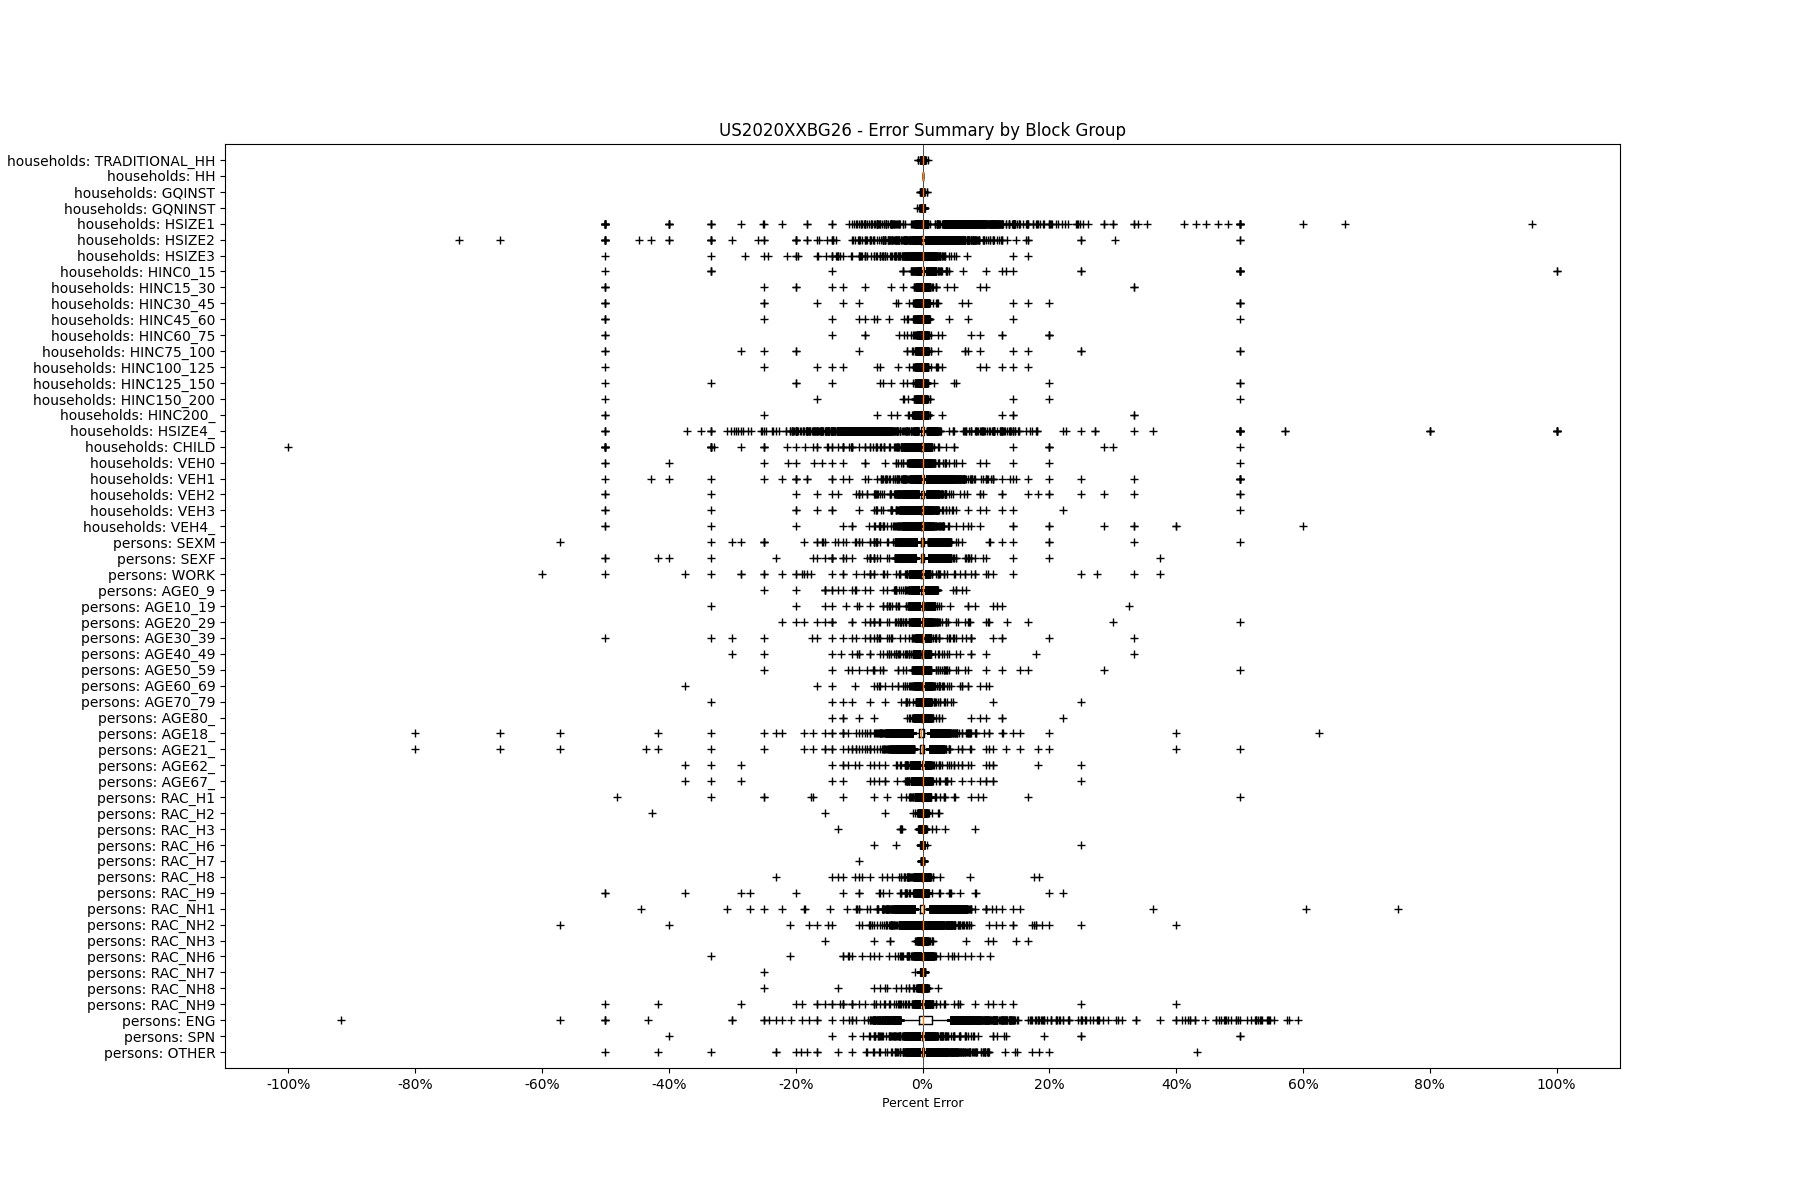
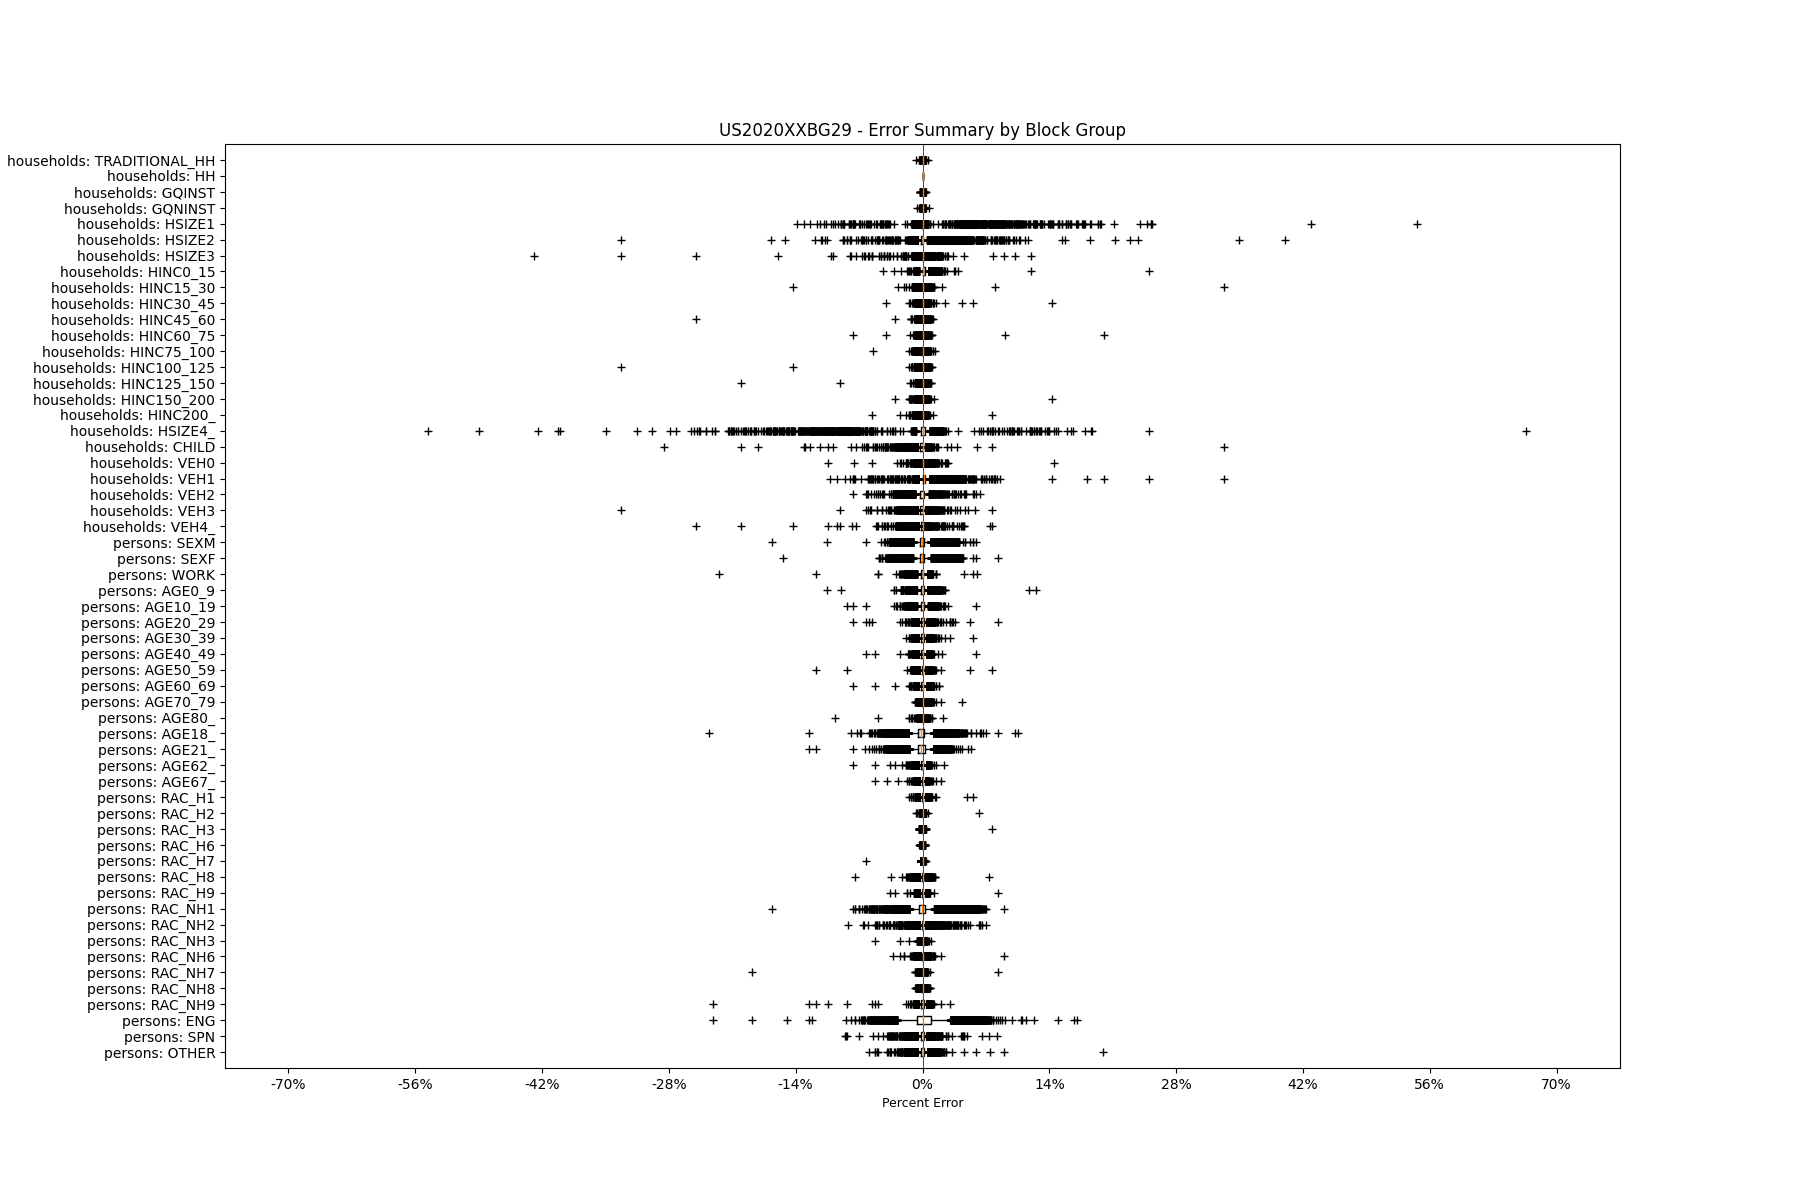
Motionworks’s Digital Population is also validated against each of the controlled variables at the neighborhood level, which in the United States is a U.S. Census Bureau Block Group. The plots below compare Motionworks' Digital Population totals and the control totals.
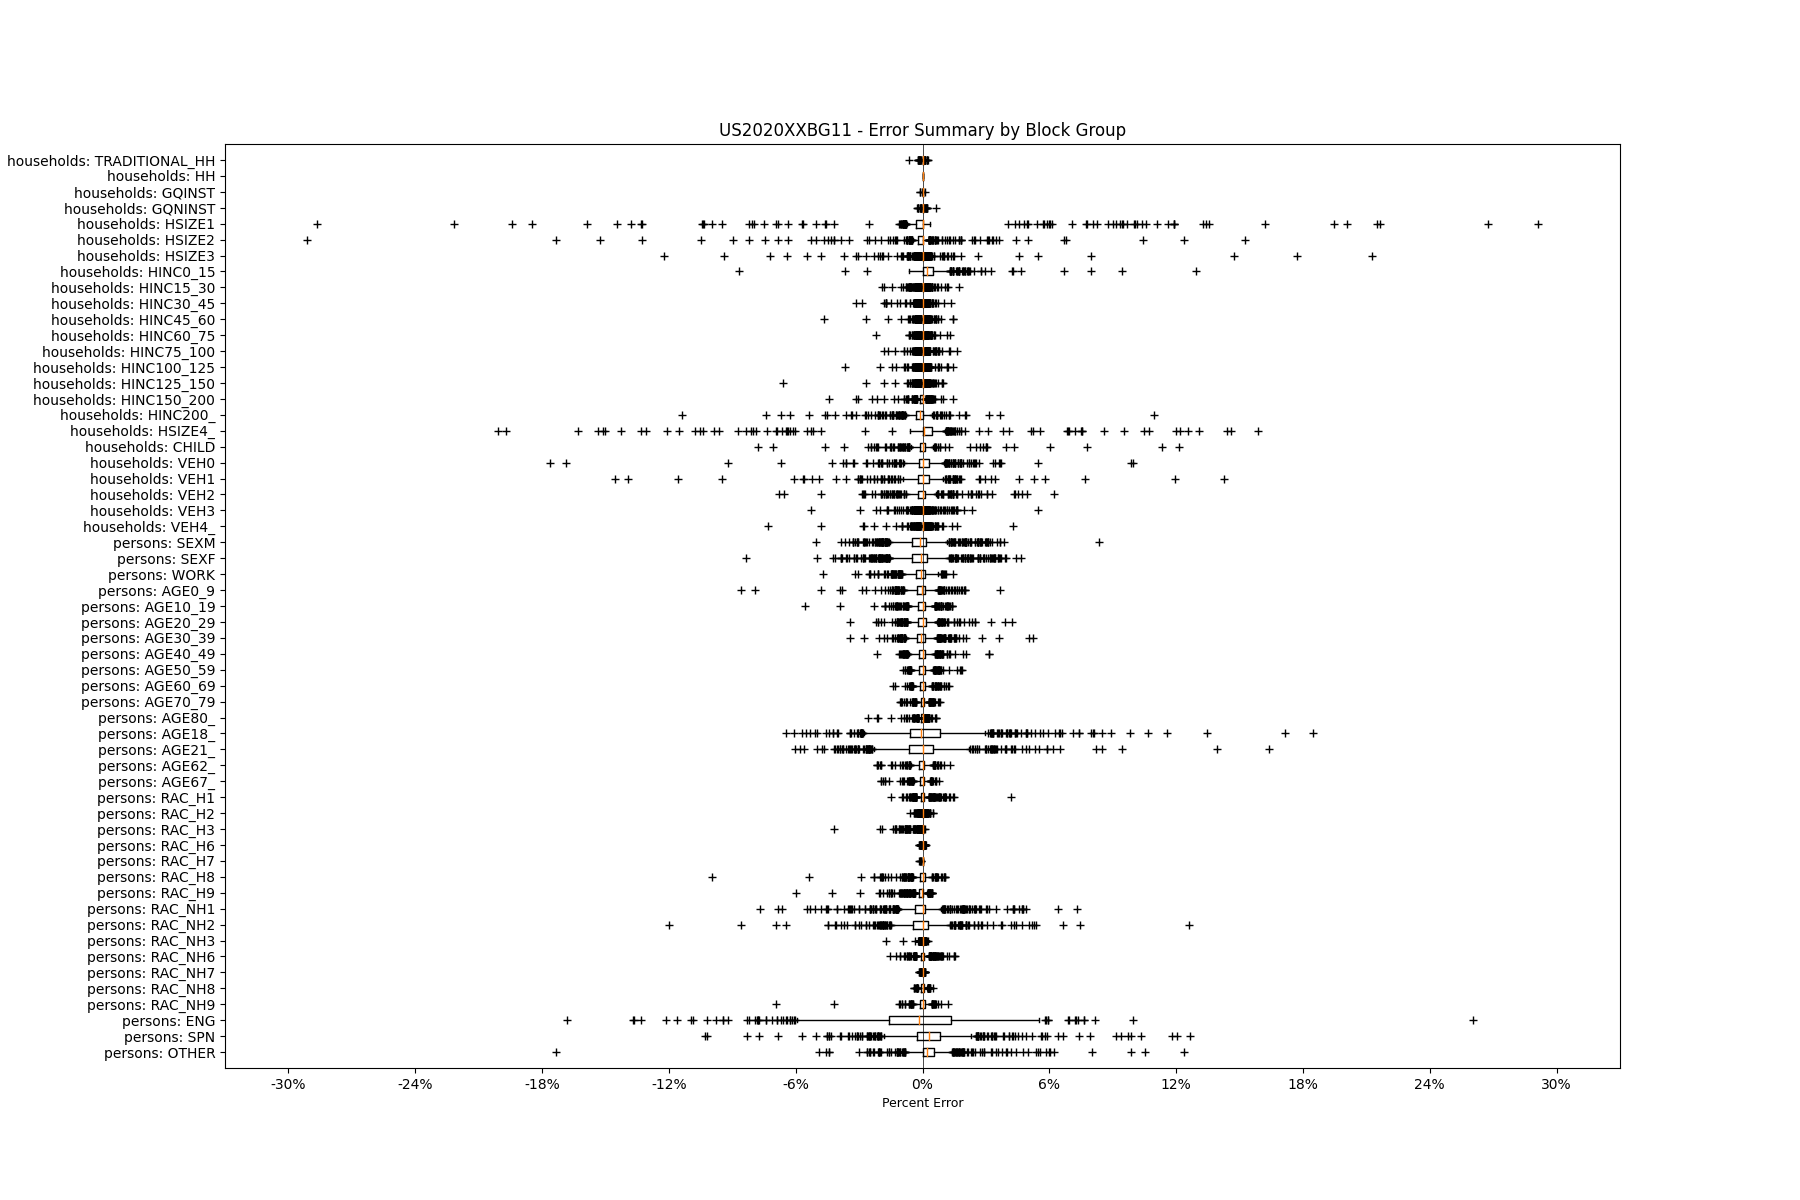
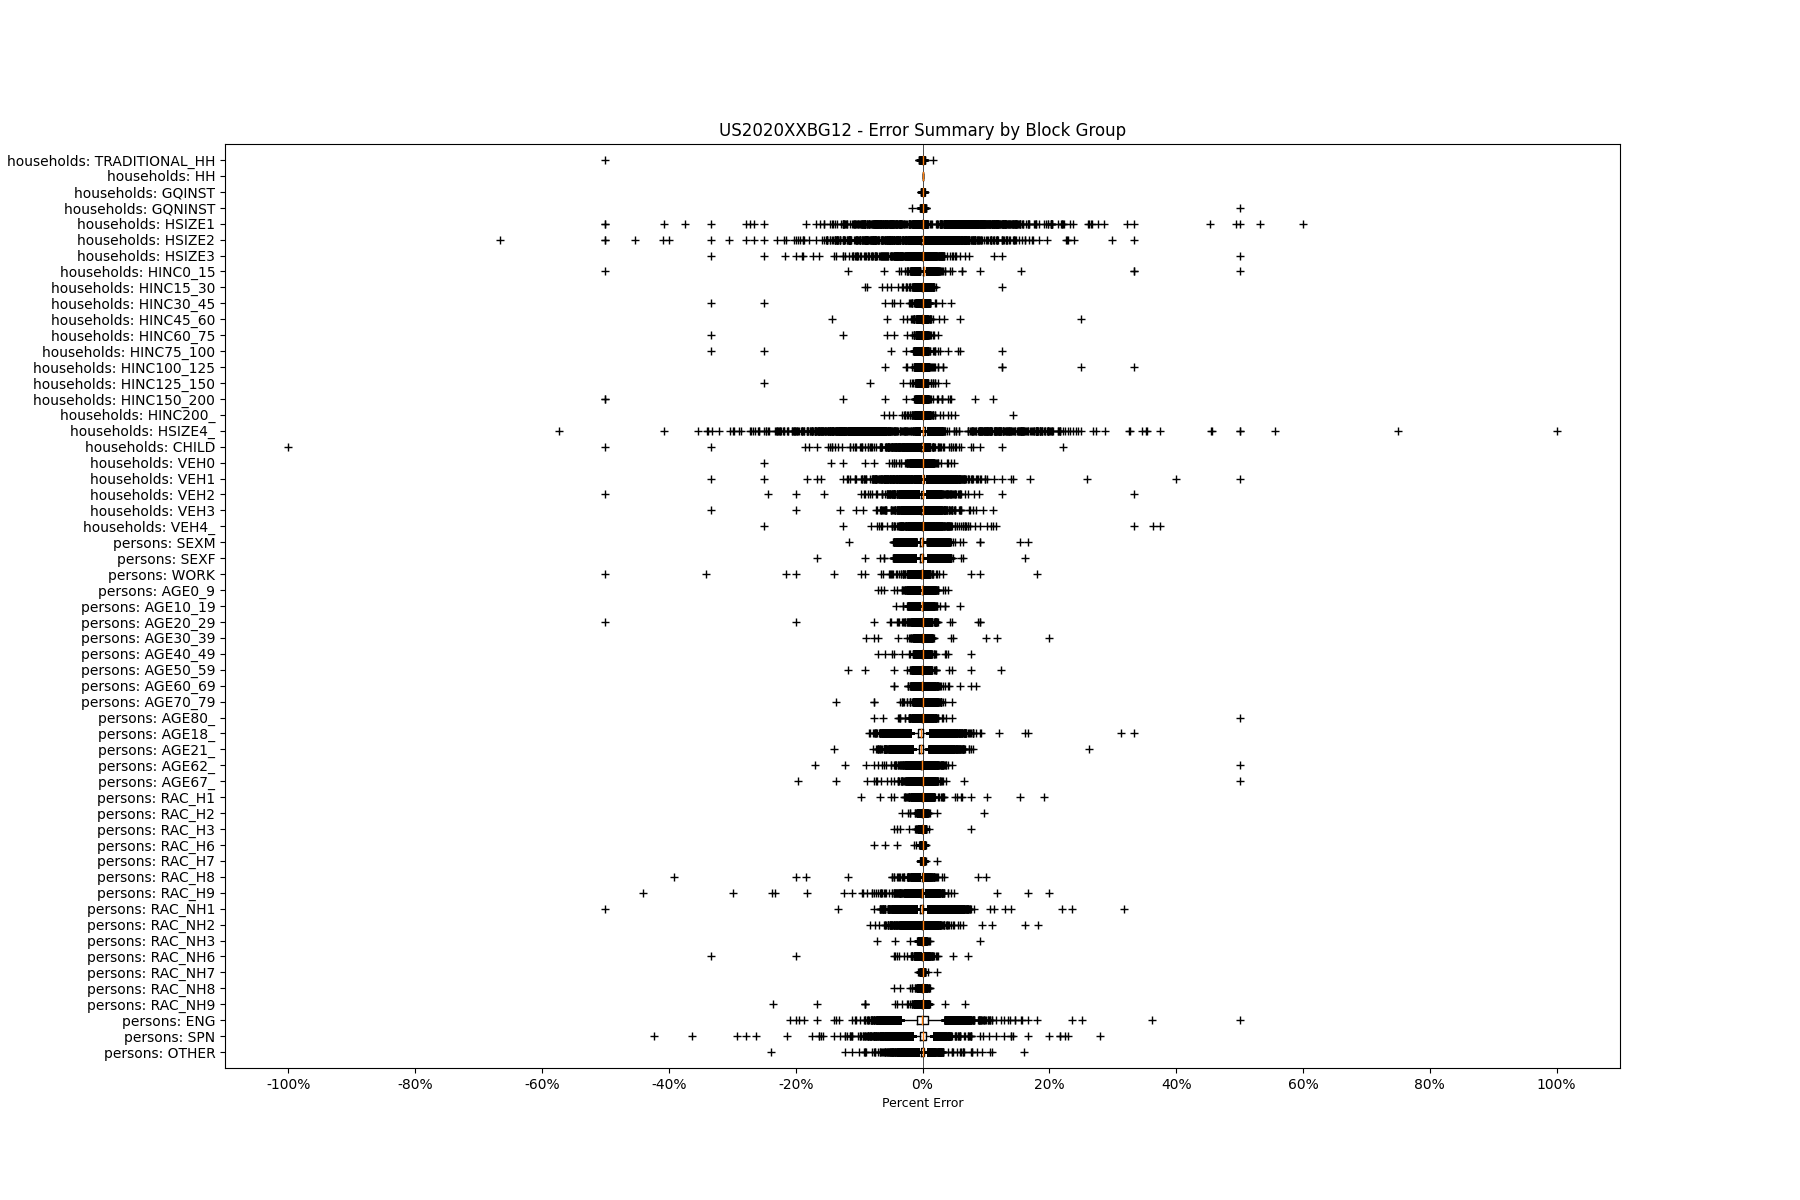
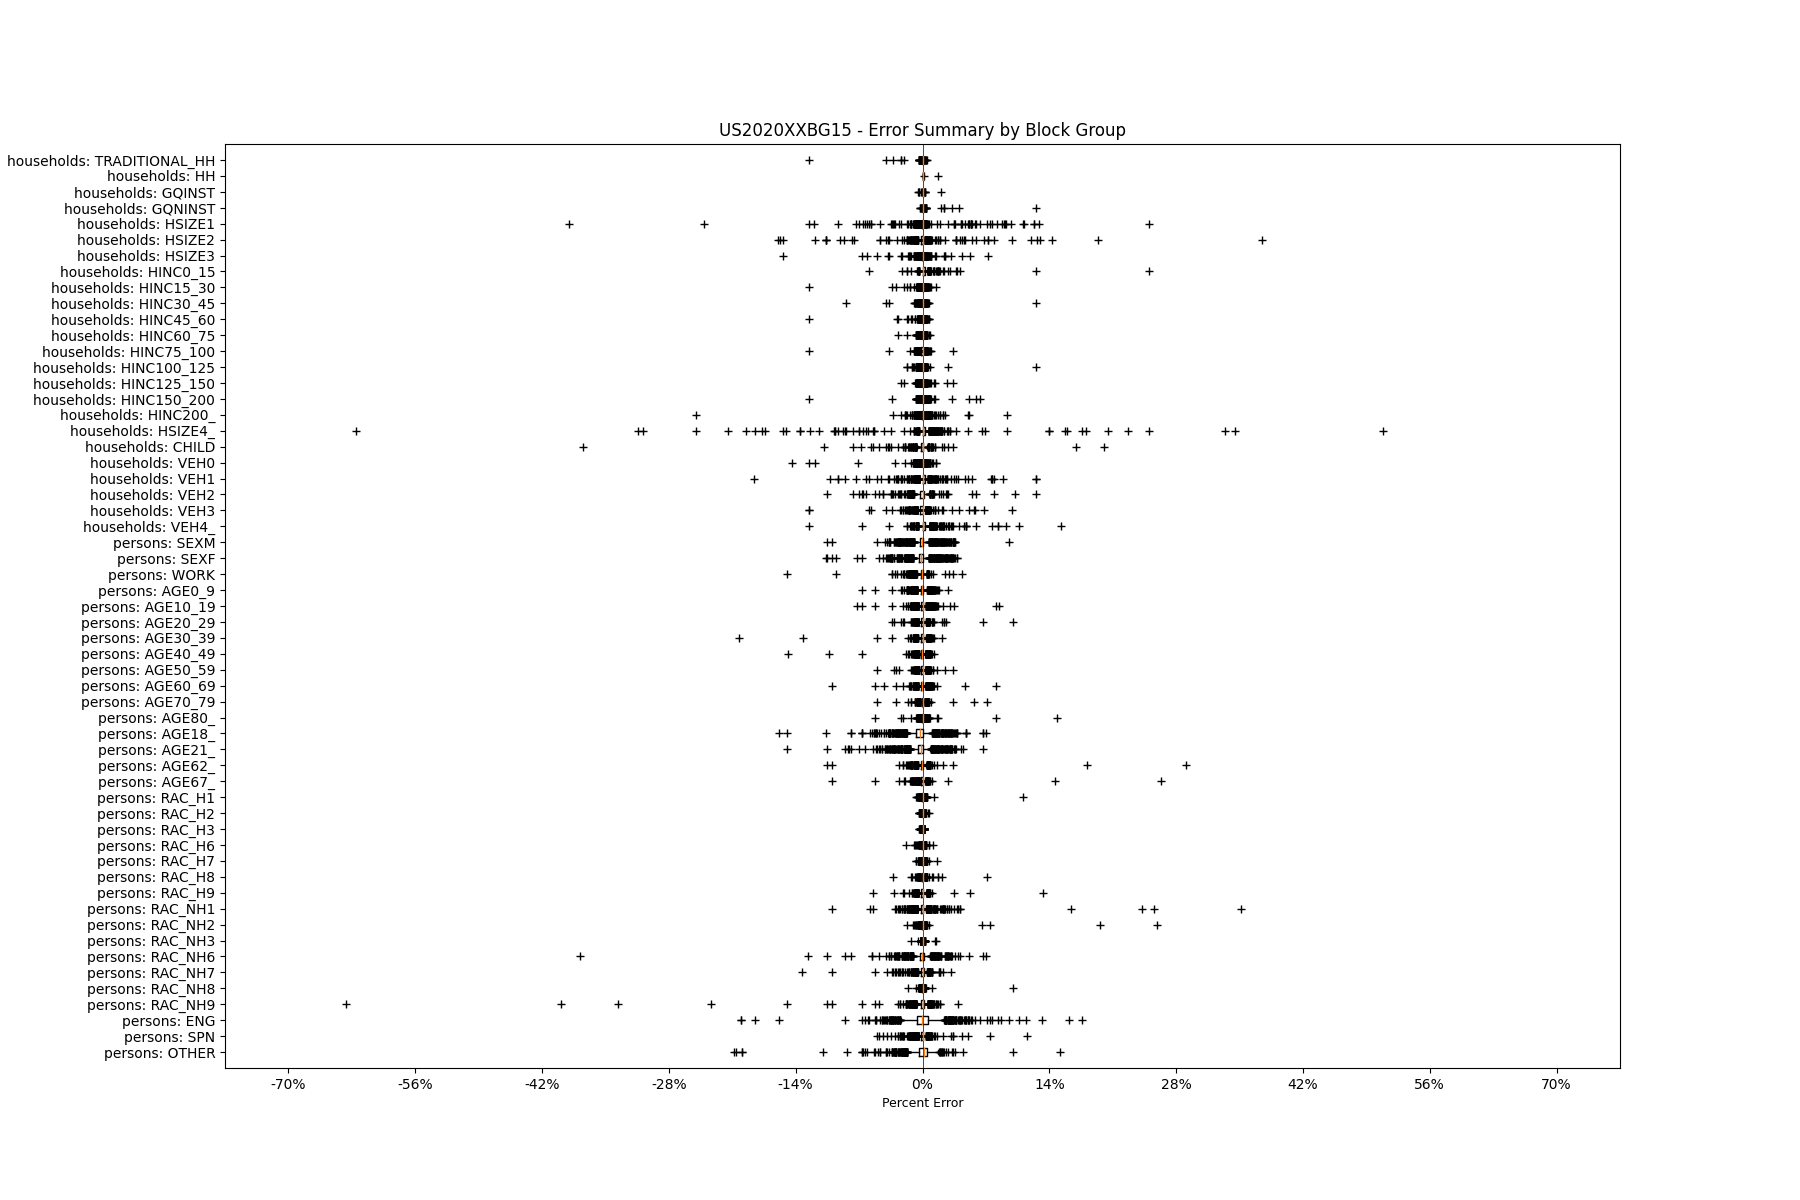
For each variable, block groups are binned together along the vertical axis into similar sized quartiles. For household variables, the block groups are binned into categories with about 50,000 block groups in each: 0-350 households, 350-500 households, 500-700 households, and 700+ households. For person variables, the block groups are binned into categories of about 50,000 block groups each as well: 0-900 persons, 900-1300 persons, 1300-1850 persons, and 1850+ persons.
Along the horizontal axis in the plots, the distribution of the difference over the block groups between the digital total and control total is shown using a boxplot. One on this scale is a difference of one person (or household) between the control total and the digital population total. For example, block group A has a control total of 100 people and the digital population has 99 people. The ends of the horizontal lines out from the box show the 5th and 95th percentiles.
Total Households (Neighborhood)
These block group comparison plots show that the Motionworks Digital Population is less than 1 households away from the control total in 90% of all block groups.
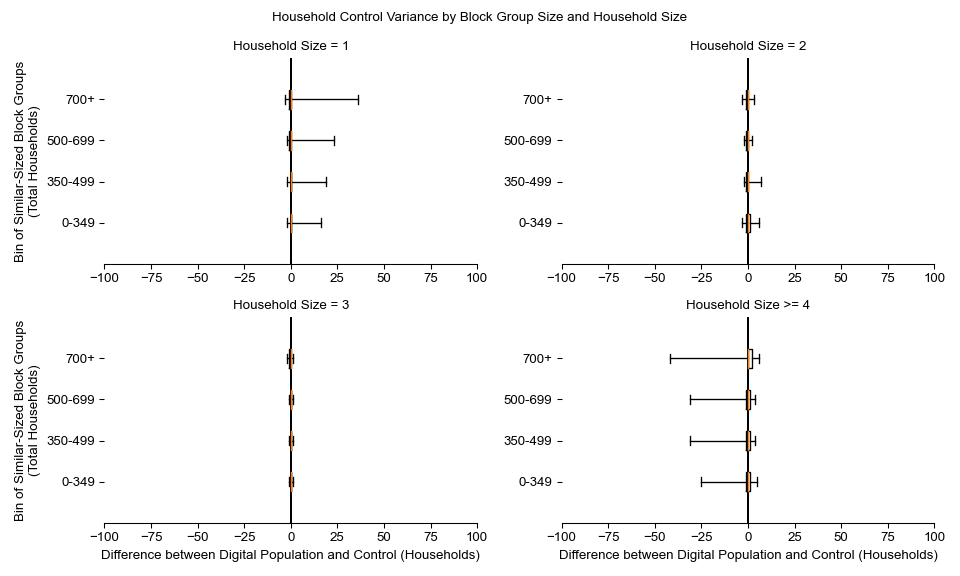
Households by Size (Neighborhood)
The Digital Population tends to skew at the extremes--lowest and highest quartile-- to smaller household sizes.
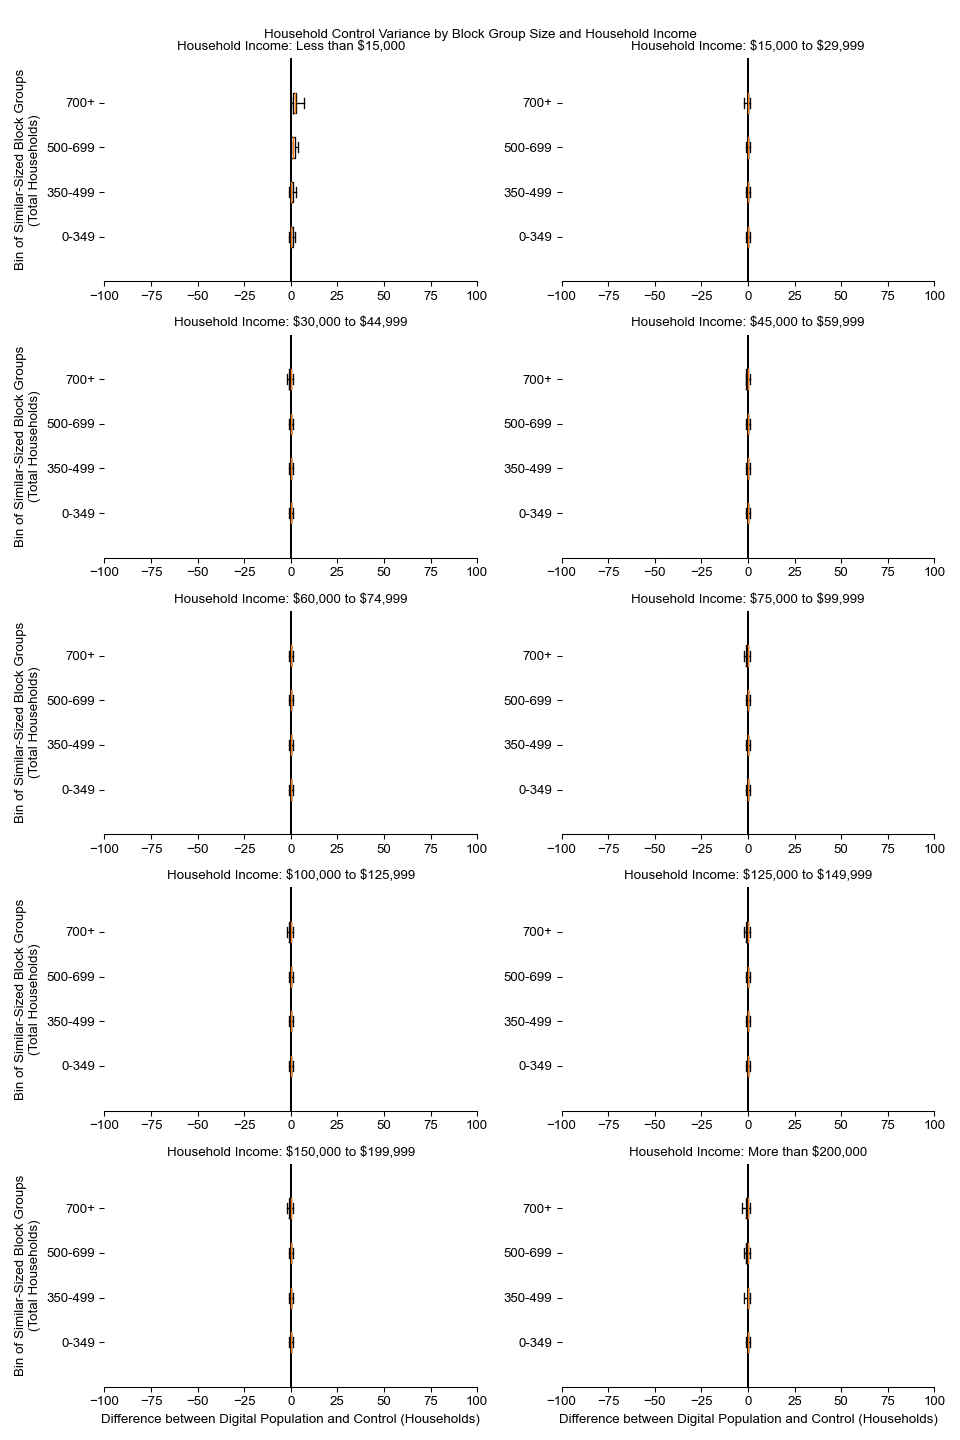
Households by Income (Neighborhood)
The Digital Population construction process heavily prioritizes matching household income distributions. In nearly every income bin and block group size category, households are within 5 households of the control totals in 95% or more of the block groups.
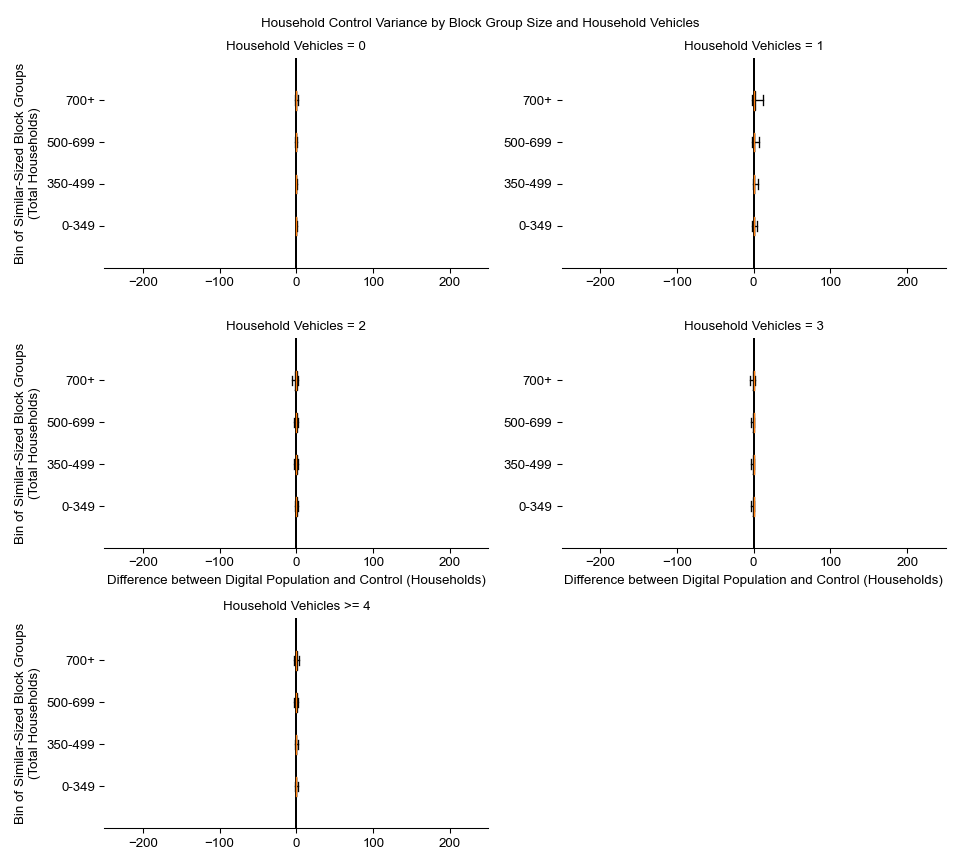
Households by Vehicle Availability (Neighborhood)
The Digital Population construction process prioritizes matching household vehicle availability distributions. Vehicle availability is a key indicator of traveling by transit, walking, biking, or shared used mobility. In nearly every income bin and block group size category, households are within 5 households of the control totals in 95% or more of the block groups.
Total Population (Neighborhood)
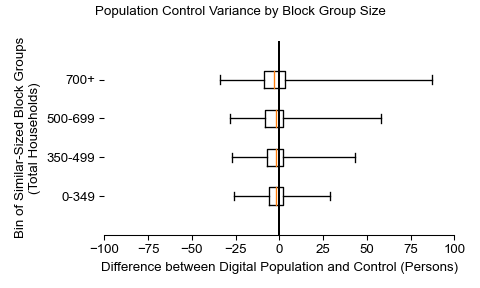
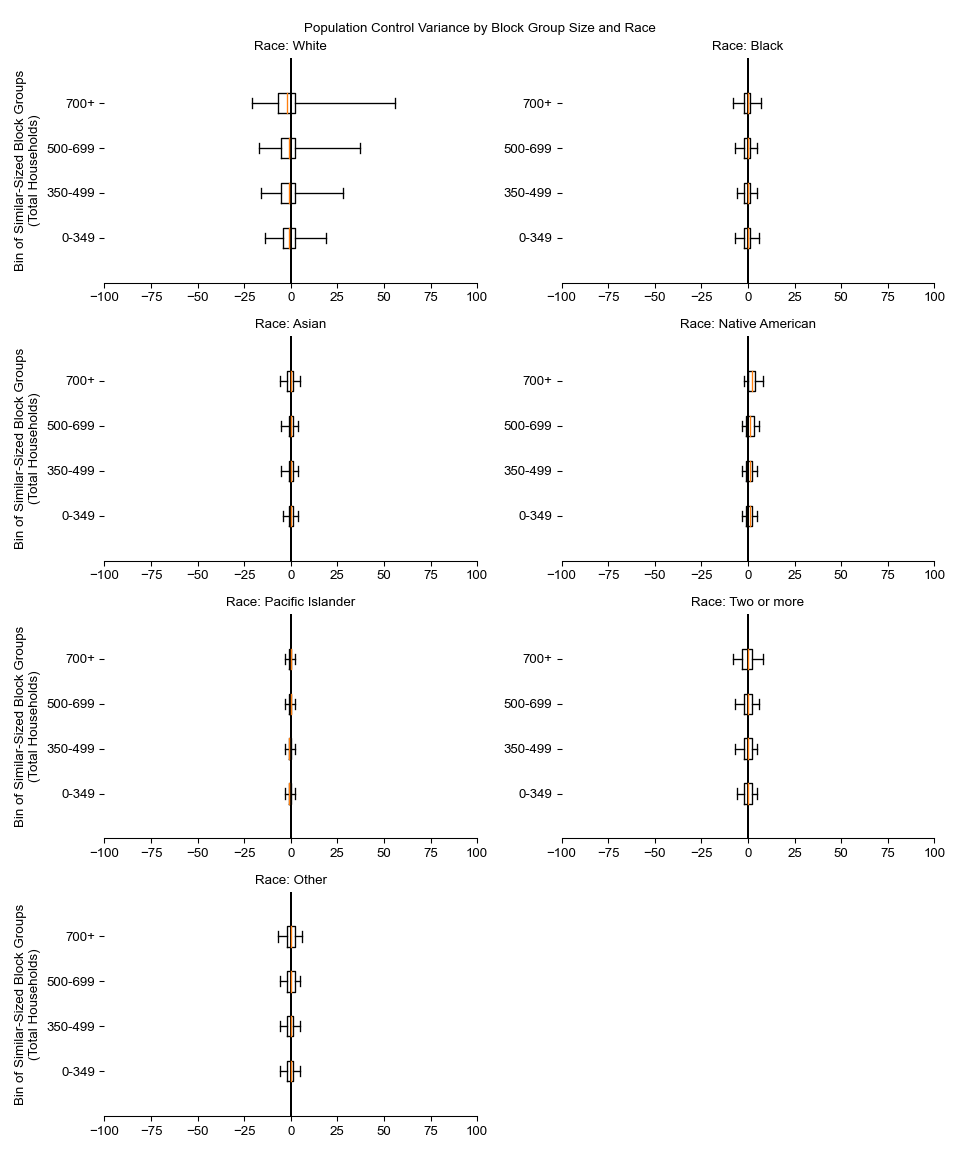
Population by Race (Neighborhood)
For race, the Digital Population matches the controls relatively well. The White population does have larger variance given the scale of the White population in the United States compared to other races. Also, as noted above, the White population is slightly underrepresented as Other or Multiple due to the combination weights around race and Hispanic ethnicity.
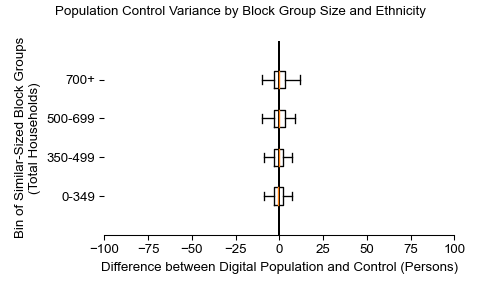
Population by Hispanic Origin (Neighborhood)
In nearly every block group size category, Hispanic persons are within 10 households of the control totals in 95% or more of the block groups.
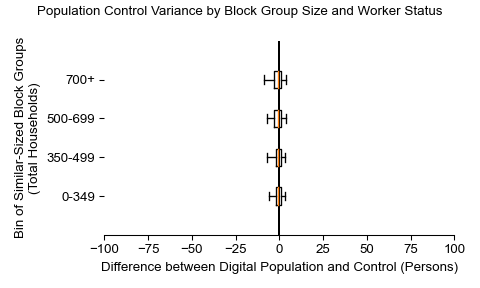
Population by Worker Status (Neighborhood)
In nearly every block group size category, workers are within 10 households of the control totals in 95% or more of the block groups.
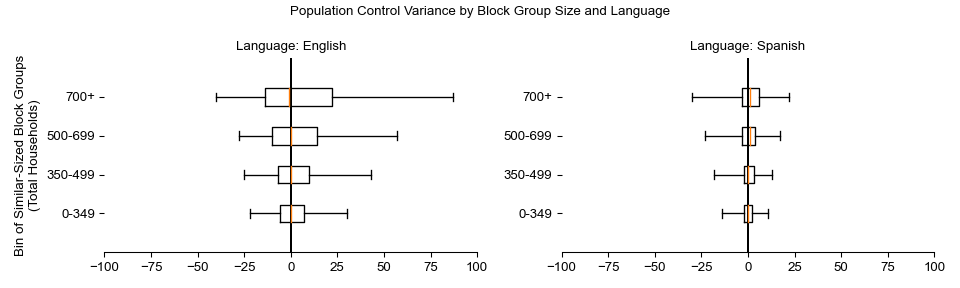
Population by Language Spoken at Home (Neighborhood)
The Digital Population includes a language attribute. This is the lowest priority control in the Digital Population construction. Language matches reasonably well in most block groups, but does have more variability than other variables.
It is also important to point out that variance is greater for English speakers given the absolute scale of the number of English speakers in the United States compared to Spanish speakers.
State Level Summary Validation Summaries
Alabama | Alaska | Arizona | Arkansas | California | Colorado | Connecticut | Delaware | District of Columbia | Florida | Georgia | Hawaii | Idaho | Illinois | Indiana | Iowa | Kansas | Kentucky | Louisiana | Maine | Maryland | Massachusetts | Michigan | Minnesota | Mississippi | Missouri | Montana | Nebraska | Nevada | New Hampshire | New Jersey | New Mexico | New York | North Carolina | North Dakota | Ohio | Oklahoma | Oregon | Pennsylvania | Rhode Island | South Carolina | South Dakota | Tennessee | Texas | Utah | Vermont | Virginia | Washington | West Virginia | Wisconsin | Wyoming
Updated 4 months ago