
Motionworks Pathcast™ Pathcast Traffic Volume Validation
Pathcast delivers exceptional accuracy against observed traffic volumes across 120,287 monthly validation comparisons from 7,466 independent continuous traffic count locations nationwide, with an R-squared value of 0.982 and Mean Absolute Percent Error of 9.1 percent across 24 months of data.
Executive Summary
Pathcast's traffic volume estimation methodology delivers exceptional accuracy across 120,287 monthly validation comparisons from 7,466 independent continuous traffic count locations nationwide. This comprehensive validation study analyzed traffic counters reporting reliable traffic counts monthly for 2023 and 2024 in order to demonstrate Pathcast's capability to provide the precise traffic data essential for accurate audience measurement, media planning, campaign valuation, and infrastructure planning.
Key Validation Results
Exceptional Accuracy: Median difference of -3.0 percent from observed traffic volumes demonstrates minimal systematic bias across all measurement conditions.
Comprehensive Coverage: Mean Absolute Percent Error of 9.1 percent across 120,287 monthly comparisons and 24 months of data, covering all roadway types and traffic volumes nationwide.
Strong Statistical Correlation: R-squared value of 0.982 indicates Pathcast estimates explain 98.2 percent of variance in observed traffic counts, providing reliable foundation for media planning and audience measurement.
Media Measurement Impact
| Core Metric | Performance | Media Measurement Impact |
|---|---|---|
| Median Accuracy | -3.0% difference | Minimal systematic bias in audience measurement |
| Typical Precision | ±10.1% variation (68% of cases) | Predictable accuracy for media planning |
| Statistical Correlation | R² = 0.982 | Captures 98.2% of traffic pattern variance |
| Average Deviation | 9.1% MAPE | Reliable foundation for impression calculations |
| Geographic Coverage | 120,287 monthly comparisons | Comprehensive nationwide measurement capability |
Validation Methodology
The relationship between estimated and observed traffic volumes demonstrates exceptional linear correlation, as shown in the comprehensive scatter plot analysis below. The tight clustering of data points along the perfect agreement line (1:1 ratio) confirms Pathcast's precision across the full range of traffic volumes.
Figure 1. Pathcast Estimated vs. Observed Traffic Volumes
Scatter plot showing 120,287 monthly validation comparisons with R² = 0.982. Points closely follow the perfect agreement line, with ±10 percent and ±20 percent agreement bounds clearly marked.
Figure 1. Pathcast Estimated vs. Observed Traffic Volumes
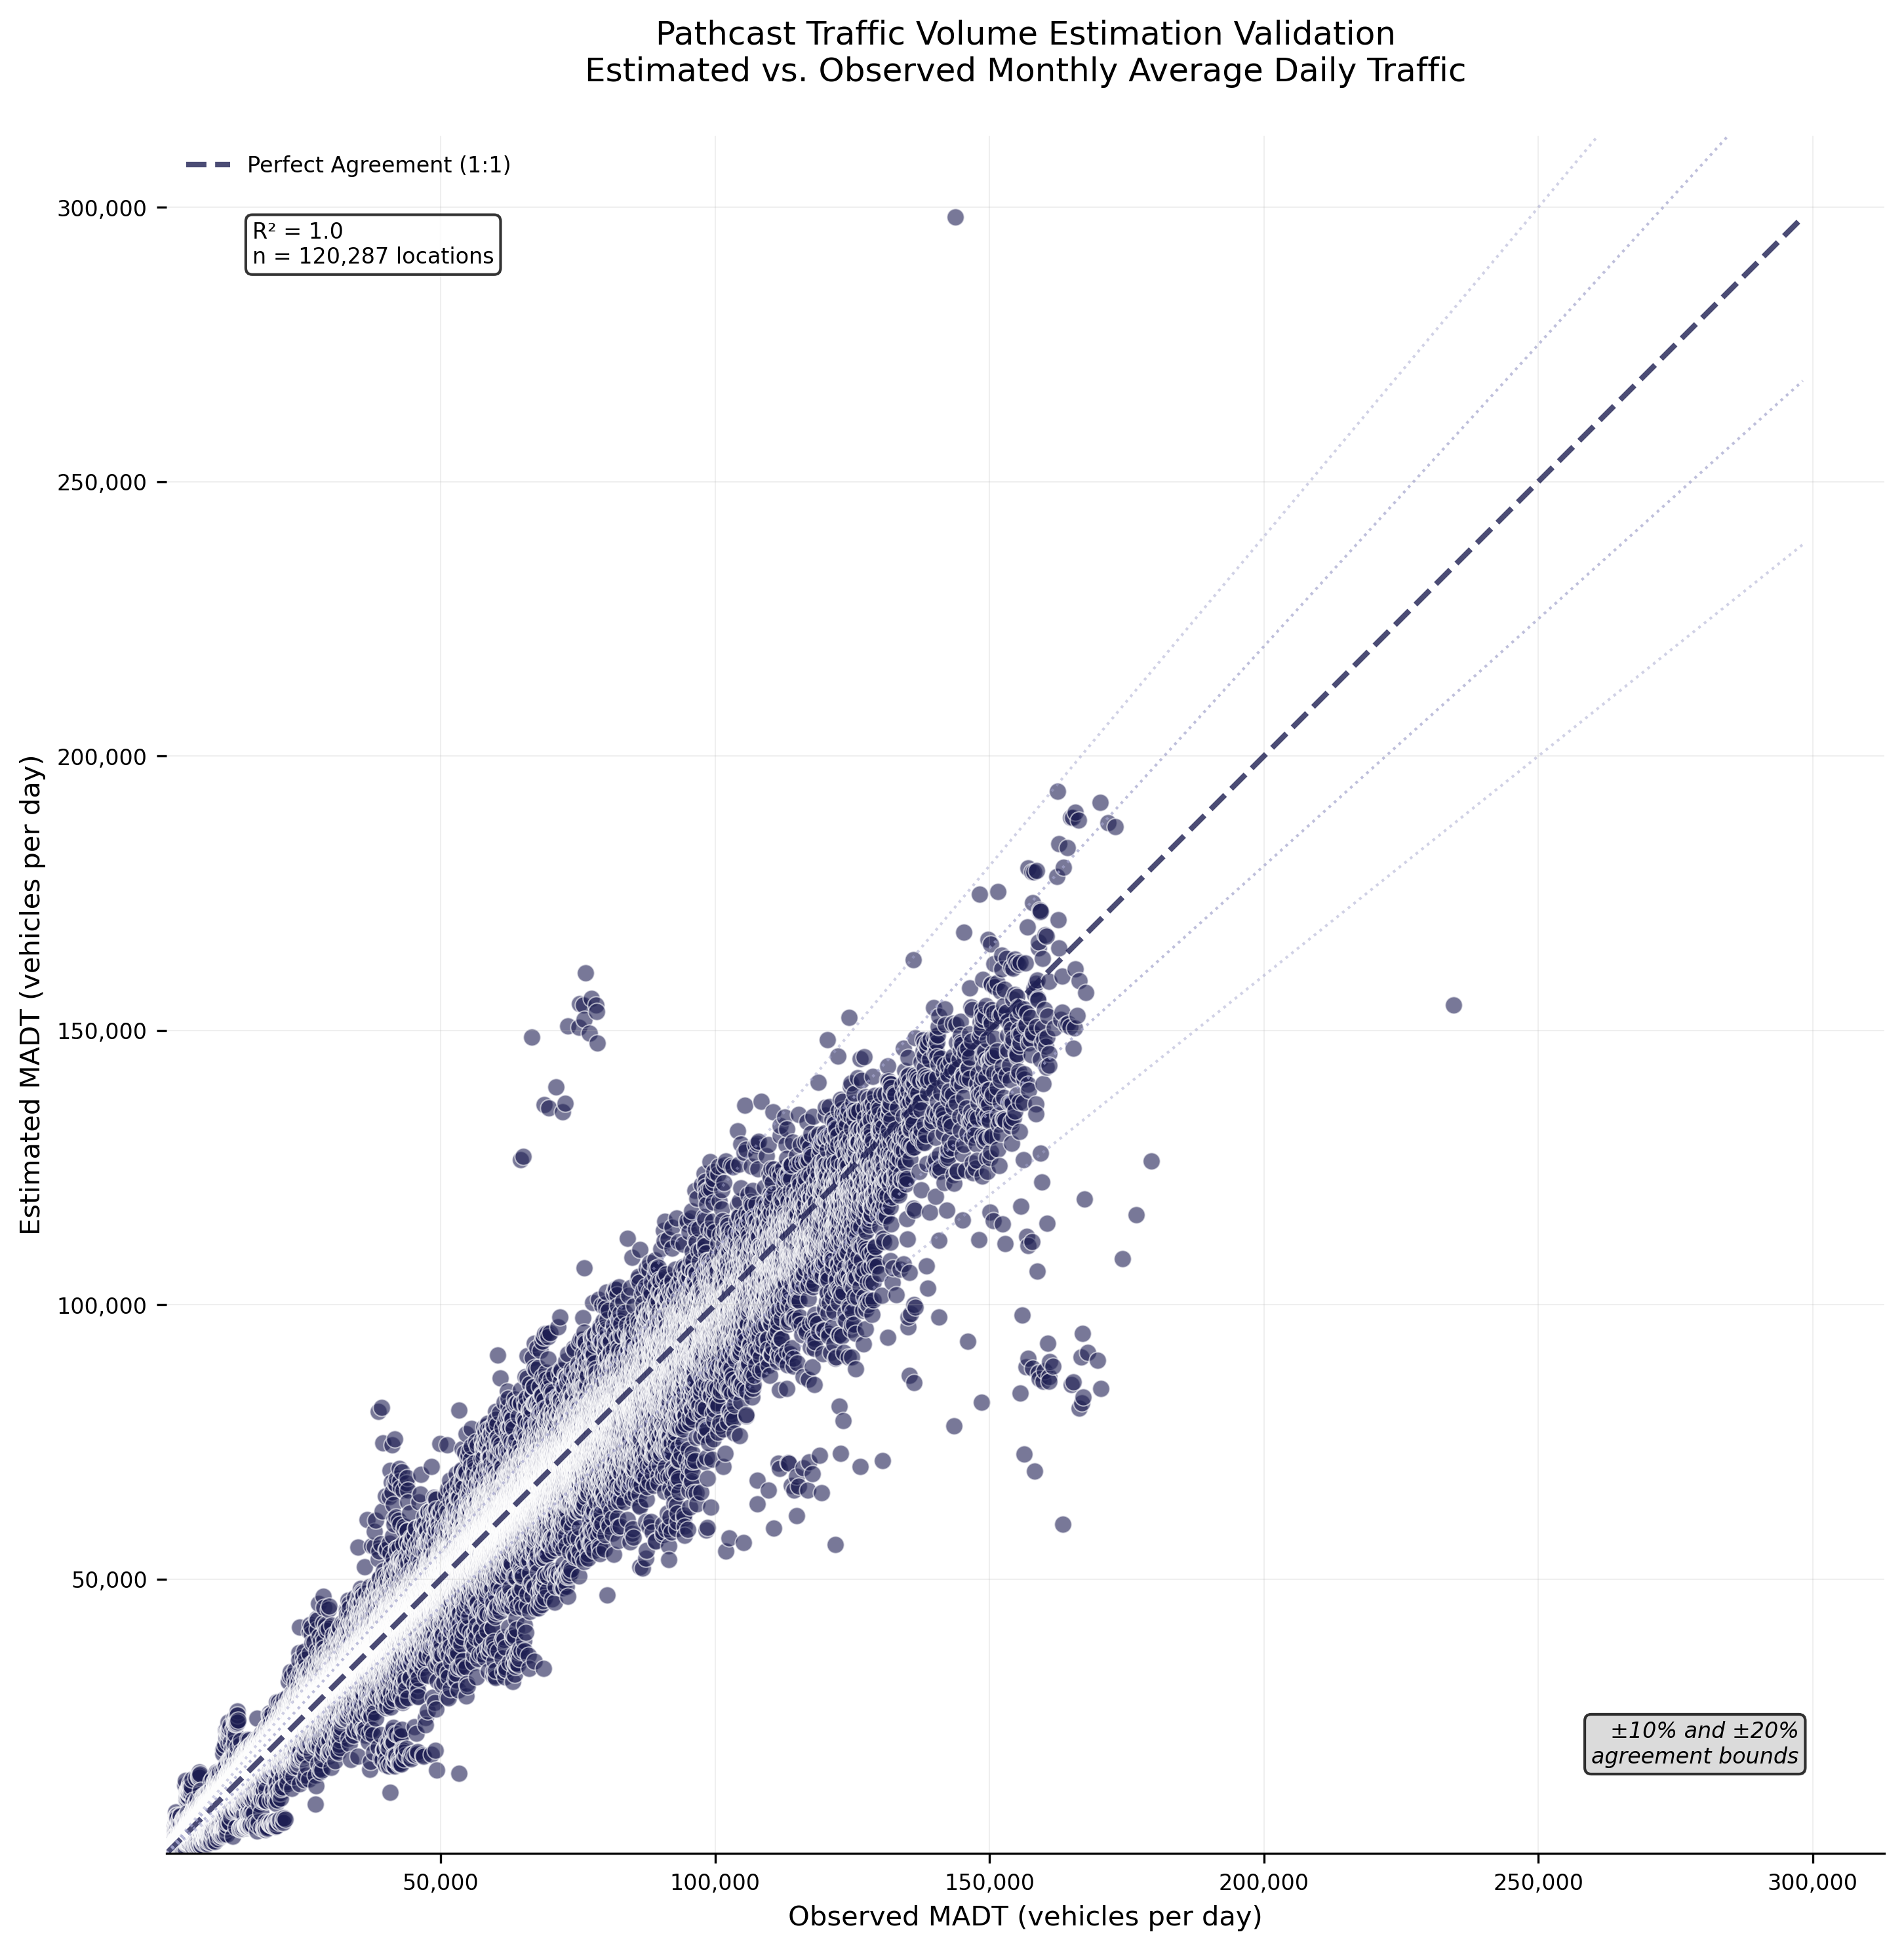
This validation study compares Pathcast estimated Monthly Average Daily Traffic (MADT) against permanent traffic counter measurements across 7,466 locations nationwide that were not used for model estimation. This includes 24 months spanning 2023 and 2024, generating 120,287 monthly comparison points. The analysis employs standard statistical metrics following Federal Highway Administration guidelines to ensure measurement accuracy.
Measurement Framework
- Monthly Average Daily Traffic Focus: All metrics evaluate monthly MADT accuracy for consistent audience measurement
- Median Percent Difference: Assesses systematic measurement bias
- 68th Percentile Metric: Captures typical estimation variance
- 95th Percentile Metric: Identifies extreme variation scenarios
- MAPE, RMSE, R²: Standard accuracy metrics for traffic measurement validation
- SQV (Scalable Quality Value): Scale-independent quality metric alternative to GEH statistic
SQV Statistical Validation Framework
The Scalable Quality Value (SQV) statistic provides an additional validation perspective using the methodology developed by Friedrich et al. (2019) as an alternative to the traditional GEH statistic. SQV addresses limitations of GEH by offering scale-independent assessment suitable for different traffic volume ranges, with scores ranging from 0 (poor match) to 1 (perfect match). The analysis uses a scaling factor of 10,000 appropriate for daily traffic volume validation.
SQV Quality Categories:
- Very Good: ≥0.90 SQV score
- Good: 0.85-0.89 SQV score
- Acceptable: 0.80-0.84 SQV score
- Below Standard: <0.80 SQV score
Overall SQV Performance: Pathcast achieves a mean SQV score of 0.917 across 120,287 monthly comparisons, with 93.0 percent of estimates achieving acceptable or better quality (≥0.80 SQV) and 70.0 percent achieving very good quality (≥0.90 SQV). The median SQV score of 0.938 demonstrates consistently high validation performance, with 85.5 percent of comparisons achieving good or better quality ratings.
Volume-Dependent SQV Performance: SQV analysis demonstrates the relationship between traffic volume and validation quality, providing insights into performance characteristics across different traffic volume ranges to support measurement reliability assessment.
Geographic Market Coverage and Urbanicity Performance
Pathcast validation demonstrates consistent performance across diverse geographic contexts, with comprehensive coverage spanning urban cores, suburban communities, secondary cities, and town environments. Motionworks uses Claritas Urbanicity definitions by Block Group. This analysis provides insights into model performance characteristics across different market types relevant to out-of-home advertising placement strategies.
Table 1A. Pathcast Performance by Urbanicity Classification
| Urbanicity Type | Comparisons | Unique Sites | MAPE | R² | Systematic Bias | Within ±15% |
|---|---|---|---|---|---|---|
| Suburban | 21,517 | 1,283 | 8.4% | 0.968 | -2.3% | 86.7% |
| Second City | 11,876 | 757 | 8.7% | 0.975 | -2.4% | 84.4% |
| Urban | 8,470 | 492 | 9.6% | 0.960 | -1.3% | 82.1% |
| Town | 78,424 | 4,934 | 9.3% | 0.989 | -4.4% | 80.1% |
Geographic Performance Insights:
- Suburban Excellence: Suburban environments show optimal Pathcast performance (8.4% MAPE, 86.7% within ±15%), reflecting ideal conditions with moderate traffic volumes and predictable patterns
- Urban Complexity Management: Urban areas maintain strong performance (9.6% MAPE) despite high traffic complexity, with minimal systematic bias (-1.3%) demonstrating effective modeling of metropolitan traffic dynamics
- Town Coverage Strength: Town environments provide the largest validation dataset (78,424 comparisons) with excellent correlation (R² = 0.989), though showing higher systematic underestimation (-4.4%)
- Secondary Market Reliability: Second City areas demonstrate consistent accuracy (8.7% MAPE) with strong agreement rates (84.4% within ±15%)
Market Context Analysis:
- Urban Markets: Average 62,084 MADT with 77.1 percent high-volume locations (>20,000 vehicles/day), representing major metropolitan advertising opportunities
- Suburban Markets: Average 43,746 MADT with 68.3 percent high-volume locations, providing optimal accuracy for suburban campaign planning
- Town Markets: Average 13,442 MADT with 42.2 percent low-volume locations (<5,000 vehicles/day), offering extensive geographic coverage for local market reach
Campaign Planning Applications: The urbanicity performance patterns support strategic out-of-home campaign planning, with suburban markets offering peak measurement reliability, urban markets providing robust high-volume inventory accuracy, and town markets enabling comprehensive geographic coverage with predictable systematic bias adjustment.
Nationwide Validation: Analysis across 120,287 monthly comparisons from 7,466 unique sites provides comprehensive coverage of major markets and roadway types relevant to out-of-home advertising placement, ensuring measurement accuracy across diverse demographic and geographic contexts.
Figure 2. Geographic Distribution of Pathcast Validation Locations
Nationwide coverage map showing 7,466 validation locations across all major metropolitan areas and roadway types, ensuring representative sampling for comprehensive accuracy assessment.
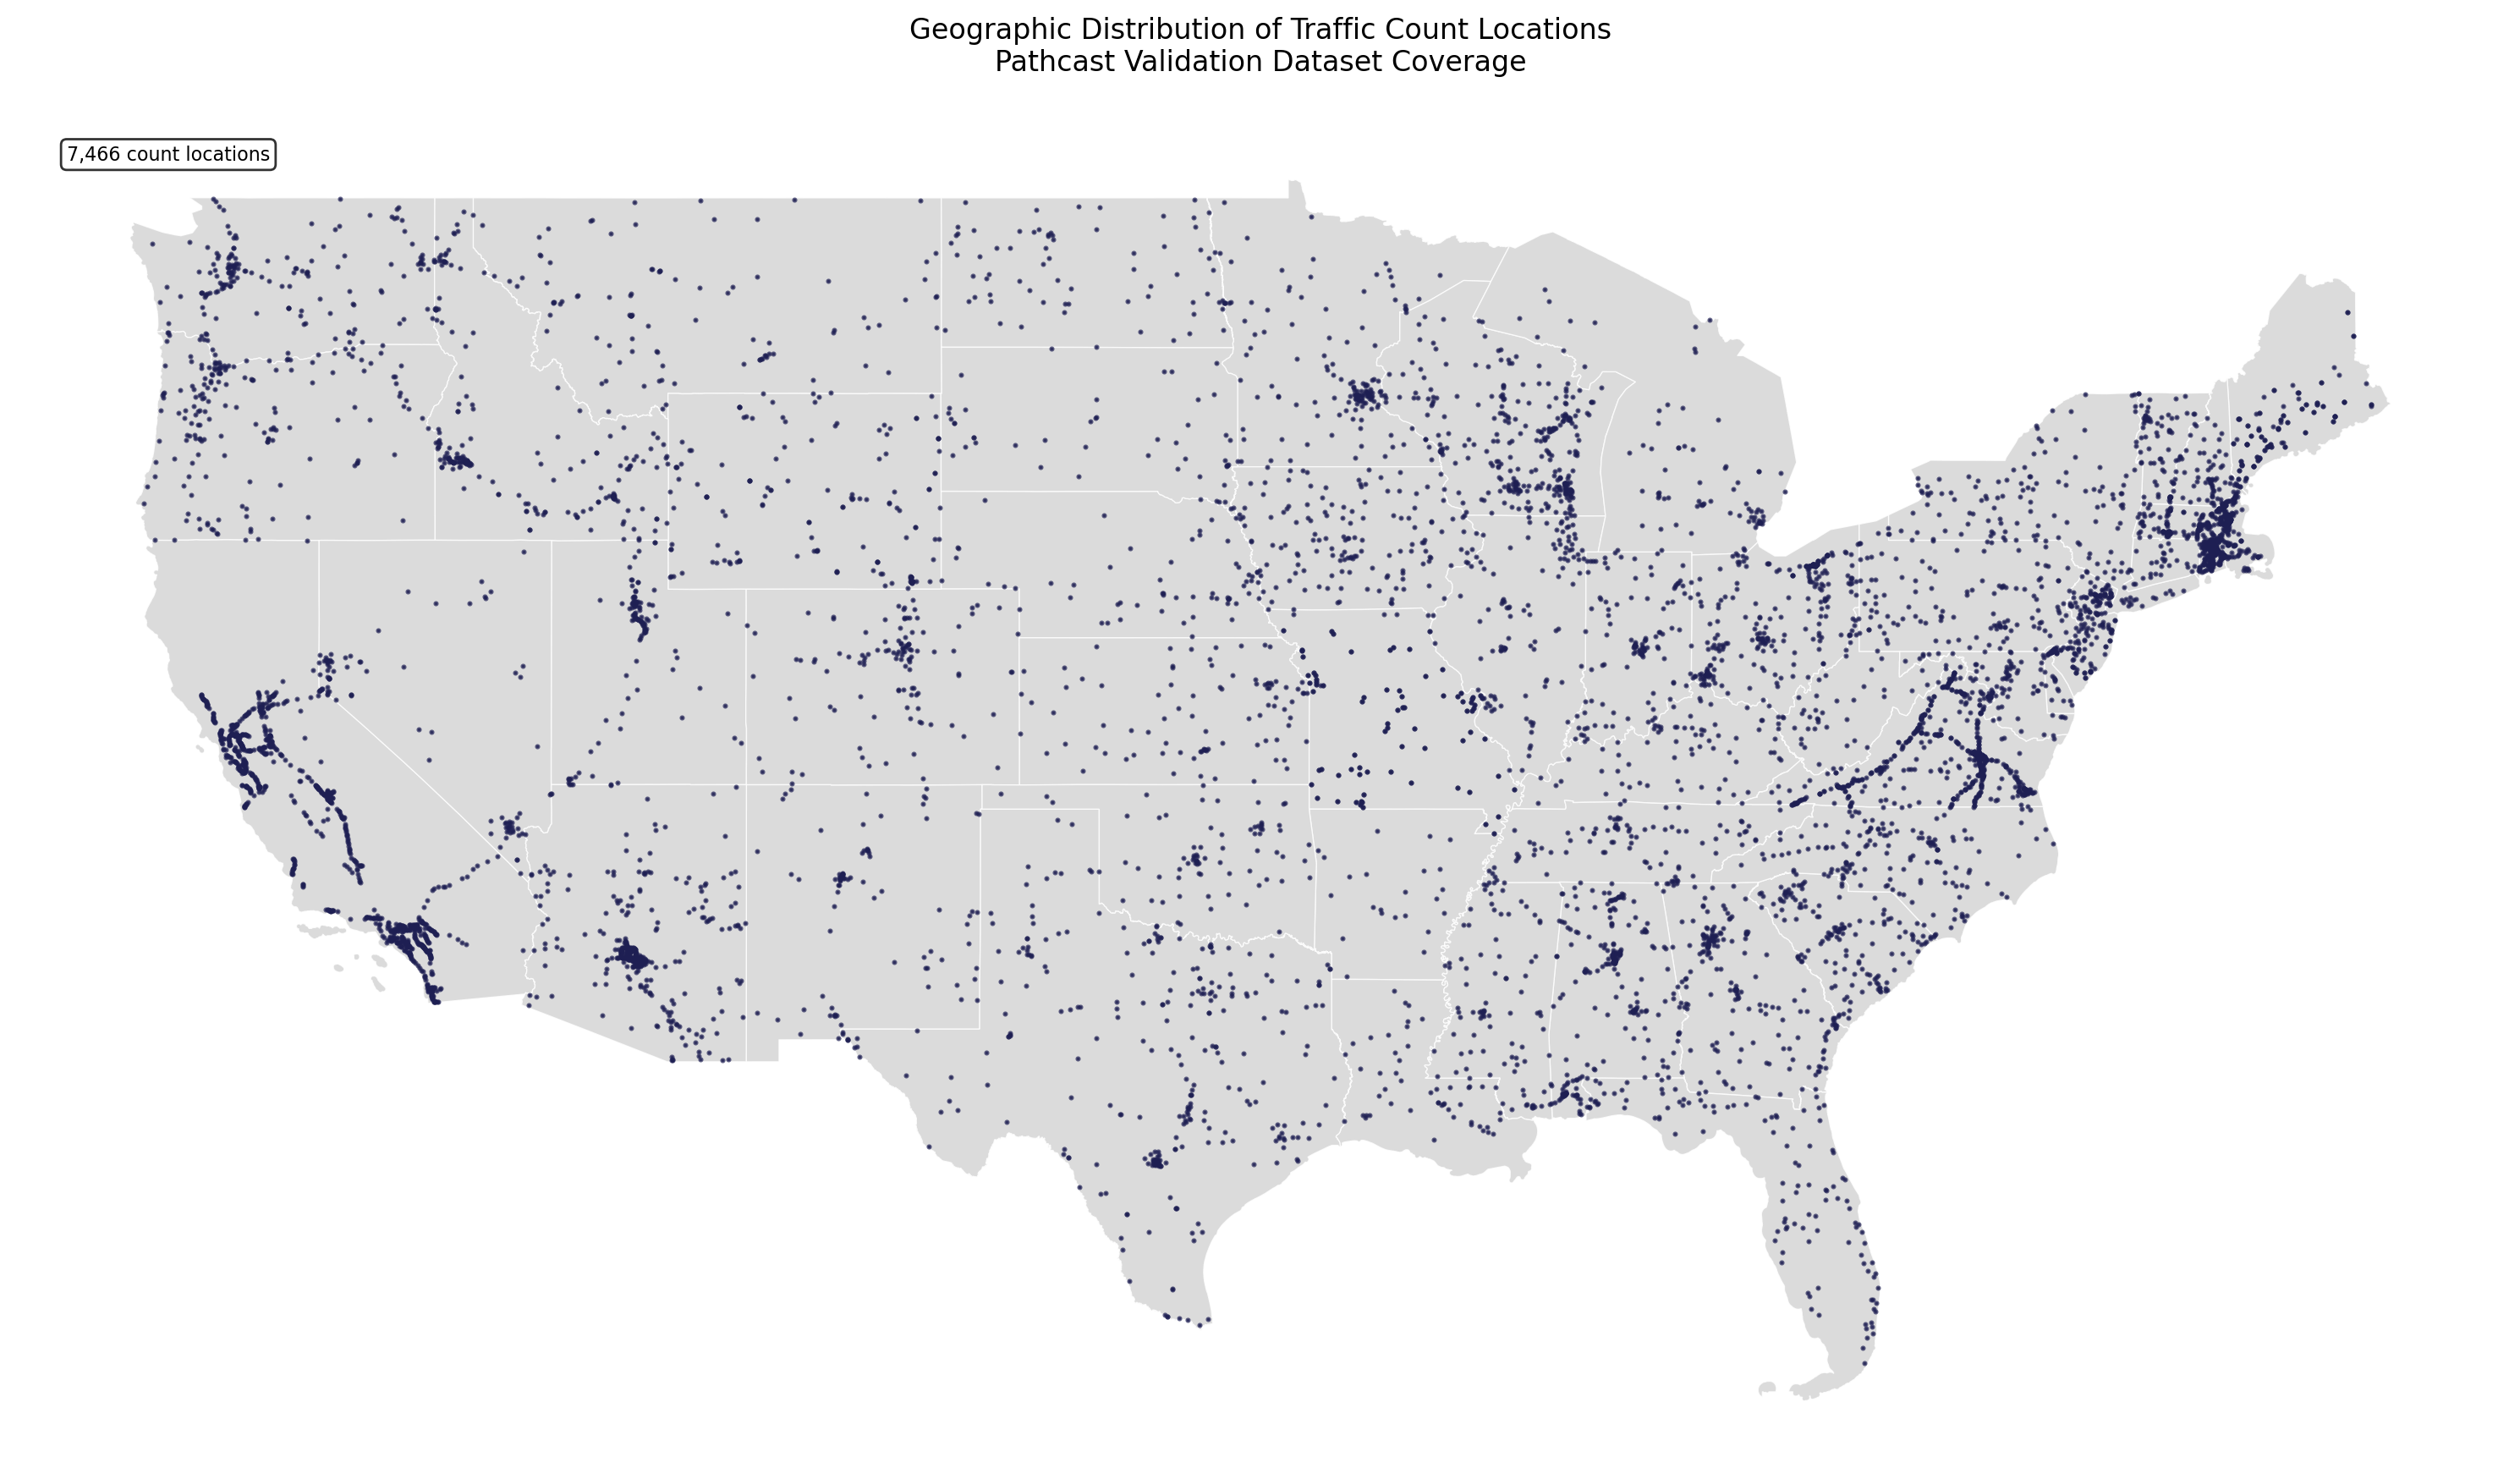
Table 2. Distribution of Pathcast Validation Comparisons by Traffic Volume
| MADT Range | Monthly Comparisons | Percent |
|---|---|---|
| 0 - 499 | 3,515 | 2.9% |
| 500 - 1,999 | 14,233 | 11.8% |
| 2,000 - 4,999 | 18,033 | 15.0% |
| 5,000 - 9,999 | 18,245 | 15.2% |
| 10,000 - 19,999 | 19,665 | 16.3% |
| 20,000 - 34,999 | 16,223 | 13.5% |
| 35,000 - 54,999 | 11,863 | 9.9% |
| 55,000 - 84,999 | 12,368 | 10.3% |
| 85,000 - 124,999 | 5,210 | 4.3% |
| 125,000+ | 932 | 0.8% |
| Total | 120,287 | 100.0% |
Traffic Volume Performance Analysis
The following comprehensive analysis summarizes validation metrics by traffic volume ranges, providing customers with insights into expected performance characteristics for different roadway types. Median Percent Diff values indicate systematic bias direction: negative values show slight underestimation, positive values show slight overestimation, and values near zero demonstrate minimal systematic bias.
Year-over-Year Performance Analysis (2023 vs 2024)
Pathcast validation demonstrates consistent performance improvements from 2023 to 2024, with enhanced accuracy across most key metrics despite a reduction in available validation data points. The analysis reveals systematic improvements in estimation precision while maintaining exceptional statistical correlation.
Table 2A. Year-over-Year Validation Performance Comparison
| Metric | 2023 | 2024 | Change |
|---|---|---|---|
| Total Monthly Comparisons | 79,595 | 40,692 | -38,903 (-48.9%) |
| R-squared | 0.983 | 0.980 | -0.003 (-0.3%) |
| MAPE | 9.5% | 8.3% | -1.2 pp |
| RMSE | 3,573 | 4,431 | +858 (+24.0%) |
| Median % Difference | -3.4% | -2.4% | +1.0 pp |
| 68th Percentile Variation | ±10.7% | ±8.9% | -1.8 pp |
| 95th Percentile Variation | ±26.6% | ±23.8% | -2.8 pp |
| Locations within ±15% | 80.2% | 85.2% | +5.0 pp |
Key Performance Insights:
- Enhanced Accuracy: 2024 shows 1.2 percentage point improvement in MAPE (9.5% → 8.3%), indicating better average estimation performance
- Reduced Systematic Bias: Median percent difference improved from -3.4 percent to -2.4 percent, demonstrating more balanced estimation with less systematic underestimation
- Improved Precision: Both 68th and 95th percentile variations decreased, showing more consistent estimation performance across all traffic volume ranges
- Higher Reliability: 5.0 percentage point increase in locations within ±15 percent agreement (80.2% → 85.2%) demonstrates enhanced overall measurement reliability
Data Coverage Context: While the total number of monthly comparisons decreased from 79,595 to 40,692, the quality of estimation performance improved across nearly all accuracy metrics, suggesting enhanced model refinement and calibration.
Monthly Seasonality Analysis
Pathcast validation demonstrates clear seasonal patterns in estimation accuracy, with fall months consistently showing superior performance compared to winter and spring periods. This analysis provides insights into temporal factors that influence traffic estimation quality and supports seasonal campaign planning considerations.
Table 2B. Monthly Seasonality in Pathcast Validation Performance
| Month | Comparisons | MAPE | R² | Median Bias | P68 Variation | Within ±15% |
|---|---|---|---|---|---|---|
| January | 9,789 | 9.2% | 0.983 | -3.0% | ±10.4% | 81.3% |
| February | 9,741 | 9.4% | 0.984 | -3.7% | ±10.7% | 80.7% |
| March | 9,854 | 9.3% | 0.984 | -3.0% | ±10.5% | 80.6% |
| April | 9,584 | 9.3% | 0.983 | -3.5% | ±10.4% | 80.9% |
| May | 10,083 | 9.4% | 0.983 | -3.1% | ±10.5% | 80.9% |
| June | 9,814 | 9.3% | 0.982 | -3.4% | ±10.5% | 80.7% |
| July | 9,829 | 9.2% | 0.984 | -2.7% | ±10.2% | 81.2% |
| August | 12,761 | 8.9% | 0.978 | -3.2% | ±9.7% | 83.3% |
| September | 9,896 | 8.7% | 0.982 | -2.5% | ±9.6% | 83.3% |
| October | 9,672 | 8.7% | 0.982 | -2.9% | ±9.6% | 83.3% |
| November | 9,635 | 8.6% | 0.982 | -2.4% | ±9.5% | 83.7% |
| December | 9,629 | 9.0% | 0.980 | -2.4% | ±10.0% | 82.2% |
Key Seasonal Insights:
- Peak Performance Period: August through November shows consistently superior accuracy, with November achieving best overall performance (8.6% MAPE, 83.7% within ±15%)
- Challenging Months: February and May represent peak difficulty periods (9.4% MAPE), likely reflecting seasonal traffic pattern complexity
- Systematic Bias Reduction: Fall months show reduced systematic underestimation, with November showing minimal bias (-2.4% median)
- Precision Enhancement: Fall period demonstrates tighter estimation bounds (±9.5-9.7% P68 variation vs ±10.4-10.7% in winter/spring)
Campaign Planning Implications: The seasonal accuracy patterns provide valuable context for out-of-home campaign planning, with fall months offering peak measurement reliability for audience delivery verification and winter/spring periods requiring enhanced attention to estimation variance in media planning calculations.
Natural Traffic Variability Context
Understanding Pathcast performance requires context of natural traffic variability patterns. Analysis of month-to-month variation in actual traffic counts reveals systematic differences across volume categories, providing important baseline expectations for estimation accuracy assessment.
Table 2C. Natural Traffic Variability by Volume Category
| ADT Range | Sites Analyzed | Natural Variability (CV%) | Median Variation | High Variability Sites (>20%) |
|---|---|---|---|---|
| 0-499 | 289 | 15.9% | 12.6% | 28.4% |
| 500-1,999 | 1,077 | 11.9% | 9.5% | 15.3% |
| 2,000-4,999 | 1,411 | 8.7% | 7.2% | 5.9% |
| 5,000-9,999 | 1,428 | 7.2% | 6.2% | 1.6% |
| 10,000-19,999 | 1,513 | 6.5% | 5.7% | 0.4% |
| 20,000-34,999 | 1,249 | 5.7% | 5.4% | 0.0% |
| 35,000-54,999 | 883 | 4.8% | 4.4% | 0.0% |
| 55,000-84,999 | 812 | 4.3% | 4.0% | 0.1% |
| 85,000-124,999 | 360 | 3.8% | 3.4% | 0.0% |
| 125,000+ | 70 | 3.2% | 2.8% | 0.0% |
Key Traffic Pattern Insights:
- Volume-Stability Relationship: Natural traffic variability decreases systematically as volume increases, from 16.3 percent coefficient of variation for lowest-volume roads to 3.2 percent for highest-volume roads
- High-Volume Stability: Roads with 20,000+ vehicles per day show exceptional natural stability (<6% variation), creating optimal conditions for accurate estimation
- Low-Volume Challenge: Nearly one-third of lowest-volume locations exhibit >20 percent natural month-to-month variability, representing inherently challenging measurement environments
Pathcast Performance Context: The relationship between natural traffic variability and Pathcast estimation accuracy demonstrates that model performance aligns with traffic predictability patterns. Higher relative estimation errors on low-volume roads reflect the inherently more variable nature of traffic on these facilities, while exceptional accuracy on high-volume roads leverages their highly predictable traffic patterns.
Performance by Traffic Volume Category
Pathcast performs optimally across all roadway classes. On moderate to high-volume roadways where the most impressions are delivered, MAPE provides very close alignment as a percentage of the traffic volume. On lower-volume roads, while relative variation is higher in alignment with natural traffic variation, the absolute deviation in vehicle counts remains minimal.
Figure 3 shows that Pathcast's accuracy as measured by the MAPE drops from 13.2 percent on very low-volume roads to around 6-7 percent on facilities with more than 20,000 vehicles per day. While the RMSE shows variation of only a few hundred vehicles on the low volume roadways with fewer than 5,000 vehicles per day.
Figure 3. Pathcast Accuracy Metrics Trends by Traffic Volume
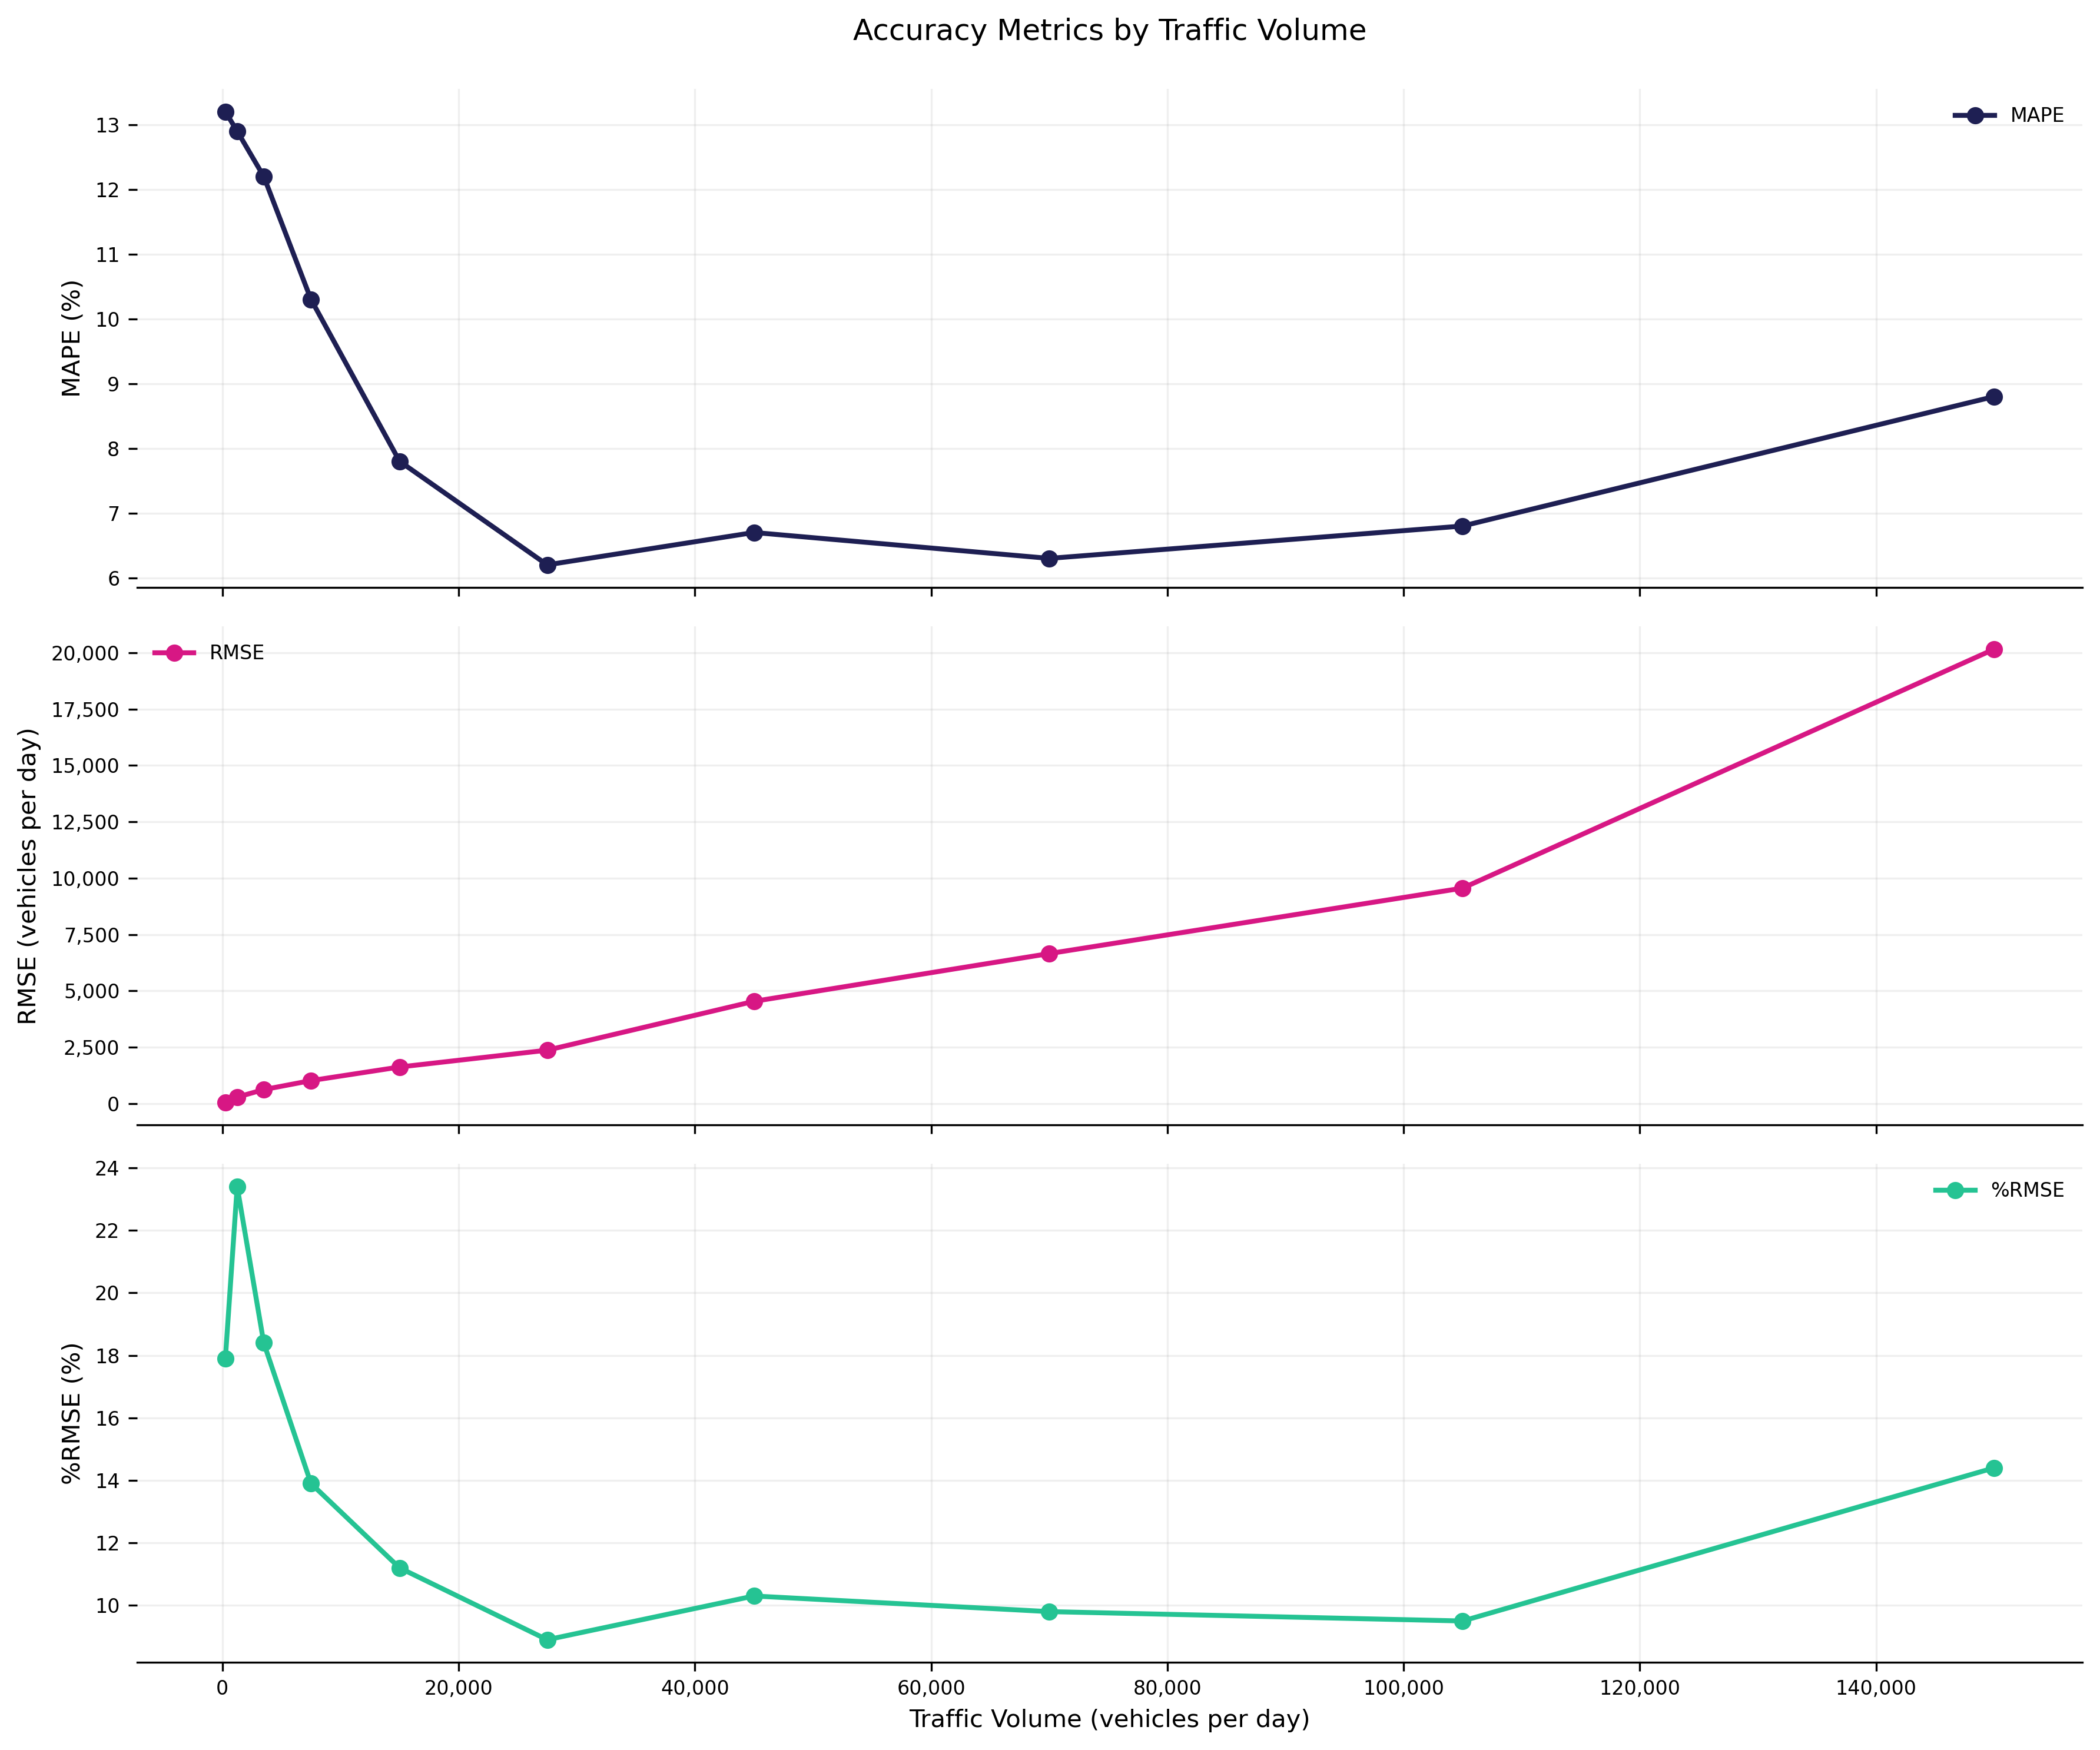
Table 3. Pathcast Accuracy Metrics Trends by Traffic Volume
| MADT Range | MAPE | RMSE | %RMSE | Median % Diff | 68th %ile | 95th %ile |
|---|---|---|---|---|---|---|
| 0-499 | 13.2% | 54 | 17.9% | -4.5% | ±15.9% | ±35.1% |
| 500-1,999 | 12.9% | 285 | 23.4% | -7.5% | ±15.3% | ±32.5% |
| 2,000-4,999 | 12.2% | 617 | 18.4% | -7.3% | ±14.7% | ±29.7% |
| 5,000-9,999 | 10.3% | 1,017 | 13.9% | -3.6% | ±12.3% | ±26.7% |
| 10,000-19,999 | 7.8% | 1,620 | 11.2% | -1.9% | ±8.8% | ±20.1% |
| 20,000-34,999 | 6.2% | 2,366 | 8.9% | -0.7% | ±7.1% | ±17.2% |
| 35,000-54,999 | 6.7% | 4,533 | 10.3% | -1.7% | ±7.1% | ±20.6% |
| 55,000-84,999 | 6.3% | 6,652 | 9.8% | -1.9% | ±6.7% | ±19.0% |
| 85,000-124,999 | 6.8% | 9,556 | 9.5% | -2.8% | ±7.4% | ±19.7% |
| 125,000+ | 8.8% | 20,157 | 14.4% | -4.5% | ±8.9% | ±28.5% |
Figure 5. Error Distribution Analysis by Traffic Volume Category
The box plot analysis provides detailed insight into the distribution of estimation errors within each traffic volume category. Each box represents the middle 50 percent of estimation errors (interquartile range), with the median line showing the center error for that volume range. The whiskers extend to capture the majority of data points, while individual dots represent outliers. This visualization clearly demonstrates how estimation precision becomes more consistent and tightly clustered around zero as traffic volume increases, with higher-volume roadways showing notably smaller boxes and fewer outliers than lower-volume facilities.
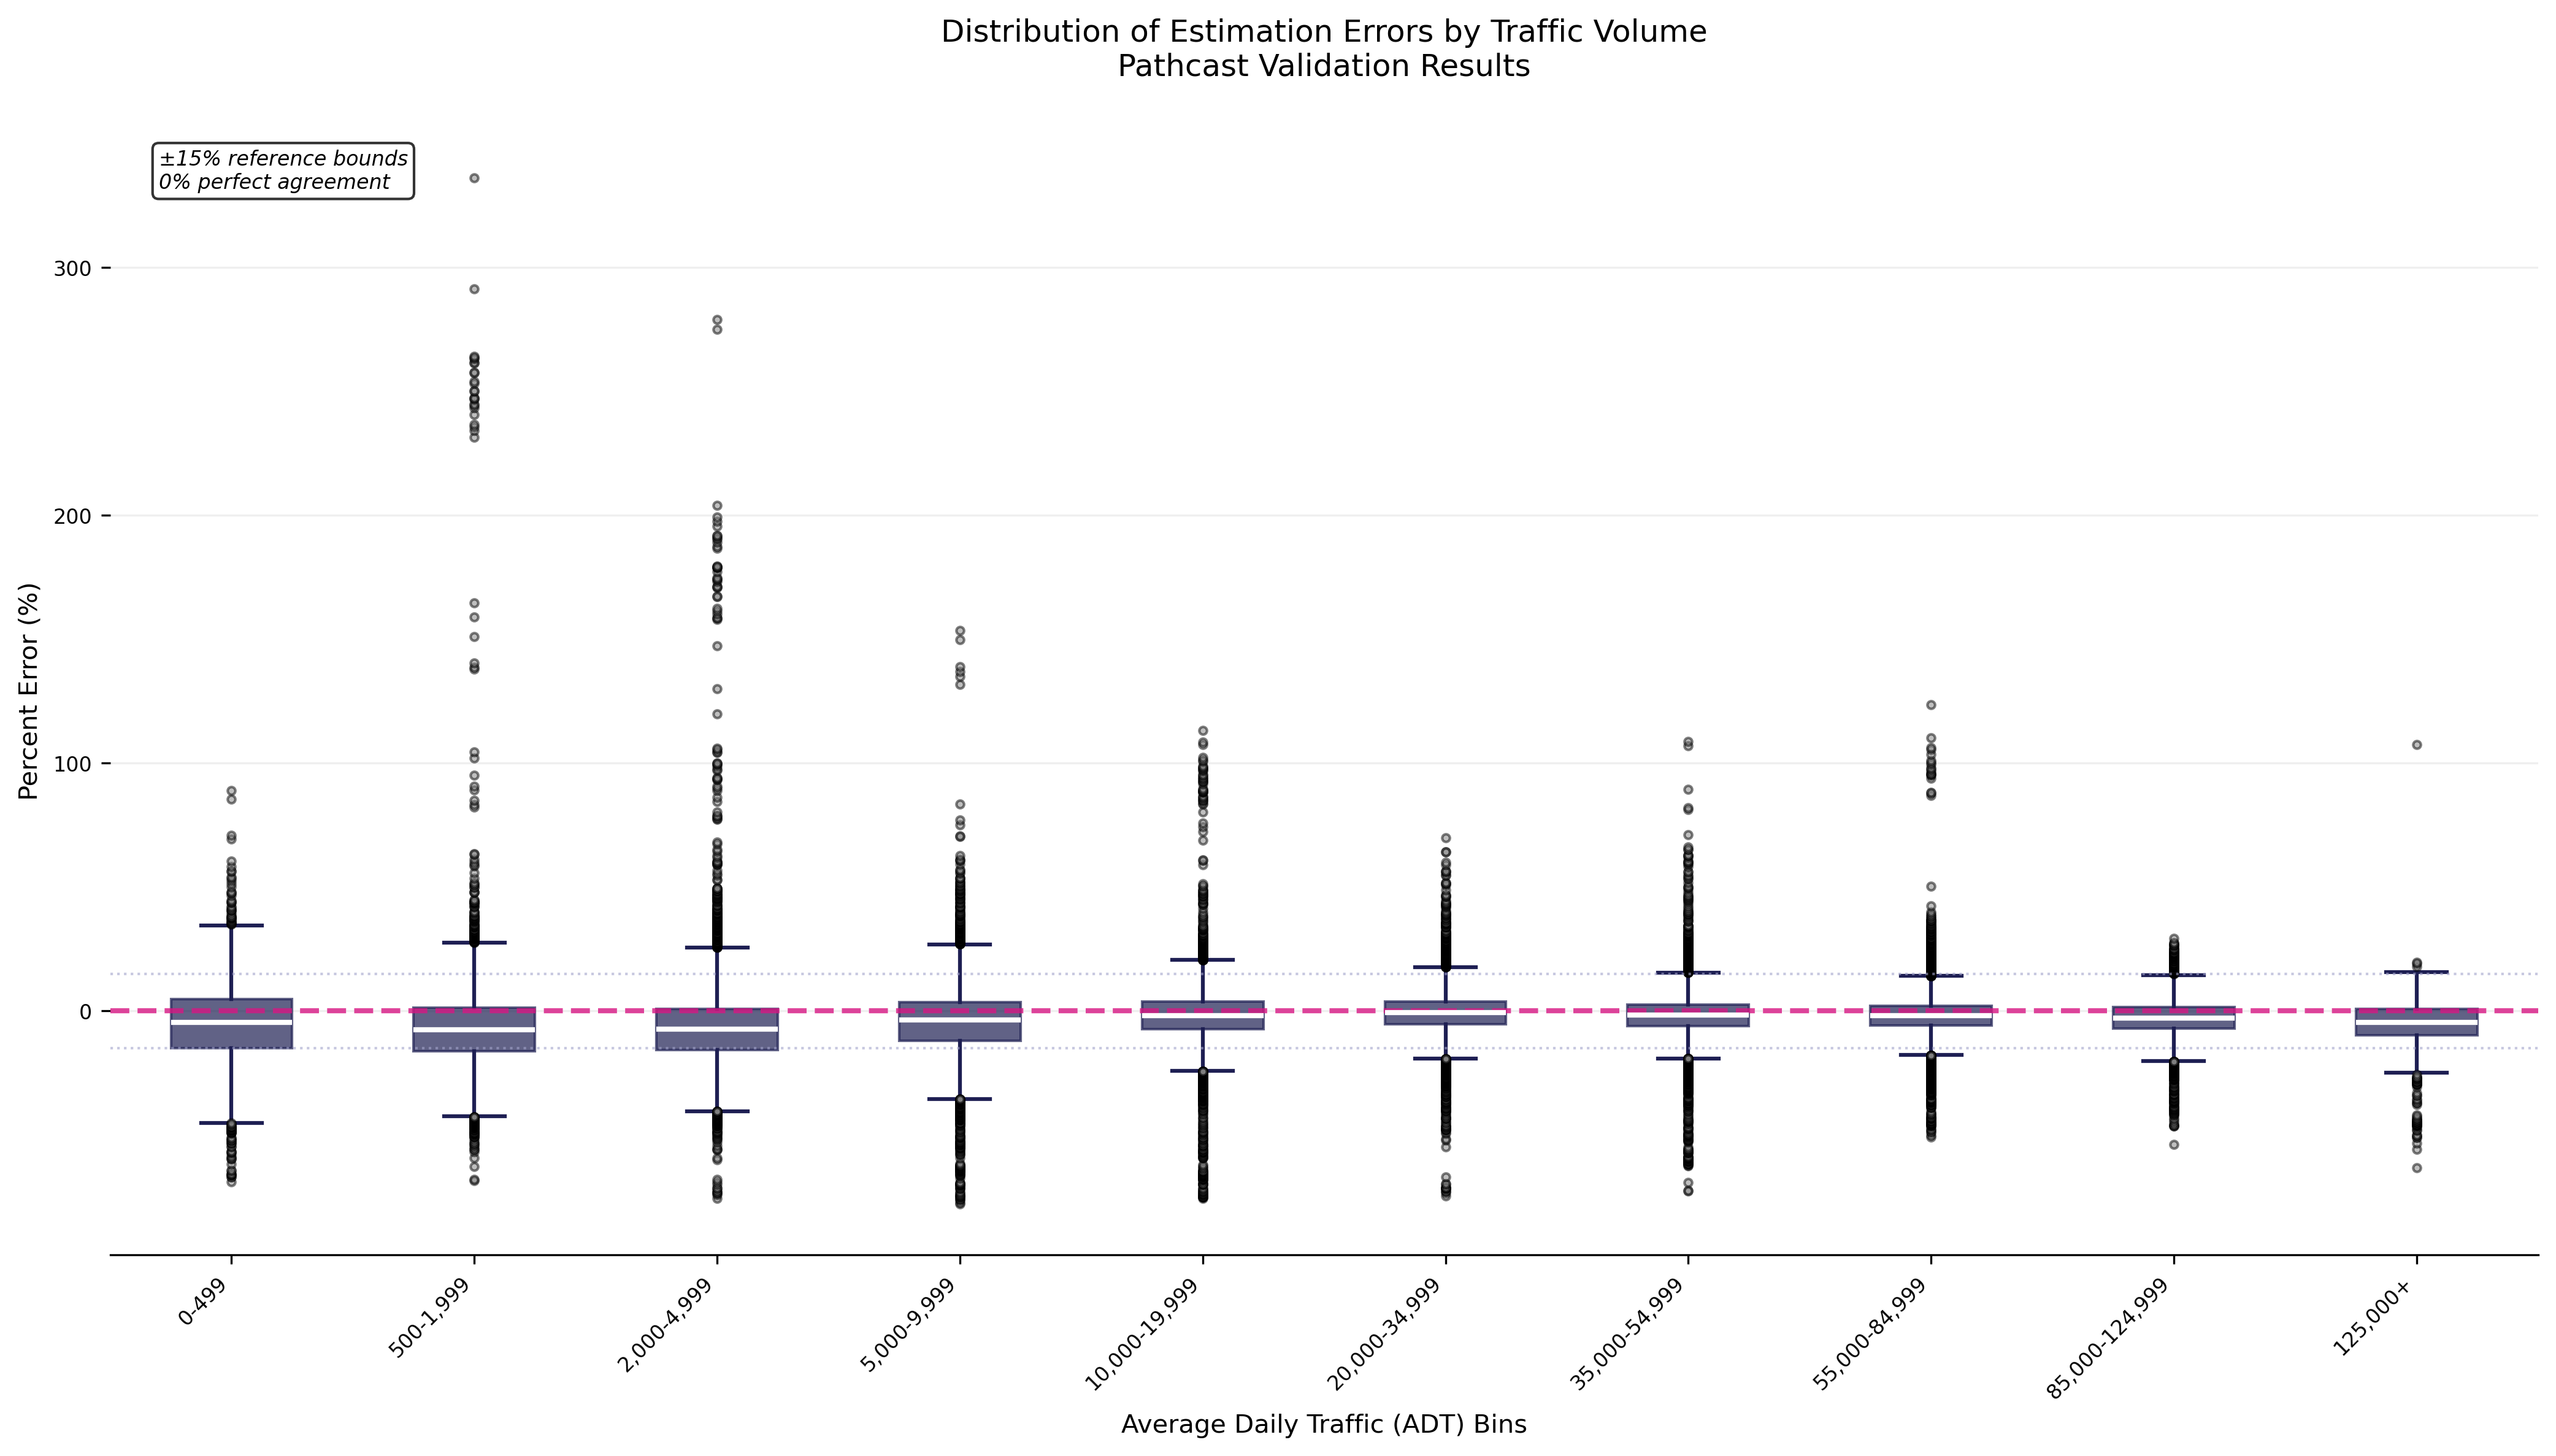
Key Insight: The chart confirms that while lower-volume roads show higher relative variation, higher-volume roads (where most OOH inventory generates impressions) demonstrate exceptional precision with minimal systematic bias.
Industry Context and Standards
Traffic measurement accuracy is fundamental to industry confidence and regulatory compliance. Pathcast's validation results demonstrate measurement precision that meets and exceeds Federal Highway Administration (FHWA) requirements for audience delivery verification, media planning, and campaign optimization.
Industry-Leading Performance: With 98.2 percent correlation (R² = 0.982) and 9.1 percent MAPE across 120,287 monthly comparisons, Pathcast delivers measurement accuracy that exceeds industry standards and supports confident media investment decisions across all traffic volume categories.
Third-Party Verification: This independent validation methodology and results support third-party audit requirements and industry verification standards, providing transparency and accountability for traffic measurement accuracy.
Regulatory Alignment: Methodology follows FHWA Model Validation and Reasonableness Checking Manual guidelines, ensuring compliance with federal standards for traffic measurement systems.
Conclusions and Applications
Measurement Validation Summary
This comprehensive validation demonstrates that Pathcast provides reliable and precise traffic measurement for out-of-home advertising applications. The methodology consistently produces monthly MADT estimates that align closely with physical traffic measurements, with documented accuracy levels across 120,287 monthly comparisons from 7,466 locations and 24 months of data that support media planning, audience delivery verification, and campaign optimization across all traffic volume categories.
Validated Performance Characteristics
Systematic Bias: Median difference of -3.0 percent indicates minimal systematic error across all measurement conditions.
Measurement Precision: Mean Absolute Percent Error of 9.1 percent provides quantified accuracy expectations for planning applications.
Statistical Reliability: R-squared value of 0.982 demonstrates strong correlation between estimated and observed traffic volumes.
Ongoing Validation Framework
Dataset Expansion: Regular expansion of validation dataset maintains measurement accuracy across evolving market conditions and inventory development.
Methodology Refinement: Continued refinement of measurement methodology addresses evolving out-of-home industry requirements for audience measurement and campaign effectiveness analysis.
Technology Integration: Incorporation of emerging measurement technologies and data sources supports continued accuracy for out-of-home advertising applications.
References
- Federal Highway Administration. Model Validation and Reasonableness Checking Manual. Publication No. FHWA-HEP-10-042. Available at: https://www.fhwa.dot.gov/planning/tmip/publications/other_reports/validation_and_reasonableness_2010/fhwahep10042.pdf
Updated 4 months ago